前言
Grafana是一個跨平台、開源的資料視覺化網路應用平台。在使用者設定連接的資料來源之後,Grafana可以在網路瀏覽器裡顯示資料圖表和警告。
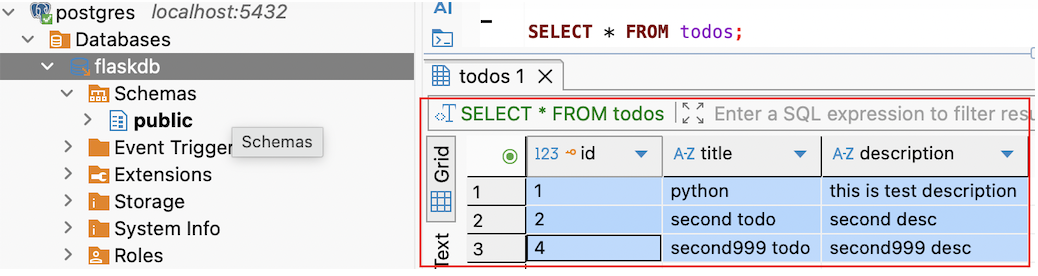
測試資料
下載 Grafana
官方下載連結 : https://grafana.com/grafana/download
tar -zxvf grafana-enterprise_12.3.3_21957728731_darwin_arm64.tar.gz
% Total % Received % Xferd Average Speed Time Time Time Current
Dload Upload Total Spent Left Speed
100 274M 100 274M 0 0 5216k 0 0:00:53 0:00:53 --:--:-- 7237k
啟動 Grafana 服務
請進入目錄並執行以下命令:
% ./bin/grafana server
INFO 02-13\|11:11:51 Starting Grafana logger=settings version=12.3.3 commit=2a14494b2d6ab60f860d8b27603d0ccb264336f6 branch=release-12.3.3 compiled=2026-02-13T11:11:51+08:00

初始設定步驟簡要:
-
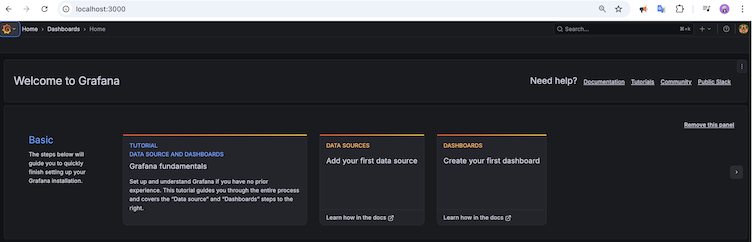
啟動 Grafana 後,預設登入網址為 http://localhost:3000
-
使用帳號 admin / admin 登入並更改密碼
新增 Data Source
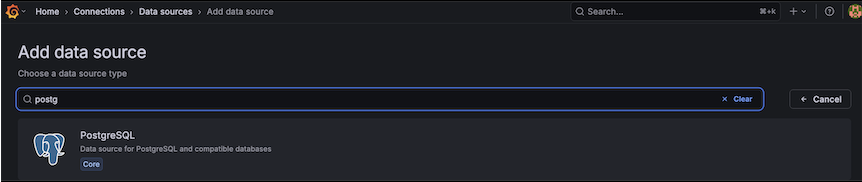
進入「Configuration」新增資料來源,選擇要連接的資料庫類型(如 Prometheus、postgreSQL)
Home > Connections > Data sources > Add data source
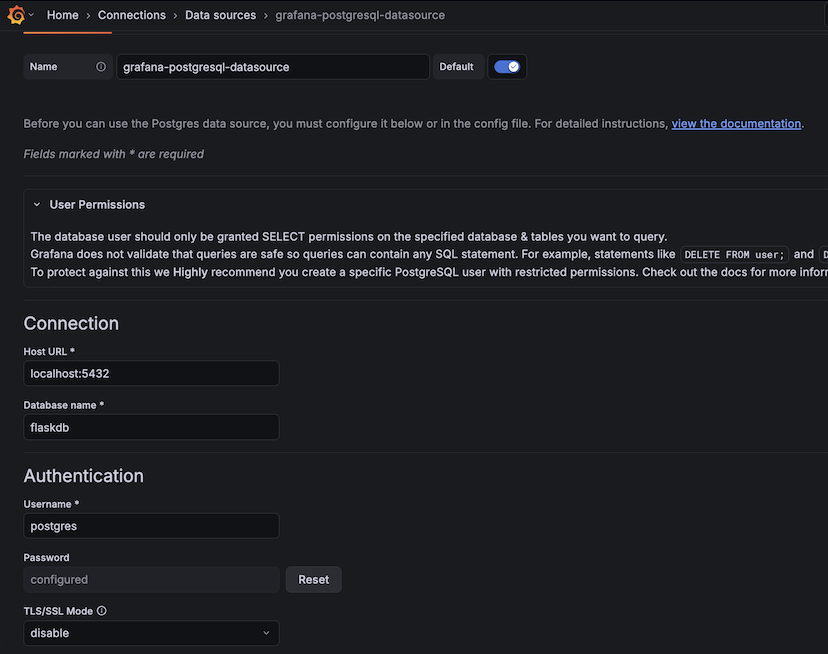
輸入相關設定資料,測試連線
Name: 之後在 panel 選取 data source 時顯示的名稱
Host: IP:port (例 localhost:3306)
Database: 填入資料來源的資料庫名稱
User/Password: 資料庫帳號/密碼
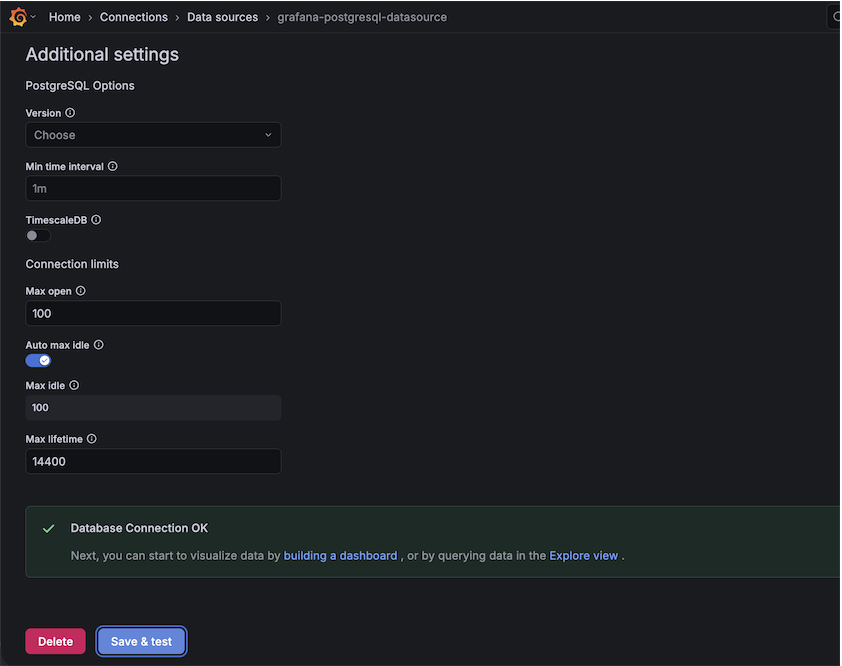
建立Dashboard
測試連線成功後即可開始建立儀表板
Home > Dashboards
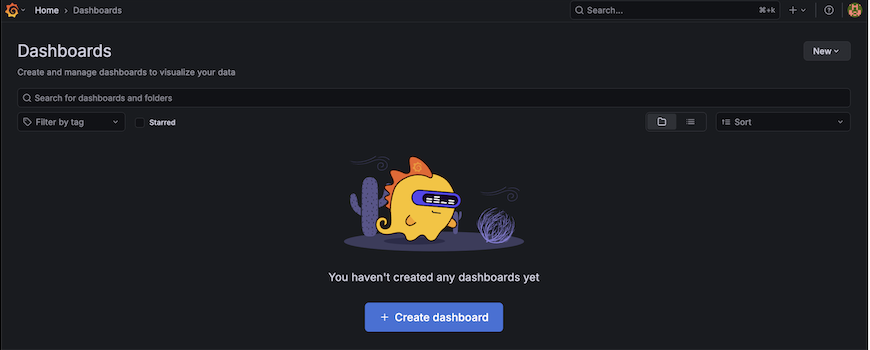
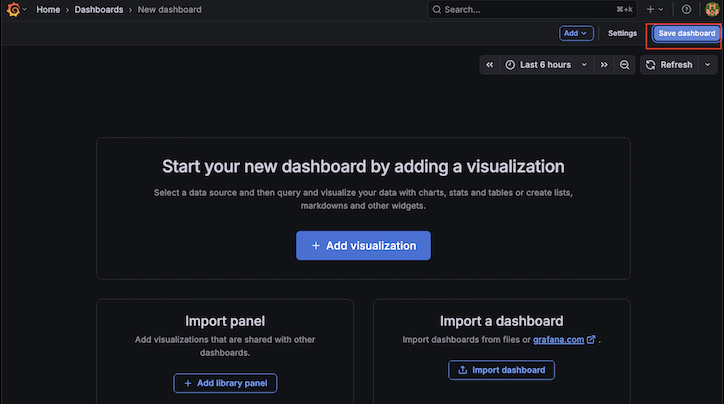
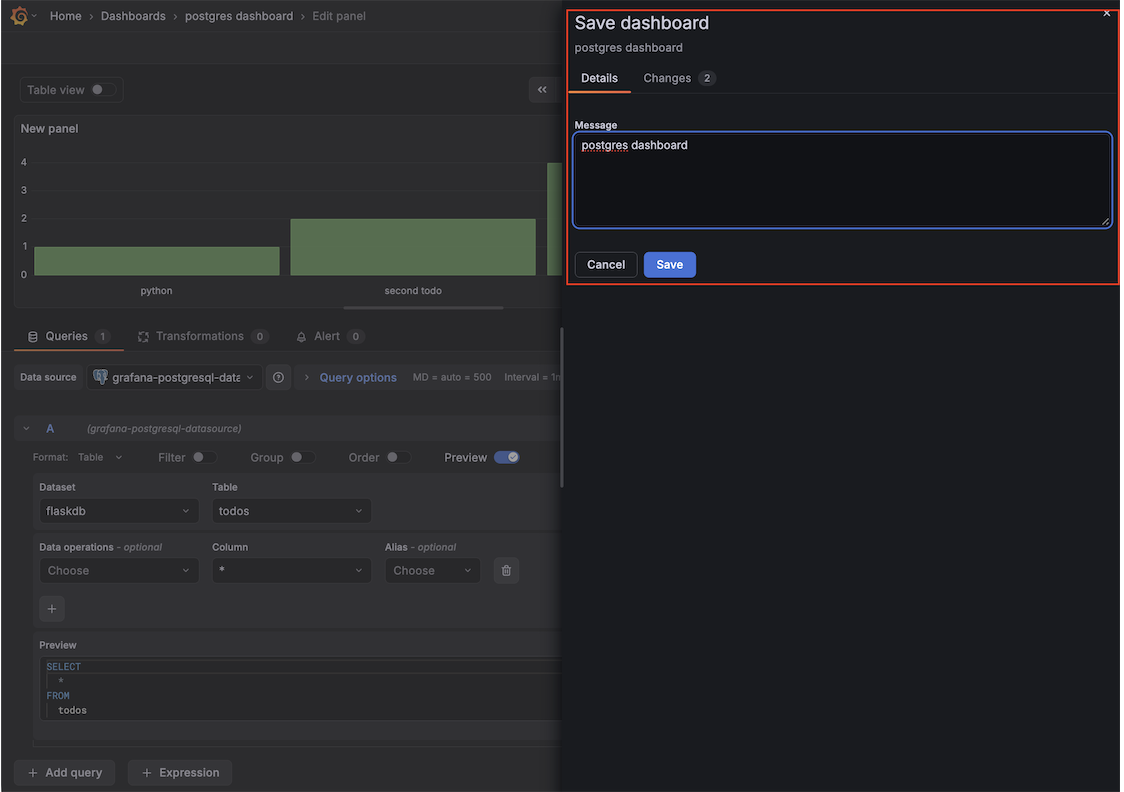
點選 「Save dashboard」
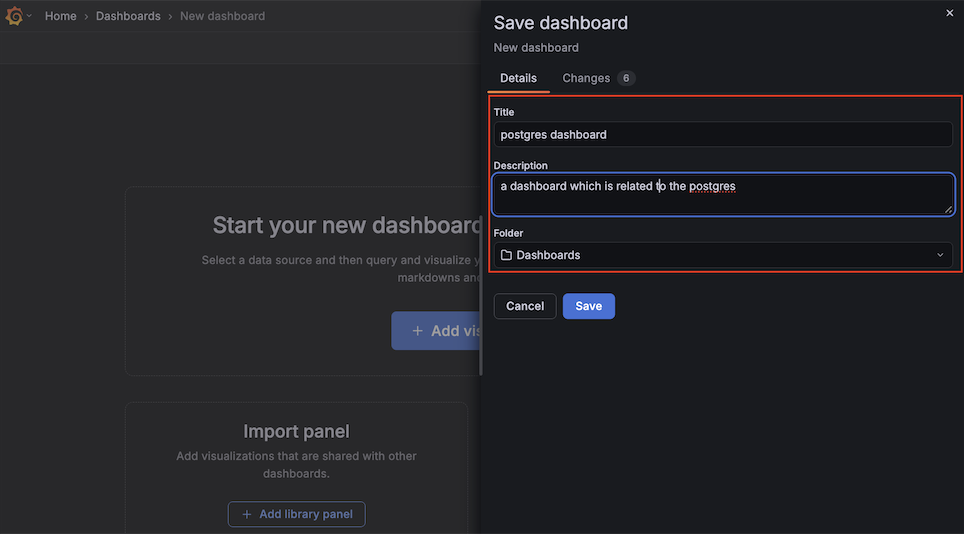
輸入相關設定資料,點選 「Save」
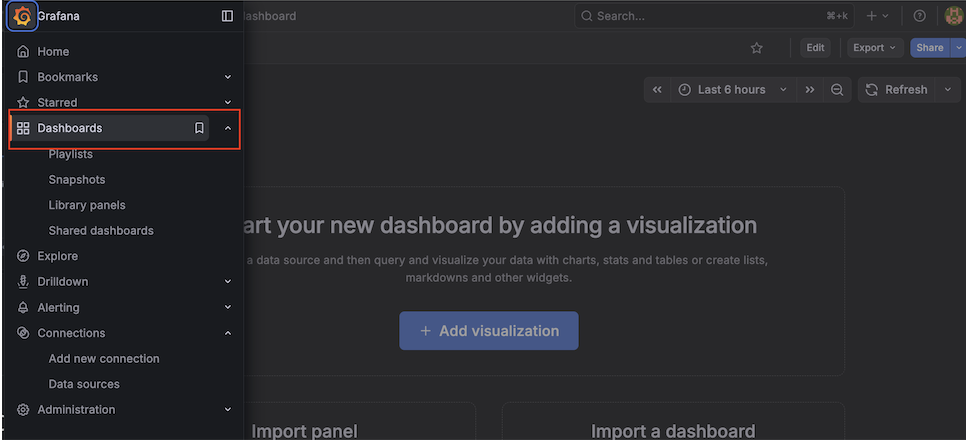
點選「Dashboards」
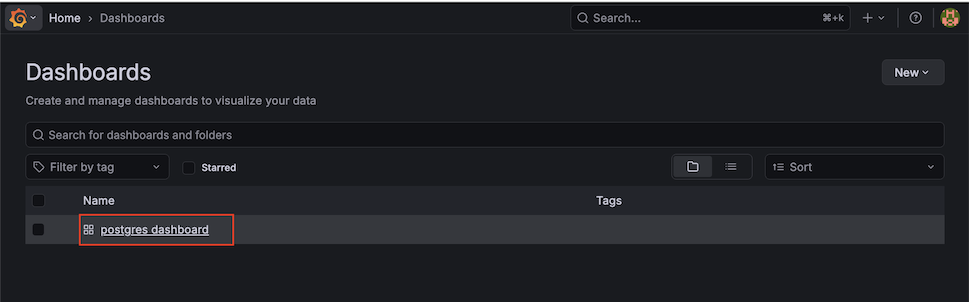
點選「資料來源」 ,這裡我們選 postgres dashboard
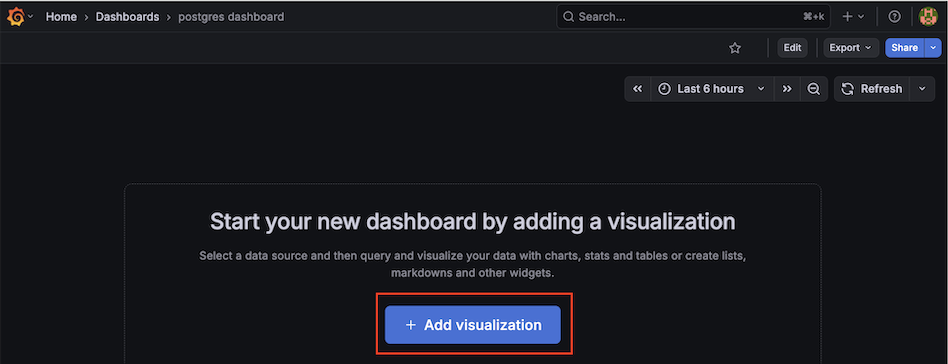
點選「Add visualization」
選擇資料來源
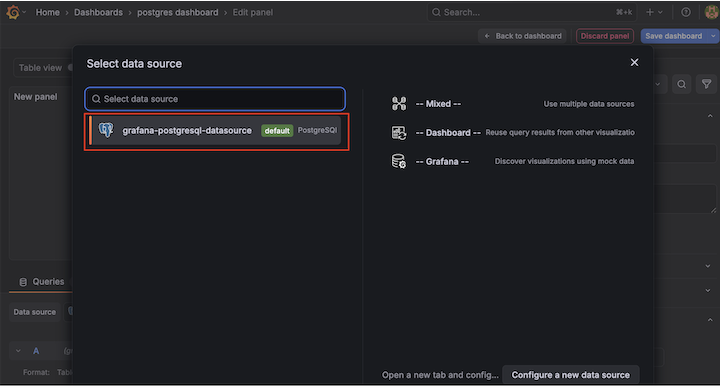
資料來源(data source),我這部分使用PostgreSQL資料庫,SQL搜尋的語法也是寫在這裡
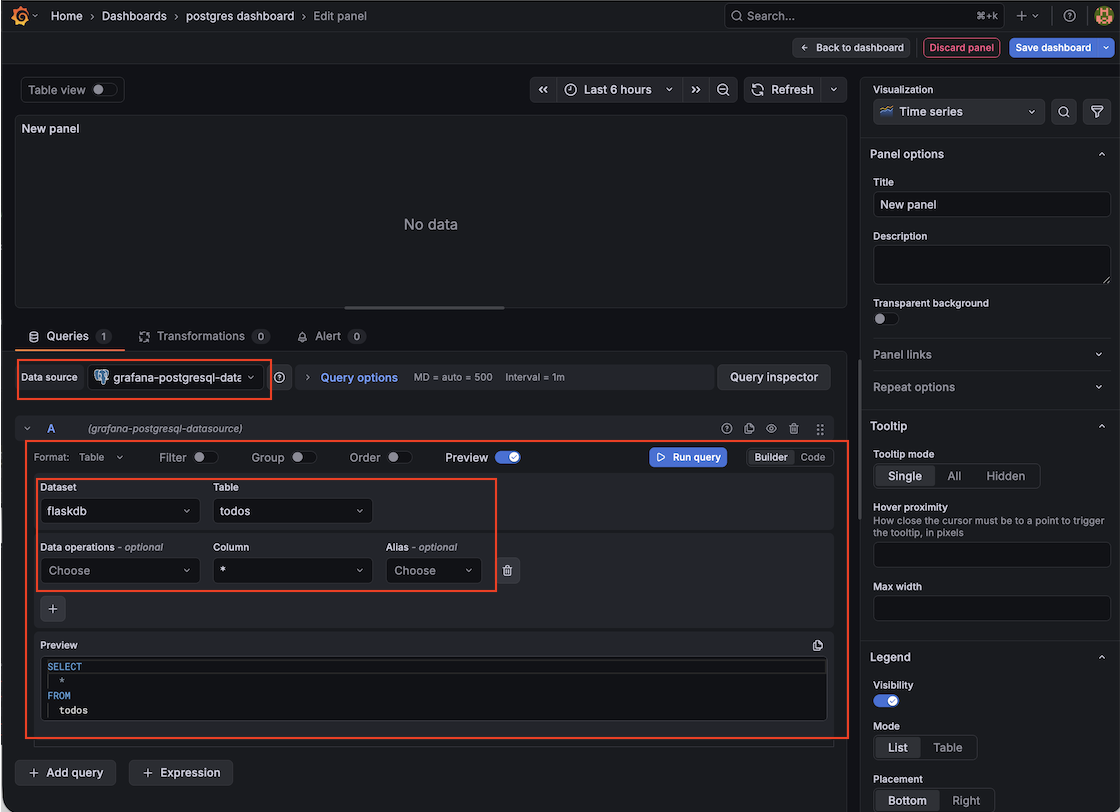
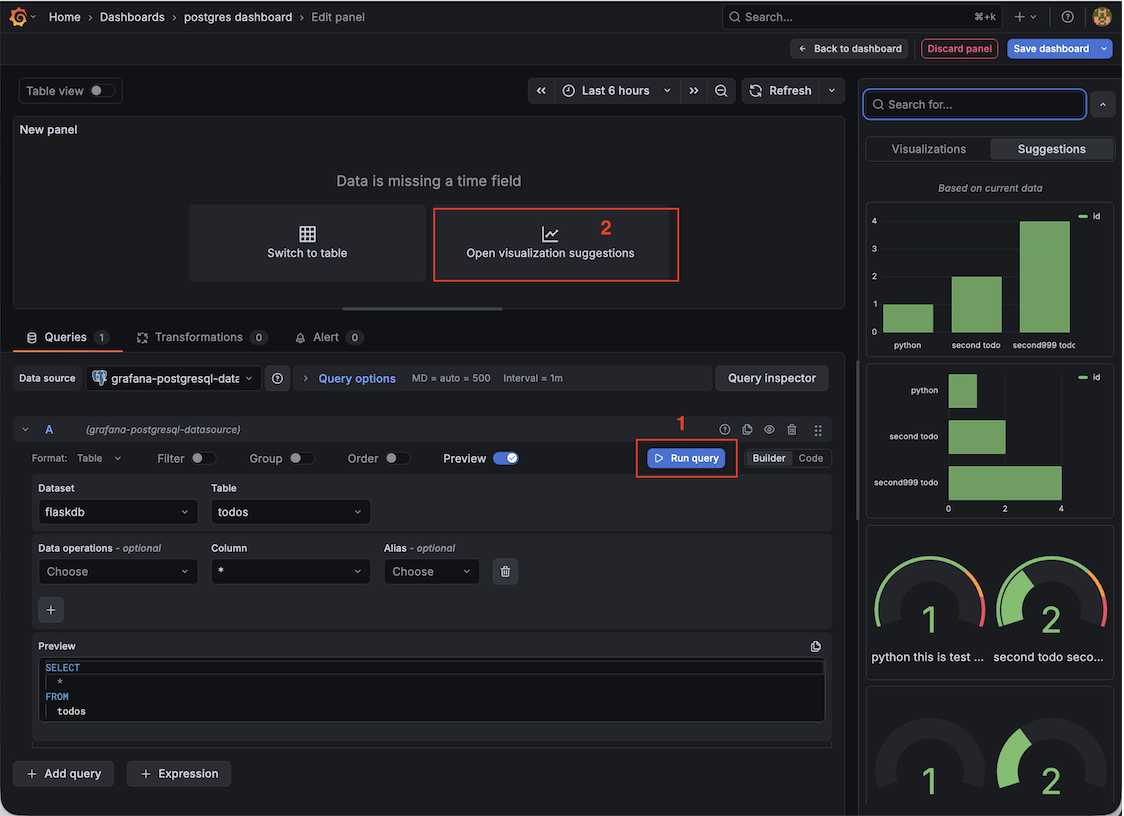
右邊 Visualizations,選擇 panel 類型(time series, bar chart, gauge, table等等),以及 panel 的設定(title, style, mapping)都在這邊更改
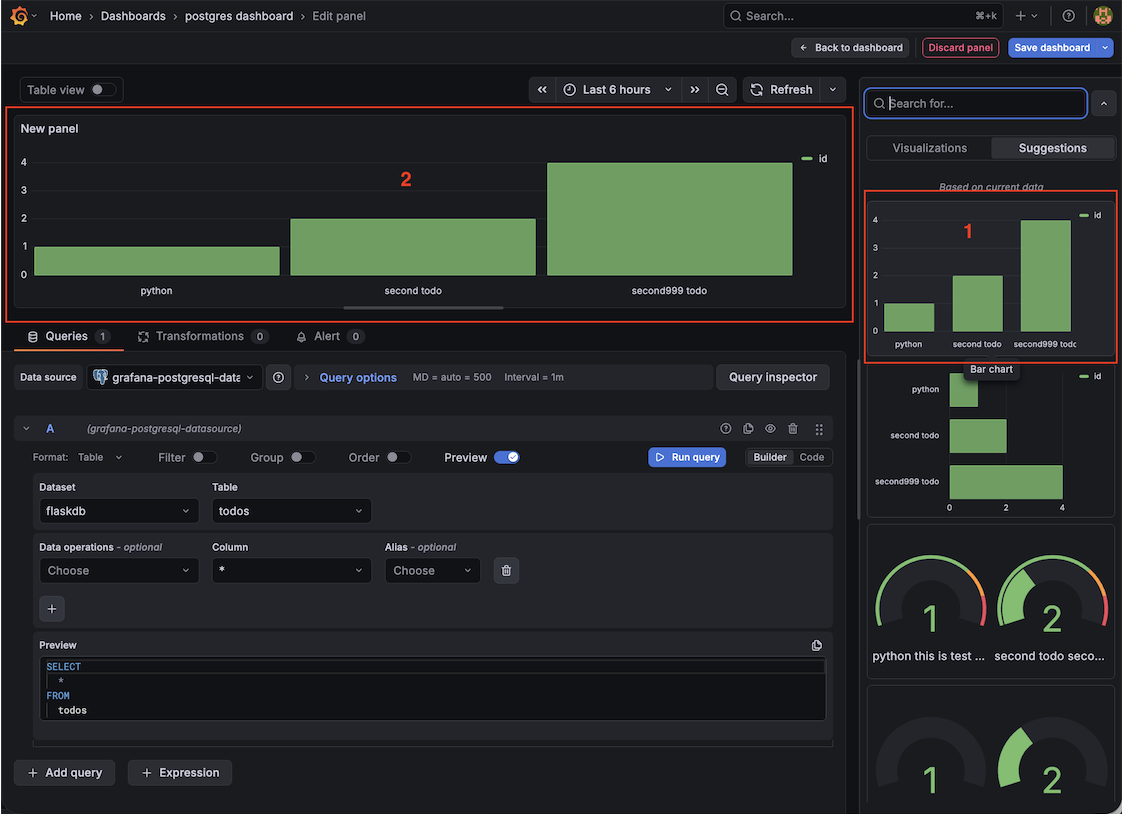
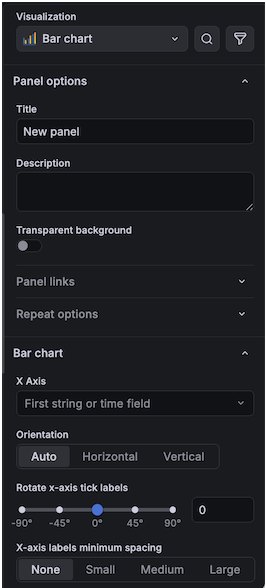
儲存設定
此僅簡單介紹測試
更詳細請參看 https://grafana.com/docs/grafana-cloud/monitor-applications/frontend-observability/