目录:
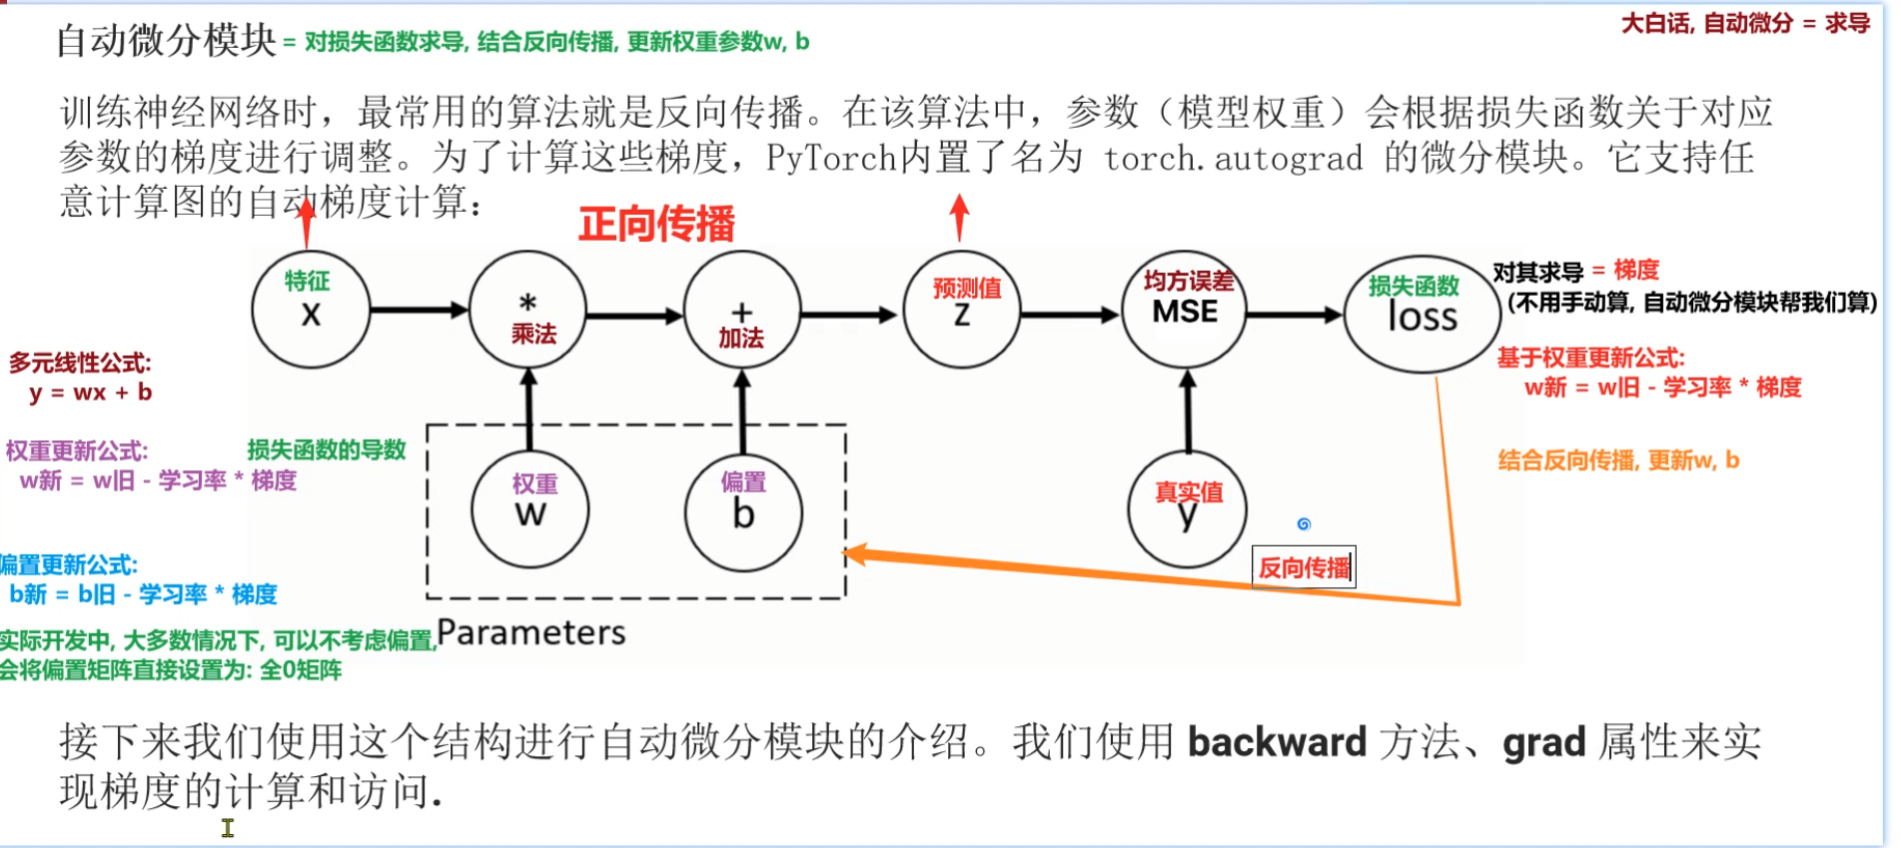
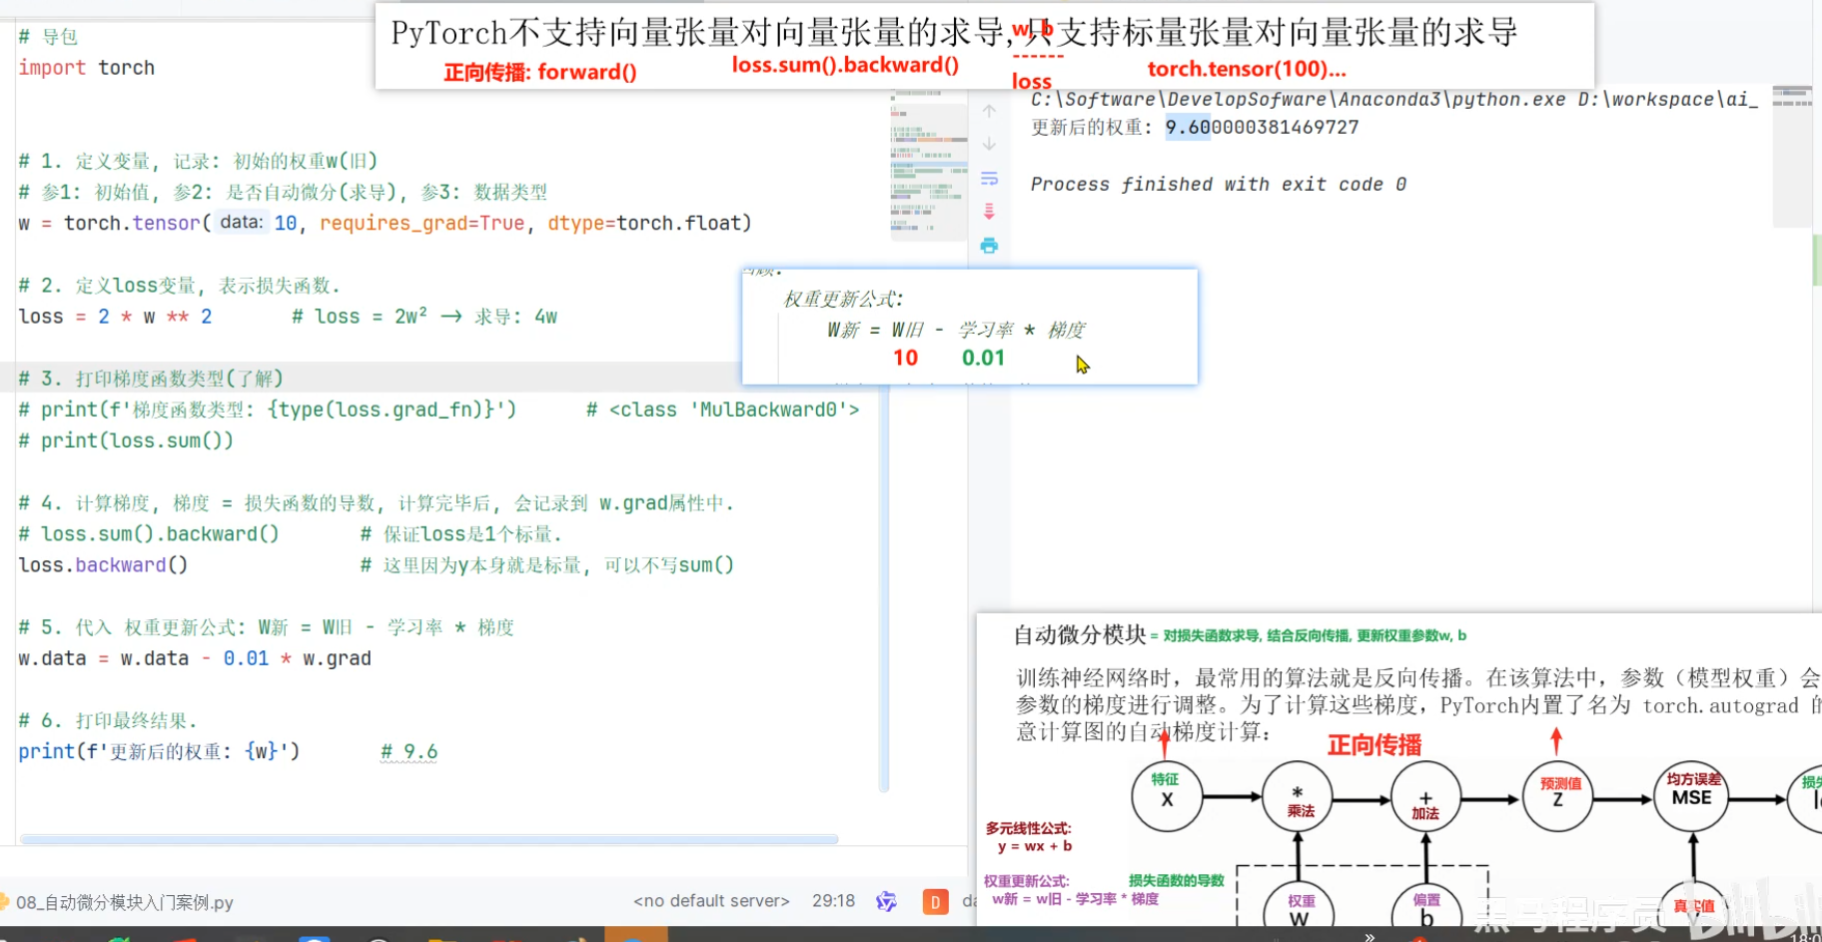
1、自动微分模块
2、用自动微分训练线性回归模型案例
2.1、代码示例
python
import torch
import torch.nn as nn
import torch.optim as optim
from torch.utils.data import Dataset, DataLoader, TensorDataset
import matplotlib.pyplot as plt
import numpy as np

# ------------------------------------------------------
# 1. 准备数据(生成模拟的线性关系数据 y = w*x + b + 噪声)
# ------------------------------------------------------
def create_dataset(num_samples=100):
    # 真实参数(图片中显示:w=27.47805, b=14.5)
    true_w = 27.47805
    true_b = 14.5

    # 生成输入特征 x(随机分布)
    x = torch.randn(num_samples, 1)  # 形状 (100, 1),1个输入特征

    # 生成带噪声的标签 y = w*x + b + 噪声
    y = true_w * x + true_b + torch.randn(num_samples, 1) * 5.0  # 添加噪声

    return x, y

# 调用函数生成数据
x, y = create_dataset(num_samples=100)

# ------------------------------------------------------
# 2. 数据预处理:创建 Dataset 和 DataLoader
# ------------------------------------------------------
dataset = TensorDataset(x, y)  # 封装特征和标签
dataloader = DataLoader(dataset, batch_size=16, shuffle=True)  # 批次大小16,打乱数据

# ------------------------------------------------------
# 3. 定义模型、损失函数和优化器
# ------------------------------------------------------
# 线性回归模型(输入特征数=1,输出特征数=1)
model = nn.Linear(in_features=1, out_features=1)

# 损失函数:均方误差(MSE)
criterion = nn.MSELoss()

# 优化器:随机梯度下降(SGD),学习率0.01
optimizer = optim.SGD(model.parameters(), lr=0.01)

# ------------------------------------------------------
# 4. 训练模型
# ------------------------------------------------------
epochs = 100  # 训练轮次
loss_list = []  # 记录每轮的平均损失

for epoch in range(epochs):
    total_loss = 0.0  # 累计每轮损失
    total_sample = 0   # 累计样本数

    # 按批次训练 (train_x:特征, train_y:标签)
    for train_x, train_y in dataloader:
        # 模型预测(前向传播)
        y_pred = model(train_x)

        # 计算损失(注意:需将 train_y 形状调整为与 y_pred 一致)
        loss = criterion(y_pred, train_y.reshape(-1, 1))  # reshape(-1,1) 确保形状匹配

        # 反向传播和参数更新
        optimizer.zero_grad()  # 清空梯度
        loss.backward()        # 计算梯度
        optimizer.step()       # 更新参数

        # 累计损失和样本数
        total_loss += loss.item()
        total_sample += 1

    # 计算每轮平均损失并记录
    avg_loss = total_loss / total_sample
    loss_list.append(avg_loss)

    # 打印训练进度(每10轮打印一次)
    if (epoch + 1) % 10 == 0:
        print(f"Epoch [{epoch+1}/{epochs}], 平均损失: {avg_loss:.4f}")

# ------------------------------------------------------
# 5. 打印模型参数和损失曲线
# ------------------------------------------------------
print("\n训练完成!")
print(f"模型参数 - 权重 w: {model.weight.item():.4f}, 偏置 b: {model.bias.item():.4f}")
print(f"{epochs}轮的平均损失分别为: {loss_list}")

# 绘制损失曲线
plt.figure(figsize=(10, 4))
plt.plot(range(epochs), loss_list, label='平均损失')
plt.title('损失值曲线变化图')
plt.xlabel('Epoch')
plt.ylabel('Loss')
plt.grid(True)
plt.legend()
plt.show()

# ------------------------------------------------------
# 6. 绘制预测值与真实值对比图
# ------------------------------------------------------
# 计算预测值和真实值(排序后方便绘图)
y_pred = model(x).detach().numpy()  # 推理时用 detach() 切断计算图
y_true = y.numpy()

# 按 x 排序(保证绘图时曲线连续)
sorted_indices = np.argsort(x.numpy().flatten())
x_sorted = x.numpy().flatten()[sorted_indices]
y_pred_sorted = y_pred.flatten()[sorted_indices]
y_true_sorted = y_true.flatten()[sorted_indices]

# 绘制散点图(样本分布)和折线图(预测 vs 真实)
plt.figure(figsize=(10, 6))
plt.scatter(x, y, label='样本数据', color='blue', alpha=0.5)  # 散点图
plt.plot(x_sorted, y_pred_sorted, label='预测值', color='red', linewidth=2)  # 预测线
plt.plot(x_sorted, y_true_sorted, label='真实值', color='green', linewidth=2)  # 真实线
plt.title('预测值和真实值的关系')
plt.xlabel('特征 x')
plt.ylabel('标签 y')
plt.legend()
plt.grid(True)
plt.show()
待完善。。。。。。