记录下工作中使用echarts做出的特殊组件
html
import { defineComponent } from 'vue'
import { FONT_SIZE, COLOR_LIGHT_ORG } from './createChart'
const props = {
propData: {
type: Array,
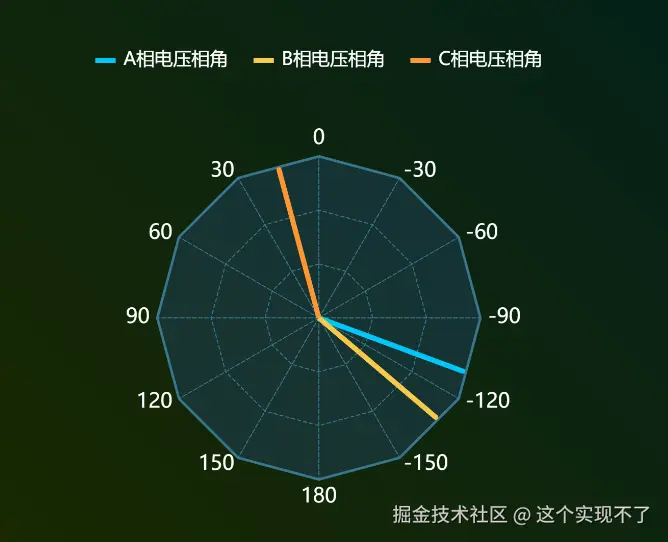
default: () => [
{ name: 'A相电压相角', value: -110 },
{ name: 'B相电压相角', value: -130 },
{ name: 'C相电压相角', value: 15 },
],
},
showLegend: {
type: Boolean,
default: true,
},
lineColorArray: {
type: Array,
default: () => ['#00C7FA', '#F7C948', COLOR_LIGHT_ORG],
},
}
export default defineComponent({
props,
data() {
return {}
},
created() {},
mounted() {
this.init()
this.$watch(
() => this.$props, // 监听整个 props 对象
() => {
this.init()
},
{ deep: true, immediate: false },
)
},
beforeDestroy() {
this.chart?.dispose?.()
},
methods: {
init() {
const indicator = this.generateMainIndicators()
const option = {
legend: [
{
show: this.showLegend,
left: 'center',
itemWidth: 40,
itemHeight: 10,
icon: 'rect',
itemGap: 50,
data: this.propData.map((item, index) => ({
name: item.name,
itemStyle: {
color: this.lineColorArray[index] || '#FFf',
},
})),
itemStyle: {
borderWidth: 0,
borderColor: 'transparent',
},
textStyle: {
fontSize: FONT_SIZE,
color: '#fff',
padding: [0, 10],
},
},
],
tooltip: {
show: true,
trigger: 'item',
axisPointer: {
type: 'none',
},
appendToBody: true,
formatter: () => {
let content = ''
this.propData.map((item, index) => {
content += `${item.name}: <span style="color:${this.lineColorArray[index] || '#FFf'}">${item.value}</span><br/>`
})
return content
},
textStyle: {
fontSize: 50,
color: '#fff',
padding: [20, 100, 20, 100],
},
backgroundColor: '#0C3E5F',
borderColor: '#0CB6FF',
borderWidth: 4,
},
radar: [
{
// 第一个雷达:显示内圈
radius: '60%',
splitNumber: 3,
startAngle: 90, // 添加开始角度配置
center: ['50%', '50%'],
axisLine: {
show: true,
lineStyle: {
color: '#387892',
type: 'dashed',
width: 2,
},
},
splitLine: {
lineStyle: {
color: '#387892',
type: 'dashed',
width: 2,
},
},
splitArea: {
show: true,
areaStyle: {
// 单色背景
color: 'rgba(29, 65, 90, 0.5)',
opacity: 1,
},
},
axisName: {
show: true, // 确保显示名称
color: '#ffffff', // 名称颜色
fontSize: 40,
},
indicator,
},
{
// 第二个雷达:只显示最外圈
radius: '60%',
splitNumber: 1, // 只显示最外圈
startAngle: 90, // 添加开始角度配置
center: ['50%', '50%'],
axisLine: {
show: false,
},
axisName: {
show: false, // 确保显示名称
},
splitLine: {
lineStyle: {
color: '#387892',
type: 'solid', // 实线
width: 5, // 粗线
},
},
splitArea: {
show: false,
},
axisLabel: {
show: false,
},
indicator,
},
{
// 第二个雷达:只显示最外圈
radius: '60%',
splitNumber: 1, // 只显示最外圈
startAngle: 90, // 添加开始角度配置
center: ['50%', '50%'],
axisLine: {
show: false,
},
axisName: {
show: false, // 确保显示名称
},
splitLine: {
show: false,
},
splitArea: {
show: false,
},
axisLabel: {
show: false,
},
indicator: this.generateContinuousIndicators(),
},
],
series: this.getSeries(),
}
this.draw(option)
},
draw(option) {
const dom = this.$refs.chart
if (!this.chart) {
this.chart = echarts.init(dom, null, {
renderer: 'canvas',
})
}
this.chart.setOption(option, true)
},
getSeries() {
return this.propData.map((item, index) => {
return {
name: item.name,
type: 'radar',
radarIndex: 2,
symbolSize: 0,
data: [
{
value: this.createDirectionData(item.value),
name: item.name,
lineStyle: {
color: this.lineColorArray[index] || '#fff',
width: 10,
},
},
],
}
})
},
generateContinuousIndicators() {
const indicators = []
for (let angle = 0; angle < 180; angle++) {
indicators.push({
name: angle.toString(),
max: 100,
})
}
for (let angle = -179; angle < 0; angle++) {
indicators.push({
name: angle.toString(),
max: 100,
})
}
return indicators
},
createDirectionData(angle) {
const indicators = this.generateContinuousIndicators()
const index = indicators.findIndex((item) => +item.name === +angle)
return indicators.map((_, findex) => {
return index === findex ? 95 : 0
})
},
generateMainIndicators() {
const targetAngles = [0, 30, 60, 90, 120, 150, 180, -150, -120, -90, -60, -30]
const mainIndicators = []
for (const angle of targetAngles) {
mainIndicators.push({
name: angle.toString(),
max: 100,
})
}
return mainIndicators
},
},
})