javascript
//eachets 社区样式调整
var category = [
{
value: 47.32,
series: "性别",
name: "女生",
},
{
value: 52.68,
series: "性别",
name: "男生",
},
]
var grid = {
left: 80,
top: 20,
right: 80,
bottom: 15,
}
var total = 100
var datas = category.map((item) => item.value);
option = {
backgroundColor: '#0e202d',
xAxis: {
max: 200,
splitLine: {
show: false,
},
axisLine: {
show: false,
},
axisLabel: {
show: false,
},
axisTick: {
show: false,
},
},
grid: this.grid,
yAxis: [
{
type: "category",
inverse: true, // 根据需要设置为 true 或 false
data: category.map((item) => item.name),
axisLine: {
show: false,
},
axisTick: {
show: false,
},
axisLabel: {
show: false,
},
},
],
series: [
{
// 内
type: "bar",
barWidth: 9,
symbolOffset: [5, 5],
symbolSize: [3, 13],
legendHoverLink: false,
silent: true,
itemStyle: {
normal: {
color: (params) => {
var color;
color = {
type: "linear",
x: 0,
y: 0,
x2: 1,
y2: 0,
colorStops: [
{
offset: 0,
color: '#42B5F2', // 0% 处的颜色
},
{
offset: 1,
color: '#44DCE2', // 100% 处的颜色
},
],
};
return color;
},
},
},
label: {
normal: {
formatter: "{b}",
textStyle: {
color: "#FFFFFF",
fontSize: 13,
},
position: "left",
distance: 5, // 向右偏移位置
show: true,
},
},
// label: {
// show: true,
// position: "insideBottomLeft",
// // distance: 20,
// offset: this.labeloffset,
// fontSize: 13,
// color: "#CFDEED",
// formatter: "{b}",
// },
data: category,
z: 1,
animationEasing: "elasticOut",
},
{
// 分隔
type: "pictorialBar",
itemStyle: {
normal: {
color: "#1E4067",
},
},
symbolRepeat: "fixed",
symbolMargin: 2,
symbol: "rect",
symbolClip: true,
symbolSize: [3, 13],
symbolPosition: "start",
symbolOffset: [1, -1],
symbolBoundingData: total,
data: new Array(category.length).fill(total),
z: 2,
animationEasing: "elasticOut",
},
// {
// // 分隔
// type: "pictorialBar",
// itemStyle: {
// normal: {
// color: "#07314a"
// }
// },
// symbolRepeat: "fixed",
// symbolMargin: 2,
// symbol: "rect",
// symbolClip: true,
// symbolSize: [3, 13],
// symbolPosition: "start",
// symbolOffset: [1, -1],
// symbolBoundingData: total,
// data: [total, total, total, total],
// z: 2,
// animationEasing: "elasticOut",
// },
{
// 外边框
type: "pictorialBar",
symbol: "rect",
symbolBoundingData: total,
itemStyle: {
normal: {
color: "none",
},
},
label: {
normal: {
formatter: (params) => {
return params.data;
},
textStyle: {
color: '#fff',
fontSize: 20,
fontFamily: "D-DIN",
},
position: "right",
distance: 5, // 向右偏移位置
show: true,
},
},
// label: {
// normal: {
// formatter: (params) => {
// var text;
// text = "{b|" + params.value + "}" + "{a|%}";
// return text;
// },
// rich: {
// a: {
// color: "#D8F0FF",
// fontSize: 12,
// align: "center", // 居中文本
// lineHeight: 20,
// },
// b: {
// color: "#37E6FD",
// fontSize: 16,
// lineHeight: 20,
// fontFamily: "D-DIN",
// align: "right", // 右对齐文本
// },
// },
// position: "insideBottomRight",
// // distance: 20,
// offset: this.labeloffset2,
// fontSize: 13,
// show: this.showValue,
// },
// },
data: datas,
z: 5,
animationEasing: "elasticOut",
},
{
name: "外框",
type: "bar",
barGap: "-120%", // 设置外框粗细
data: new Array(category.length).fill(total), // 创建一个长度与 category 相同的数组,每个元素都是 total
barWidth: 13,
itemStyle: {
normal: {
color: "transparent", // 填充色
barBorderColor: '#44DAE2', // 边框色
barBorderWidth: 1, // 边框宽度
barBorderRadius: 2, // 圆角半径
label: {
// 标签显示位置
show: false,
position: "top", // insideTop 或者横向的 insideLeft
},
},
},
z: 5,
},
],
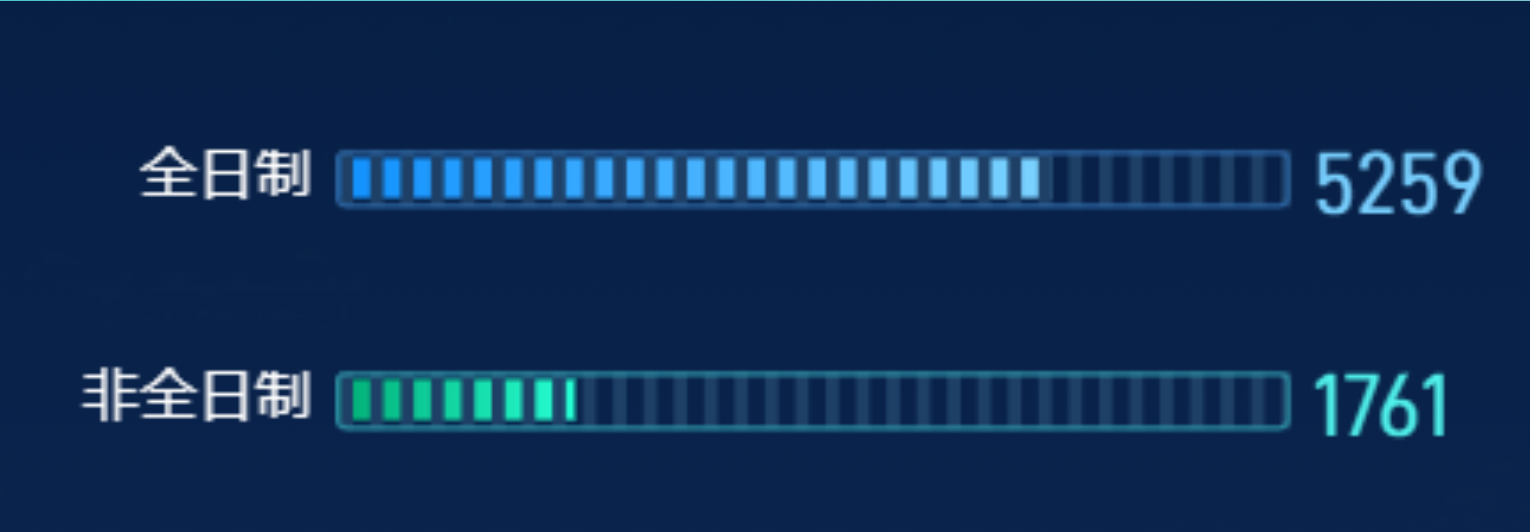
};实现效果: