<template>
<div id="equipChart" style="width: 100%; height: 500px;"></div>
</template>
<script setup>
import { onMounted, watch, onUnmounted } from 'vue'
import * as echarts from 'echarts'
import 'echarts-gl'
let myChart = null
let chartOption = null
let selectedIndex = ''
let hoveredIndex = ''
const props = defineProps({
online: { type: Number, default: 0 },
offline: { type: Number, default: 0 },
fault: { type: Number, default: 0 }
})
watch(
() => [props.online, props.offline, props.fault],
() => { initChartEquip() },
{ immediate: true, deep: true }
)
onMounted(() => { initChartEquip() })
onUnmounted(() => {
if (myChart) myChart.dispose()
})
function getParametricEquation (startRatio, endRatio, isSelected, isHovered, k, h) {
const midRatio = (startRatio + endRatio) / 2
const startRadian = startRatio * Math.PI * 2
const endRadian = endRatio * Math.PI * 2
const midRadian = midRatio * Math.PI * 2
if (startRatio === 0 && endRatio === 1) isSelected = false
k = typeof k !== 'undefined' ? k : 1 / 4
const offsetX = isSelected ? Math.cos(midRadian) * 0.05 : 0
const offsetY = isSelected ? Math.sin(midRadian) * 0.05 : 0
const hoverRate = isHovered ? 1.02 : 1
return {
u: { min: -Math.PI, max: Math.PI * 3, step: Math.PI / 32 },
v: { min: 0, max: Math.PI * 2, step: Math.PI / 20 },
x: function (u, v) {
if (u < startRadian) return offsetX + Math.cos(startRadian) * (1 + Math.cos(v) * k) * hoverRate
if (u > endRadian) return offsetX + Math.cos(endRadian) * (1 + Math.cos(v) * k) * hoverRate
return offsetX + Math.cos(u) * (1 + Math.cos(v) * k) * hoverRate
},
y: function (u, v) {
if (u < startRadian) return offsetY + Math.sin(startRadian) * (1 + Math.cos(v) * k) * hoverRate
if (u > endRadian) return offsetY + Math.sin(endRadian) * (1 + Math.cos(v) * k) * hoverRate
return offsetY + Math.sin(u) * (1 + Math.cos(v) * k) * hoverRate
},
z: function (u, v) {
if (u < -Math.PI * 0.5) return Math.sin(u)
if (u > Math.PI * 2.5) return Math.sin(u) * h * 0.18
return Math.sin(v) > 0 ? 1 * h * 0.18 : -1
}
}
}
function getPie3D (pieData, internalDiameterRatio = 0.65) {
const series = []
let sumValue = 0
let startValue = 0
let endValue = 0
const legendData = []
const k = (1 - internalDiameterRatio) / (1 + internalDiameterRatio)
pieData.forEach(item => { sumValue += item.value })
pieData.forEach((item, i) => {
endValue = startValue + item.value
const seriesItem = {
name: item.name,
type: 'surface',
parametric: true,
wireframe: { show: false },
pieData: item,
pieStatus: { selected: false, hovered: false, k },
itemStyle: {
color: item.color,
opacity: 0.3,
// 核心修改:增强边框效果
borderColor: 'rgba(255,255,255,0.9)', // 边框更亮
borderWidth: 3, // 边框宽度增加
borderType: 'solid', // 实线边框
// 增强光影对比,让边缘更突出
shadowColor: 'rgba(0, 0, 0, 0.9)',
shadowBlur: 12,
shadowOffsetX: 2,
shadowOffsetY: 2
}
}
series.push(seriesItem)
series[i].pieData.startRatio = startValue / sumValue
series[i].pieData.endRatio = endValue / sumValue
series[i].parametricEquation = getParametricEquation(
series[i].pieData.startRatio,
series[i].pieData.endRatio,
false, false, k, series[i].pieData.value
)
startValue = endValue
legendData.push(item.name)
})
series.push({
name: 'mouseoutSeries',
type: 'surface',
parametric: true,
wireframe: { show: false },
itemStyle: { opacity: 0 },
parametricEquation: {
u: { min: 0, max: Math.PI * 2, step: Math.PI / 20 },
v: { min: 0, max: Math.PI, step: Math.PI / 20 },
x: function (u, v) { return Math.sin(v) * Math.sin(u) * 1.01 + Math.sin(u) * 1.01 },
y: function (u, v) { return Math.sin(v) * Math.cos(u) * 1.01 + Math.cos(u) * 1.01 },
z: function (u, v) { return Math.cos(v) > 0 ? 0.18 : -0.3 }
}
})
return {
backgroundColor: 'rgba(0,0,0,0)',
legend: {
data: legendData,
right: 10,
top: 'center',
orient: 'vertical',
textStyle: { fontSize: 12, color: '#fff' }
},
tooltip: {
textStyle: { color: '#000' },
padding: 10,
formatter: function (params) {
if (params.seriesName === 'mouseoutSeries') return ''
return `
<div style="font-weight:bold;">${params.seriesName}</div>
<div>数量:${chartOption.series[params.seriesIndex].pieData.value}</div>
`
}
},
xAxis3D: { min: -1.5, max: 1.5 },
yAxis3D: { min: -1.5, max: 1.5 },
zAxis3D: { min: -1.5, max: 1.5 },
grid3D: {
show: false,
boxHeight: 20,
viewControl: { alpha: 20, beta: 60, rotateSensitivity: 0, zoomSensitivity: 0, panSensitivity: 0, distance: 120 },
postEffect: {
enable: true,
bloom: { enable: true, bloomIntensity: 0.1, bloomThreshold: 0.1 },
SSAO: { enable: false }
},
light: {
main: { intensity: 1.5, shadow: true, shadowQuality: 'high' }, // 增强主光强度并开启阴影
ambient: { intensity: 0.8 },
ambientCubemap: { texture: null, exposure: 1, diffuseIntensity: 0.8 }
}
},
series
}
}
function initChartEquip () {
const chartDom = document.getElementById('equipChart')
if (!chartDom) return
if (myChart) myChart.dispose()
myChart = echarts.init(chartDom)
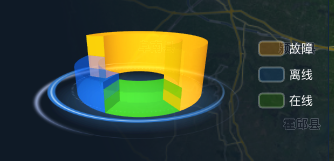
const pieData = [
{ name: '故障', value: props.fault, color: '#e69500' },
{ name: '离线', value: props.offline, color: '#045792' },
{ name: '在线', value: props.online, color: '#34900c' },
]
chartOption = getPie3D(pieData, 0.65)
myChart.setOption(chartOption)
bindChartEvents()
window.addEventListener('resize', () => {
if (myChart) myChart.resize()
})
}
function bindChartEvents () {
if (!myChart) return
myChart.off('click mouseover globalout')
myChart.on('click', function (params) {
if (params.seriesName === 'mouseoutSeries') return
const i = params.seriesIndex
const isSelected = !chartOption.series[i].pieStatus.selected
if (selectedIndex !== '' && selectedIndex !== i) {
const prev = chartOption.series[selectedIndex]
prev.parametricEquation = getParametricEquation(
prev.pieData.startRatio, prev.pieData.endRatio,
false, prev.pieStatus.hovered, prev.pieStatus.k, prev.pieData.value
)
prev.pieStatus.selected = false
// 恢复边框样式
prev.itemStyle = {
...prev.itemStyle,
borderColor: 'rgba(255,255,255,0.9)',
borderWidth: 3
}
}
const cur = chartOption.series[i]
cur.parametricEquation = getParametricEquation(
cur.pieData.startRatio, cur.pieData.endRatio,
isSelected, cur.pieStatus.hovered, cur.pieStatus.k, cur.pieData.value
)
// 选中时边框更突出
cur.itemStyle = {
...cur.itemStyle,
borderColor: 'rgba(255,255,255,1)',
borderWidth: isSelected ? 4 : 3
}
cur.pieStatus.selected = isSelected
selectedIndex = isSelected ? i : ''
myChart.setOption(chartOption)
})
myChart.on('mouseover', function (params) {
if (params.seriesName === 'mouseoutSeries') return
const i = params.seriesIndex
if (hoveredIndex === i) return
if (hoveredIndex !== '') {
const prev = chartOption.series[hoveredIndex]
prev.parametricEquation = getParametricEquation(
prev.pieData.startRatio, prev.pieData.endRatio,
prev.pieStatus.selected, false, prev.pieStatus.k, prev.pieData.value
)
prev.pieStatus.hovered = false
// 恢复边框样式
prev.itemStyle = {
...prev.itemStyle,
borderColor: 'rgba(255,255,255,0.9)',
borderWidth: prev.pieStatus.selected ? 4 : 3
}
}
const cur = chartOption.series[i]
cur.parametricEquation = getParametricEquation(
cur.pieData.startRatio, cur.pieData.endRatio,
cur.pieStatus.selected, true, cur.pieStatus.k, cur.pieData.value + 3
)
// 悬浮时边框更亮更宽
cur.itemStyle = {
...cur.itemStyle,
borderColor: 'rgba(255,255,255,1)',
borderWidth: cur.pieStatus.selected ? 5 : 4
}
cur.pieStatus.hovered = true
hoveredIndex = i
myChart.setOption(chartOption)
})
myChart.on('globalout', function () {
if (hoveredIndex === '') return
const cur = chartOption.series[hoveredIndex]
cur.parametricEquation = getParametricEquation(
cur.pieData.startRatio, cur.pieData.endRatio,
cur.pieStatus.selected, false, cur.pieStatus.k, cur.pieData.value
)
cur.pieStatus.hovered = false
// 恢复默认边框样式
cur.itemStyle = {
...cur.itemStyle,
borderColor: 'rgba(255,255,255,0.9)',
borderWidth: cur.pieStatus.selected ? 4 : 3
}
hoveredIndex = ''
myChart.setOption(chartOption)
})
}
</script>
<style lang="scss" scoped>
#equipChart {
width: 100%;
height: 500px;
background: transparent;
}
</style>父组件
<div class="h_l_p_chart" style="height: 70%;">
                    <div class="chartbkimg"></div>
                    <equipChart style="height:100%;margin-top: 15px;" :online="5" :offline="8" :fault="20" />
                </div>

.h_l_p_chart {
    position: relative;

    .chartbkimg {
        position: absolute;
        left: 20%;
        top: 4%;
        background: url("../../../../public//img/imgechat.png") no-repeat;
        width: 223px;
        height: 163px;
        background-size: 100% 100%;
    }
}