一、说明
1、安装
npm install cesium-plot-js
2、标绘类型
- 多边形
- 矩形
- 三角形
- 圆形
- 扇形
- 椭圆
- 半月面
- 自由面
- 自由线
- 曲线
- 细直箭头
- 曲线箭头
- 直箭头
- 进攻方向箭头
- 燕尾进攻方向箭头
- 分队战斗方向
- 燕尾分队战斗方向
- 突击方向
- 双箭头
3、支持的动画
4、目标拆分
- 交互标绘 :鼠标点选绘制、双击结束、点击图形进入编辑、支持显隐/生长动画/删除/导出
- 数据驱动上图 :给一段 JSON(id/type/points/style)即可批量上图,并能按 id 增量更新
二、交互标绘
1、交互标绘封装
import CesiumPlot from 'cesium-plot-js'

// cesium-plot-js 全部标绘类型映射(用于 UI 下拉与类型识别)
export const PLOT_TYPES = [
    { type: 'Polygon', kind: 'polygon', label: '多边形' },
    { type: 'Reactangle', kind: 'polygon', label: '矩形' },
    { type: 'Triangle', kind: 'polygon', label: '三角形' },
    { type: 'Circle', kind: 'polygon', label: '圆形' },
    { type: 'Sector', kind: 'polygon', label: '扇形' },
    { type: 'Ellipse', kind: 'polygon', label: '椭圆' },
    { type: 'Lune', kind: 'polygon', label: '半月面' },
    { type: 'FreehandPolygon', kind: 'polygon', label: '自由面' },

    { type: 'FreehandLine', kind: 'line', label: '自由线' },
    { type: 'Curve', kind: 'line', label: '曲线' },
    { type: 'StraightArrow', kind: 'line', label: '细直箭头' },
    { type: 'CurvedArrow', kind: 'line', label: '曲线箭头' },

    { type: 'FineArrow', kind: 'polygon', label: '直箭头' },
    { type: 'AttackArrow', kind: 'polygon', label: '进攻方向箭头' },
    { type: 'SwallowtailAttackArrow', kind: 'polygon', label: '燕尾进攻方向箭头' },
    { type: 'SquadCombat', kind: 'polygon', label: '分队战斗方向' },
    { type: 'SwallowtailSquadCombat', kind: 'polygon', label: '燕尾分队战斗方向' },
    { type: 'AssaultDirection', kind: 'polygon', label: '突击方向' },
    { type: 'DoubleArrow', kind: 'polygon', label: '双箭头' }
]

// 支持"生长动画"的类型集合(cesium-plot-js 能力限定)
export const PLOT_GROWTH_TYPES = new Set([
    'StraightArrow',
    'CurvedArrow',
    'FineArrow',
    'AttackArrow',
    'SwallowtailAttackArrow',
    'SquadCombat',
    'SwallowtailSquadCombat',
    'AssaultDirection',
    'DoubleArrow'
])

const PLOT_TYPE_META = PLOT_TYPES.reduce((acc, cur) => {
    acc[cur.type] = cur
    return acc
}, {})

// 从 window 取 Cesium(本项目采用 public/Cesium 静态注入方式)
function getCesium() {
    const Cesium = window.Cesium
    if (!Cesium) throw new Error('Cesium 未加载:请确认 public/index.html 已注入 Cesium.js')
    return Cesium
}

// Cartesian3 -> 经纬度(用于导出/持久化)
function cartesianToDegrees(Cesium, cartesian) {
    const carto = Cesium.Cartographic.fromCartesian(cartesian)
    return {
        lon: Cesium.Math.toDegrees(carto.longitude),
        lat: Cesium.Math.toDegrees(carto.latitude),
        height: carto.height || 0
    }
}

// 经纬度 -> Cartesian3(用于导入/重建图形)
function degreesToCartesian(Cesium, p) {
    const lon = Number(p.lon)
    const lat = Number(p.lat)
    const height = typeof p.height === 'number' ? p.height : Number(p.height || 0)
    return Cesium.Cartesian3.fromDegrees(lon, lat, Number.isFinite(height) ? height : 0)
}

// 统一样式配置的默认值(UI 简化配置 -> 内部规范化)
function normalizeStyleConfig(kind, config) {
    const base = {
        kind,
        fillColor: 'rgba(59, 178, 208, 0.45)',
        outlineColor: 'rgba(59, 178, 208, 1)',
        outlineWidth: 3,
        lineColor: 'rgba(59, 178, 208, 1)',
        lineWidth: 3
    }
    return Object.assign(base, config || {})
}

// 将 UI 的样式配置转换为 cesium-plot-js 需要的 style 结构(PolygonStyle/LineStyle)
function toCesiumPlotStyle(Cesium, styleConfig) {
    if (!styleConfig) return undefined
    if (styleConfig.kind === 'line') {
        return {
            material: Cesium.Color.fromCssColorString(styleConfig.lineColor),
            lineWidth: Number(styleConfig.lineWidth) || 2
        }
    }
    return {
        material: Cesium.Color.fromCssColorString(styleConfig.fillColor),
        outlineMaterial: Cesium.Color.fromCssColorString(styleConfig.outlineColor),
        outlineWidth: Number(styleConfig.outlineWidth) || 2
    }
}

// 交互标绘管理器:统一创建/事件/显隐/定位/导入导出
export class MilitaryPlotManager {
    constructor(viewer, options = {}) {
        this.viewer = viewer
        this.options = options || {}
        this.items = []
        this._seq = 0
    }

    // cesium-plot-js 的 hide/growth 等在编辑态(edit)下可能不生效,
    // 因此执行这些操作前,统一把几何切回静态态(static)
    ensureGeometryStatic(geometry) {
        if (!geometry) return
        if (typeof geometry.getState !== 'function' || typeof geometry.setState !== 'function') return
        const state = geometry.getState()
        if (state === 'edit') {
            if (typeof geometry.removeControlPoints === 'function') geometry.removeControlPoints()
            if (typeof geometry.disableDrag === 'function') geometry.disableDrag()
            geometry.setState('static')
        }
    }

    getCesium() {
        return getCesium()
    }

    // 获取类型元信息(kind=polygon/line、中文名等)
    getTypeMeta(type) {
        return PLOT_TYPE_META[type] || { type, kind: 'polygon', label: type }
    }

    // 为每个图形生成稳定 id(用于列表操作/导出)
    nextId() {
        this._seq += 1
        return `plot_${Date.now()}_${this._seq}`
    }

    // 合并默认样式与覆盖样式
    createStyleConfig(type, override) {
        const meta = this.getTypeMeta(type)
        const base = normalizeStyleConfig(meta.kind, this.options.defaultStyleConfig)
        return Object.assign(base, override || {})
    }

    // 创建交互绘制实例(交互事件由 cesium-plot-js 内部接管)
    createPlot(type, styleConfig) {
        const Cesium = this.getCesium()
        const meta = this.getTypeMeta(type)
        const style = toCesiumPlotStyle(Cesium, normalizeStyleConfig(meta.kind, styleConfig))
        const PlotClass = CesiumPlot[type]
        if (!PlotClass) throw new Error(`cesium-plot-js 不支持的类型:${type}`)
        return new PlotClass(Cesium, this.viewer, style)
    }

    // 通过关键点位数据重建图形(用于导入/回显)
    createPlotFromData(data) {
        const Cesium = this.getCesium()
        const meta = this.getTypeMeta(data.type)
        const style = toCesiumPlotStyle(Cesium, normalizeStyleConfig(meta.kind, data.styleConfig))
        const cartesianPoints = (data.points || []).map((p) => degreesToCartesian(Cesium, p))
        return CesiumPlot.createGeometryFromData(Cesium, this.viewer, {
            type: data.type,
            cartesianPoints,
            style
        })
    }

    // 开始一次交互绘制:返回 item(供 UI 列表管理)
    add(type, styleConfig) {
        const id = this.nextId()
        const meta = this.getTypeMeta(type)
        const normalizedStyleConfig = this.createStyleConfig(type, styleConfig)
        const geometry = this.createPlot(type, normalizedStyleConfig)

        const item = {
            id,
            type,
            kind: meta.kind,
            label: meta.label,
            styleConfig: normalizedStyleConfig,
            geometry,
            points: []
        }

        // 绘制结束:更新关键点位(用于导出/定位/后续编辑)
        geometry.on('drawEnd', (points) => {
            item.points = (points || []).slice()
            if (typeof this.options.onDrawEnd === 'function') this.options.onDrawEnd(item)
        })
        // 编辑结束:同步关键点位(确保导出/定位等拿到最新数据)
        geometry.on('editEnd', (points) => {
            item.points = (points || []).slice()
            if (typeof this.options.onEditEnd === 'function') this.options.onEditEnd(item)
        })

        this.items.push(item)
        if (typeof this.options.onAdd === 'function') this.options.onAdd(item)
        return item
    }

    // 通过数据直接添加图形(不走交互绘制,常用于导入/初始化)
    addFromData(data) {
        const id = data.id || this.nextId()
        const meta = this.getTypeMeta(data.type)
        const geometry = this.createPlotFromData(data)
        const item = {
            id,
            type: data.type,
            kind: meta.kind,
            label: meta.label,
            styleConfig: this.createStyleConfig(data.type, data.styleConfig),
            geometry,
            points: geometry.getPoints ? geometry.getPoints() : []
        }

        // 数据添加的图形同样支持编辑,编辑结束同步点位
        geometry.on('editEnd', (points) => {
            item.points = (points || []).slice()
            if (typeof this.options.onEditEnd === 'function') this.options.onEditEnd(item)
        })

        this.items.push(item)
        if (typeof this.options.onAdd === 'function') this.options.onAdd(item)
        return item
    }

    // 删除指定图形
    remove(id) {
        const idx = this.items.findIndex((it) => it.id === id)
        if (idx < 0) return
        const item = this.items[idx]
        if (item && item.geometry && typeof item.geometry.remove === 'function') {
            item.geometry.remove()
        }
        this.items.splice(idx, 1)
        if (typeof this.options.onRemove === 'function') this.options.onRemove(item)
    }

    // 清空全部图形
    clear() {
        const ids = this.items.map((it) => it.id)
        ids.forEach((id) => this.remove(id))
    }

    // 显示(支持淡入动画)
    show(id, opts) {
        const item = this.items.find((it) => it.id === id)
        if (!item) return
        this.ensureGeometryStatic(item.geometry)
        if (item.geometry && typeof item.geometry.show === 'function') item.geometry.show(opts)
    }

    // 隐藏(支持淡出动画)
    hide(id, opts) {
        const item = this.items.find((it) => it.id === id)
        if (!item) return
        this.ensureGeometryStatic(item.geometry)
        if (item.geometry && typeof item.geometry.hide === 'function') item.geometry.hide(opts)
    }

    // 生长动画(仅部分类型支持)
    startGrowthAnimation(id, opts) {
        const item = this.items.find((it) => it.id === id)
        if (!item) return
        if (!PLOT_GROWTH_TYPES.has(item.type)) return
        this.ensureGeometryStatic(item.geometry)
        if (item.geometry && typeof item.geometry.startGrowthAnimation === 'function') item.geometry.startGrowthAnimation(opts)
    }

    // 定位到图形:通过关键点位计算包围球,并固定 pitch=-90° 俯视居中显示
    flyTo(id, opts) {
        const Cesium = this.getCesium()
        const item = this.items.find((it) => it.id === id)
        if (!item || !item.geometry) return
        const options = Object.assign({ duration: 1.2 }, opts || {})
        this.ensureGeometryStatic(item.geometry)

        const points =
            item.geometry && typeof item.geometry.getPoints === 'function'
                ? item.geometry.getPoints()
                : Array.isArray(item.points)
                  ? item.points
                  : []
        const usablePoints = (points || []).filter((p) => Cesium.defined(p) && typeof p.x === 'number' && typeof p.y === 'number')
        if (usablePoints.length === 0) return

        const sphere = Cesium.BoundingSphere.fromPoints(usablePoints)
        if (!sphere || !Number.isFinite(sphere.radius)) return

        const range = Number.isFinite(options.range) ? options.range : Math.max(800, sphere.radius * 3.0)
        const pitch = -Cesium.Math.PI_OVER_TWO
        const heading = Number.isFinite(options.heading) ? options.heading : 0
        const offset = new Cesium.HeadingPitchRange(heading, pitch, range)
        const cameraOptions = Object.assign({}, options, { offset })
        return this.viewer.camera.flyToBoundingSphere(sphere, cameraOptions)
    }

    // 导出:返回可持久化 JSON(经纬度形式的关键点位)
    exportData() {
        const Cesium = this.getCesium()
        return this.items.map((it) => {
            const points = (it.geometry && typeof it.geometry.getPoints === 'function' ? it.geometry.getPoints() : it.points || []).map(
                (p) => cartesianToDegrees(Cesium, p)
            )
            return {
                id: it.id,
                type: it.type,
                styleConfig: it.styleConfig,
                points
            }
        })
    }

    // 导入:根据导出的 JSON 重建图形(可选先清空)
    importData(list, options = {}) {
        const arr = Array.isArray(list) ? list : []
        if (options.clear) this.clear()
        return arr.map((data) => this.addFromData(data))
    }

    // 释放资源
    destroy() {
        this.clear()
        this.viewer = null
    }
}
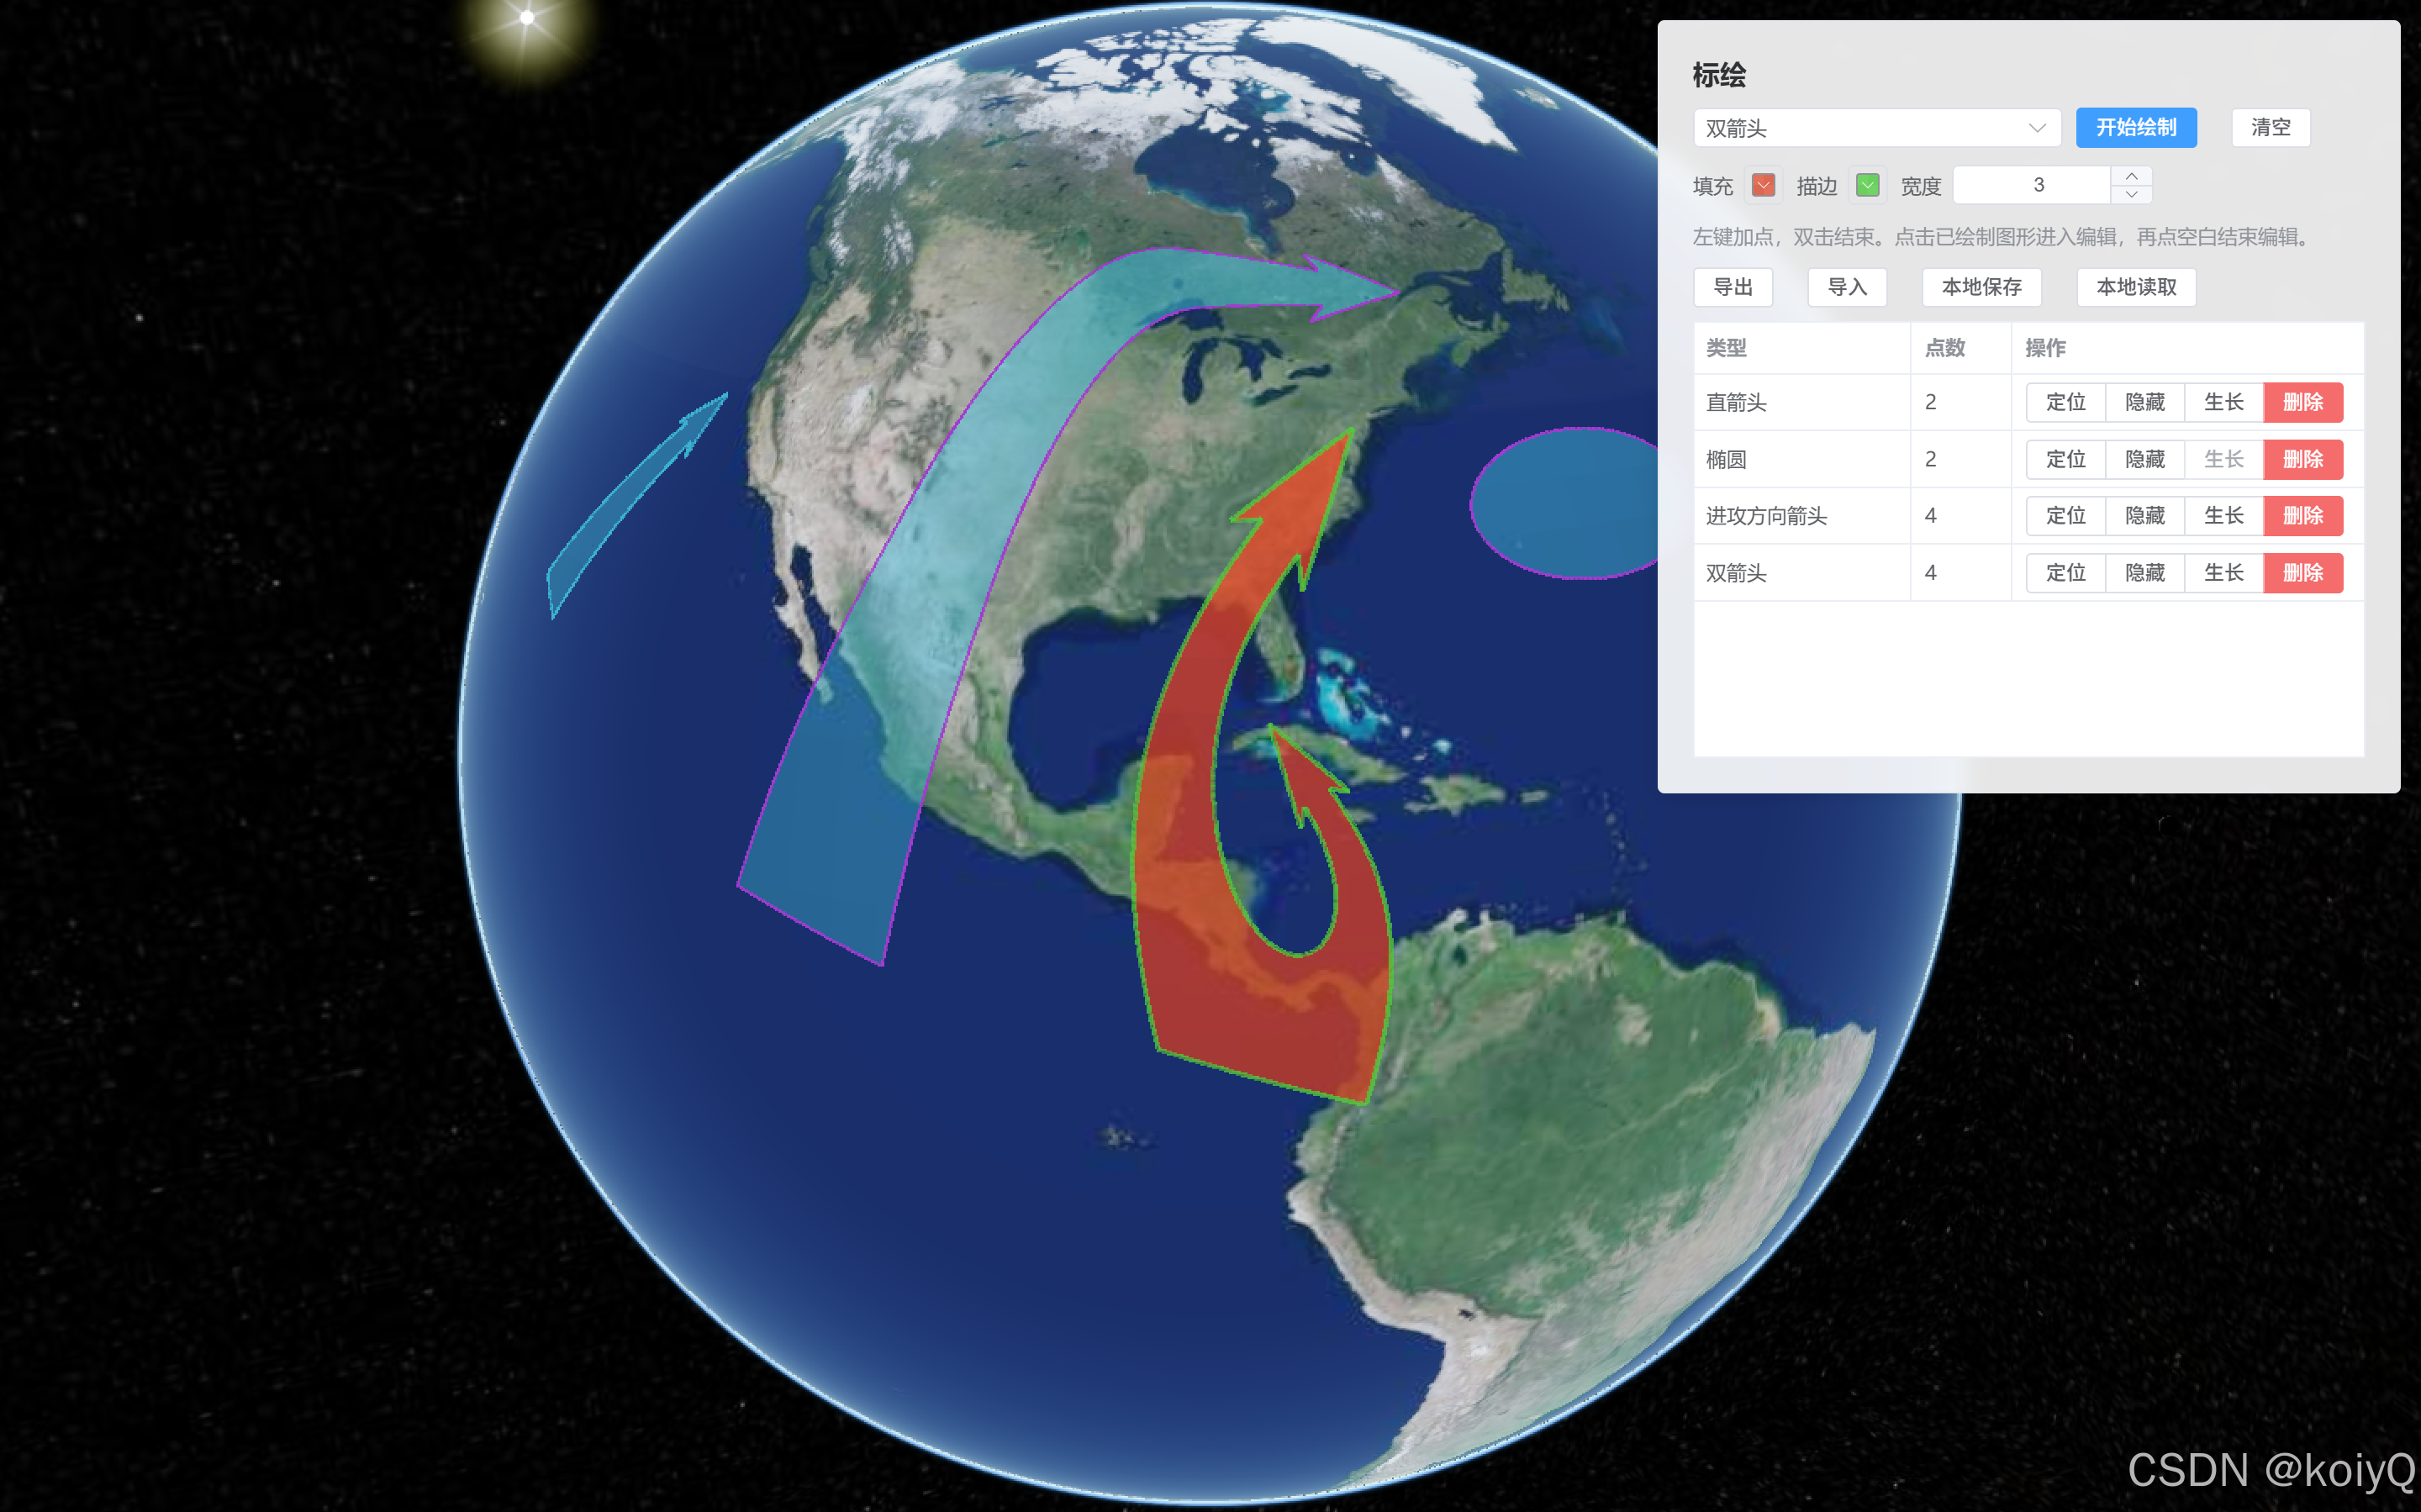
2、交互标绘 demo
<template>
    <div class="military-plot">
        <el-card class="military-plot-card" shadow="always">
            <div class="military-plot-title">标绘</div>

            <div class="military-plot-row">
                <el-select v-model="selectedType" size="small" class="military-plot-type" :disabled="!viewer" filterable>
                    <el-option v-for="opt in typeOptions" :key="opt.type" :label="opt.label" :value="opt.type" />
                </el-select>
                <el-button type="primary" size="small" :disabled="!viewer" @click="onStartDraw">开始绘制</el-button>
                <el-button size="small" :disabled="!viewer" @click="onClear">清空</el-button>
            </div>

            <div class="military-plot-row">
                <template v-if="selectedKind === 'polygon'">
                    <div class="military-plot-style-item">
                        <span class="military-plot-style-label">填充</span>
                        <el-color-picker v-model="style.fillColor" size="small" :disabled="!viewer" show-alpha />
                    </div>
                    <div class="military-plot-style-item">
                        <span class="military-plot-style-label">描边</span>
                        <el-color-picker v-model="style.outlineColor" size="small" :disabled="!viewer" show-alpha />
                    </div>
                    <div class="military-plot-style-item">
                        <span class="military-plot-style-label">宽度</span>
                        <el-input-number
                            v-model="style.outlineWidth"
                            size="small"
                            :min="1"
                            :max="20"
                            controls-position="right"
                            :disabled="!viewer"
                        />
                    </div>
                </template>
                <template v-else>
                    <div class="military-plot-style-item">
                        <span class="military-plot-style-label">颜色</span>
                        <el-color-picker v-model="style.lineColor" size="small" :disabled="!viewer" show-alpha />
                    </div>
                    <div class="military-plot-style-item">
                        <span class="military-plot-style-label">宽度</span>
                        <el-input-number
                            v-model="style.lineWidth"
                            size="small"
                            :min="1"
                            :max="20"
                            controls-position="right"
                            :disabled="!viewer"
                        />
                    </div>
                </template>
            </div>

            <div class="military-plot-hint">
                左键加点,双击结束。点击已绘制图形进入编辑,再点空白结束编辑。
            </div>

            <div class="military-plot-row military-plot-actions">
                <el-button size="small" :disabled="!viewer" @click="onExportOpen">导出</el-button>
                <el-button size="small" :disabled="!viewer" @click="onImportOpen">导入</el-button>
                <el-button size="small" :disabled="!viewer" @click="onSaveLocal">本地保存</el-button>
                <el-button size="small" :disabled="!viewer" @click="onLoadLocal">本地读取</el-button>
            </div>

            <el-table
                v-if="items.length > 0"
                :data="items"
                size="small"
                border
                height="260"
                class="military-plot-table"
                :row-key="(row) => row.id"
            >
                <el-table-column prop="label" label="类型" width="130" />
                <el-table-column label="点数" width="60">
                    <template #default="{ row }">
                        {{ row.pointsCount }}
                    </template>
                </el-table-column>
                <el-table-column label="操作" min-width="180">
                    <template #default="{ row }">
                        <el-button-group>
                            <el-button size="small" :disabled="!viewer" @click="onFlyTo(row)">定位</el-button>
                            <el-button size="small" :disabled="!viewer" @click="onToggleVisible(row)">
                                {{ row.visible ? '隐藏' : '显示' }}
                            </el-button>
                            <el-button size="small" :disabled="!viewer || !row.canGrowth" @click="onGrowth(row)">生长</el-button>
                            <el-button size="small" type="danger" :disabled="!viewer" @click="onRemove(row)">删除</el-button>
                        </el-button-group>
                    </template>
                </el-table-column>
            </el-table>

            <div v-else class="military-plot-empty">暂无标绘,选择类型后点击"开始绘制"。</div>

            <el-dialog v-model="exportDialogVisible" title="导出标绘数据" width="720px">
                <el-input v-model="exportText" type="textarea" :rows="14" readonly />
                <template #footer>
                    <el-button @click="exportDialogVisible = false">关闭</el-button>
                </template>
            </el-dialog>

            <el-dialog v-model="importDialogVisible" title="导入标绘数据" width="720px">
                <el-input v-model="importText" type="textarea" :rows="14" placeholder="粘贴导出的 JSON 数组" />
                <template #footer>
                    <el-button @click="importDialogVisible = false">取消</el-button>
                    <el-button type="primary" :disabled="!viewer" @click="onImportConfirm">导入</el-button>
                </template>
            </el-dialog>
        </el-card>
    </div>
</template>

<script>
import { ElMessage } from 'element-plus'
import { MilitaryPlotManager, PLOT_GROWTH_TYPES, PLOT_TYPES } from '@/utils/map/militaryPlot'

// localStorage key:用于保存/读取导出的标绘数据
const STORAGE_KEY = 'cesium_demo_military_plot'

export default {
    name: 'MilitaryPlot',
    props: {
        viewer: {
            type: Object,
            default: null
        }
    },
    data() {
        return {
            manager: null,
            typeOptions: PLOT_TYPES,
            selectedType: 'FineArrow',
            exportDialogVisible: false,
            importDialogVisible: false,
            exportText: '',
            importText: '',
            visibility: {},
            items: [],
            style: {
                fillColor: 'rgba(59, 178, 208, 0.45)',
                outlineColor: 'rgba(59, 178, 208, 1)',
                outlineWidth: 3,
                lineColor: 'rgba(59, 178, 208, 1)',
                lineWidth: 3
            }
        }
    },
    computed: {
        selectedKind() {
            const meta = (this.typeOptions || []).find((t) => t.type === this.selectedType)
            return meta && meta.kind ? meta.kind : 'polygon'
        }
    },
    watch: {
        viewer: {
            immediate: true,
            handler(next) {
                if (!next) return
                // viewer 就绪后再初始化标绘管理器
                if (!this.manager) this.initManager()
                this.syncItems()
            }
        }
    },
    methods: {
        // 创建标绘管理器,并通过回调同步 UI 列表
        initManager() {
            this.manager = new MilitaryPlotManager(this.viewer, {
                defaultStyleConfig: {},
                onAdd: () => this.syncItems(),
                onRemove: () => this.syncItems(),
                onDrawEnd: () => this.syncItems(),
                onEditEnd: () => this.syncItems()
            })
        },
        // 从 manager.items 生成 UI 列表数据(点数/是否可生长/显隐状态)
        syncItems() {
            if (!this.manager) {
                this.items = []
                return
            }
            const next = (this.manager.items || []).map((it) => {
                const pointsCount = it.geometry && typeof it.geometry.getPoints === 'function' ? it.geometry.getPoints().length : (it.points || []).length
                const visible = this.visibility[it.id] !== false
                return {
                    id: it.id,
                    type: it.type,
                    label: it.label,
                    pointsCount,
                    canGrowth: PLOT_GROWTH_TYPES.has(it.type),
                    visible
                }
            })
            this.items = next
        },
        // 获取当前 UI 的样式配置(会在创建图形时转换为 cesium-plot-js style)
        currentStyleConfig() {
            if (this.selectedKind === 'line') {
                return {
                    kind: 'line',
                    lineColor: this.style.lineColor,
                    lineWidth: this.style.lineWidth
                }
            }
            return {
                kind: 'polygon',
                fillColor: this.style.fillColor,
                outlineColor: this.style.outlineColor,
                outlineWidth: this.style.outlineWidth
            }
        },
        // 开始一次交互绘制:左键加点,双击结束(交互由 cesium-plot-js 接管)
        onStartDraw() {
            if (!this.viewer) return
            if (!this.manager) this.initManager()
            this.manager.add(this.selectedType, this.currentStyleConfig())
            this.syncItems()
            ElMessage.success('已进入绘制状态:左键加点,双击结束')
        },
        // 清空全部标绘
        onClear() {
            if (!this.manager) return
            this.manager.clear()
            this.visibility = {}
            this.syncItems()
            ElMessage.success('已清空标绘')
        },
        // 删除单个标绘
        onRemove(row) {
            if (!this.manager) return
            this.manager.remove(row.id)
            delete this.visibility[row.id]
            this.syncItems()
        },
        // 定位到标绘中心(内部固定 pitch=-90° 俯视)
        onFlyTo(row) {
            if (!this.manager) return
            this.manager.flyTo(row.id)
        },
        // 显示/隐藏(支持淡入淡出动画)
        onToggleVisible(row) {
            if (!this.manager) return
            const currentlyVisible = this.visibility[row.id] !== false
            if (currentlyVisible) {
                this.manager.hide(row.id, { duration: 350 })
                this.visibility[row.id] = false
            } else {
                this.manager.show(row.id, { duration: 350 })
                this.visibility[row.id] = true
            }
            this.syncItems()
        },
        // 生长动画(仅 PLOT_GROWTH_TYPES 中的类型支持)
        onGrowth(row) {
            if (!this.manager) return
            this.manager.startGrowthAnimation(row.id, { duration: 1600 })
        },
        // 导出:把当前全部标绘数据转为 JSON(经纬度点位)
        onExportOpen() {
            if (!this.manager) return
            this.exportText = JSON.stringify(this.manager.exportData(), null, 2)
            this.exportDialogVisible = true
        },
        // 打开导入弹窗
        onImportOpen() {
            this.importText = ''
            this.importDialogVisible = true
        },
        // 导入:清空后重建(保持与导入数据一致)
        onImportConfirm() {
            try {
                const list = JSON.parse(String(this.importText || '[]'))
                if (!this.manager) this.initManager()
                this.manager.importData(list, { clear: true })
                this.visibility = {}
                this.syncItems()
                this.importDialogVisible = false
                ElMessage.success('导入成功')
            } catch (e) {
                ElMessage.error(String(e && e.message ? e.message : e))
            }
        },
        // 保存到本地(localStorage)
        onSaveLocal() {
            if (!this.manager) return
            const data = this.manager.exportData()
            localStorage.setItem(STORAGE_KEY, JSON.stringify(data))
            ElMessage.success('已保存到本地')
        },
        // 从本地读取并重建
        onLoadLocal() {
            try {
                const text = localStorage.getItem(STORAGE_KEY)
                if (!text) {
                    ElMessage.warning('本地没有已保存的数据')
                    return
                }
                const list = JSON.parse(text)
                if (!this.manager) this.initManager()
                this.manager.importData(list, { clear: true })
                this.visibility = {}
                this.syncItems()
                ElMessage.success('已从本地读取')
            } catch (e) {
                ElMessage.error(String(e && e.message ? e.message : e))
            }
        }
    },
    beforeUnmount() {
        if (this.manager) {
            // 组件卸载时释放实体/事件
            this.manager.destroy()
            this.manager = null
        }
    }
}
</script>

<style lang="scss" scoped>
.military-plot {
    position: absolute;
    top: 12px;
    right: 12px;
    z-index: 10;
}

.military-plot-card {
    width: 460px;
    background: rgba(255, 255, 255, 0.9);
    backdrop-filter: blur(6px);
}

.military-plot-title {
    font-weight: 600;
    margin-bottom: 10px;
}

.military-plot-row {
    display: flex;
    gap: 8px;
    align-items: center;
    margin-bottom: 10px;
    flex-wrap: wrap;
}

.military-plot-type {
    width: 220px;
}

.military-plot-style-item {
    display: inline-flex;
    gap: 6px;
    align-items: center;
}

.military-plot-style-label {
    font-size: 12px;
    color: #606266;
}

.military-plot-hint {
    font-size: 12px;
    color: #909399;
    line-height: 1.4;
    margin-bottom: 10px;
}

.military-plot-actions {
    margin-bottom: 8px;
}

.military-plot-table {
    width: 100%;
}

.military-plot-empty {
    font-size: 12px;
    color: #909399;
    padding: 10px 0;
}
</style>
3、效果图
三、数据驱动
1、数据驱动封装
import CesiumPlot from 'cesium-plot-js'
import { PLOT_GROWTH_TYPES, PLOT_TYPES } from './militaryPlot'

// 数据驱动上图:根据 JSON 数据直接构建 cesium-plot-js 图形(不走交互绘制)
const PLOT_TYPE_META = PLOT_TYPES.reduce((acc, cur) => {
    acc[cur.type] = cur
    return acc
}, {})

// 从 window 取 Cesium(本项目采用 public/Cesium 静态注入方式)
function getCesium() {
    const Cesium = window.Cesium
    if (!Cesium) throw new Error('Cesium 未加载:请确认 public/index.html 已注入 Cesium.js')
    return Cesium
}

// 统一样式配置默认值(与交互标绘保持一致)
function normalizeStyleConfig(kind, config) {
    const base = {
        kind,
        fillColor: 'rgba(59, 178, 208, 0.45)',
        outlineColor: 'rgba(59, 178, 208, 1)',
        outlineWidth: 3,
        lineColor: 'rgba(59, 178, 208, 1)',
        lineWidth: 3
    }
    return Object.assign(base, config || {})
}

// 将 UI 的样式配置转换为 cesium-plot-js 需要的 style 结构(PolygonStyle/LineStyle)
function toCesiumPlotStyle(Cesium, styleConfig) {
    if (!styleConfig) return undefined
    if (styleConfig.kind === 'line') {
        return {
            material: Cesium.Color.fromCssColorString(styleConfig.lineColor),
            lineWidth: Number(styleConfig.lineWidth) || 2
        }
    }
    return {
        material: Cesium.Color.fromCssColorString(styleConfig.fillColor),
        outlineMaterial: Cesium.Color.fromCssColorString(styleConfig.outlineColor),
        outlineWidth: Number(styleConfig.outlineWidth) || 2
    }
}

// 经纬度 -> Cartesian3(用于 createGeometryFromData)
function degreesToCartesian(Cesium, p) {
    const lon = Number(p.lon)
    const lat = Number(p.lat)
    const height = typeof p.height === 'number' ? p.height : Number(p.height || 0)
    return Cesium.Cartesian3.fromDegrees(lon, lat, Number.isFinite(height) ? height : 0)
}

// Cartesian3 -> 经纬度(用于导出)
function cartesianToDegrees(Cesium, cartesian) {
    const carto = Cesium.Cartographic.fromCartesian(cartesian)
    return {
        lon: Cesium.Math.toDegrees(carto.longitude),
        lat: Cesium.Math.toDegrees(carto.latitude),
        height: carto.height || 0
    }
}

// 简单稳定序列化:用于生成 hash(只用于 demo 级别 diff)
function stableStringify(obj) {
    return JSON.stringify(obj, Object.keys(obj || {}).sort())
}

// 生成数据 hash:同 id 的数据不变则不重建,减少闪烁与性能开销
function hashPlotData(data) {
    const points = Array.isArray(data.points) ? data.points : []
    const styleConfig = data.styleConfig || {}
    return `${data.type || ''}|${stableStringify(styleConfig)}|${stableStringify(points)}`
}

// 生成全类型示例数据:用于 demo 一键上图
export function createAllTypesSampleData(center = { lon: 116.403963, lat: 39.915119 }, options = {}) {
    const spacing = typeof options.spacing === 'number' ? options.spacing : 0.08
    const base = {
        fillColor: 'rgba(59, 178, 208, 0.35)',
        outlineColor: 'rgba(59, 178, 208, 0.95)',
        outlineWidth: 3,
        lineColor: 'rgba(59, 178, 208, 0.95)',
        lineWidth: 3
    }

    return PLOT_TYPES.map((meta, idx) => {
        const col = idx % 5
        const row = Math.floor(idx / 5)
        const lon0 = center.lon + col * spacing
        const lat0 = center.lat - row * spacing
        return createSampleDataForType(meta.type, { lon: lon0, lat: lat0 }, Object.assign({}, base, options.styleConfig || {}))
    })
}

// 生成单类型示例数据:用于快速测试单个图形的数据格式
export function createSampleDataForType(type, center = { lon: 116.403963, lat: 39.915119 }, styleConfig = {}) {
    const meta = PLOT_TYPE_META[type] || { type, kind: 'polygon' }
    const kind = meta.kind || 'polygon'
    const d = 0.02

    const lon = center.lon
    const lat = center.lat

    const pts2 = [
        { lon: lon - d, lat: lat - d },
        { lon: lon + d, lat: lat + d }
    ]
    const pts3 = [
        { lon: lon - d, lat: lat - d },
        { lon: lon + d, lat: lat - d },
        { lon: lon + d, lat: lat + d }
    ]
    const pts4 = [
        { lon: lon - d, lat: lat - d },
        { lon: lon + d, lat: lat - d },
        { lon: lon + d, lat: lat + d },
        { lon: lon - d, lat: lat + d }
    ]
    const pts5 = [
        { lon: lon - d, lat: lat - d },
        { lon: lon - d * 0.2, lat: lat + d },
        { lon: lon + d * 0.6, lat: lat + d * 0.6 },
        { lon: lon + d, lat: lat - d * 0.2 },
        { lon: lon + d * 0.2, lat: lat - d }
    ]

    const pointsByType = {
        Polygon: pts4,
        Reactangle: pts2,
        Triangle: [
            { lon: lon - d, lat: lat - d },
            { lon: lon + d, lat: lat - d },
            { lon: lon, lat: lat + d }
        ],
        Circle: pts2,
        Sector: [
            { lon: lon, lat: lat },
            { lon: lon + d, lat: lat },
            { lon: lon, lat: lat + d }
        ],
        Ellipse: pts2,
        Lune: pts3,
        StraightArrow: pts2,
        CurvedArrow: pts3,
        FineArrow: pts2,
        AttackArrow: pts3,
        SwallowtailAttackArrow: pts3,
        SquadCombat: pts3,
        SwallowtailSquadCombat: pts3,
        AssaultDirection: pts2,
        DoubleArrow: [
            { lon: lon - d, lat: lat - d },
            { lon: lon, lat: lat + d },
            { lon: lon + d, lat: lat - d },
            { lon: lon, lat: lat - d * 0.2 }
        ],
        FreehandLine: pts5,
        FreehandPolygon: pts5,
        Curve: pts4
    }

    const points = pointsByType[type] || (kind === 'line' ? pts4 : pts4)

    return {
        id: `plot_${type}_${Date.now()}_${Math.floor(Math.random() * 100000)}`,
        type,
        styleConfig: Object.assign({ kind }, styleConfig || {}),
        points
    }
}

// 数据驱动图层:维护一组"数据 -> 图形实例"的映射,并支持 setData 增量更新
export class MilitaryPlotByDataLayer {
    constructor(viewer, options = {}) {
        this.viewer = viewer
        this.options = options || {}
        this.items = new Map()
    }

    getCesium() {
        return getCesium()
    }

    ensureGeometryStatic(geometry) {
        if (!geometry) return
        if (typeof geometry.getState !== 'function' || typeof geometry.setState !== 'function') return
        const state = geometry.getState()
        if (state === 'edit') {
            if (typeof geometry.removeControlPoints === 'function') geometry.removeControlPoints()
            if (typeof geometry.disableDrag === 'function') geometry.disableDrag()
            geometry.setState('static')
        }
    }

    getTypeMeta(type) {
        return PLOT_TYPE_META[type] || { type, kind: 'polygon', label: type }
    }

    // 根据一条数据创建图形实例(关键点位为 Cartesian3)
    _createGeometryFromData(data) {
        const Cesium = this.getCesium()
        const meta = this.getTypeMeta(data.type)
        const styleConfig = normalizeStyleConfig(meta.kind, data.styleConfig)
        const style = toCesiumPlotStyle(Cesium, styleConfig)
        const cartesianPoints = (data.points || []).map((p) => degreesToCartesian(Cesium, p))
        return CesiumPlot.createGeometryFromData(Cesium, this.viewer, {
            type: data.type,
            cartesianPoints,
            style
        })
    }

    // 设置全量数据(内部按 id 做增量更新,默认清理缺失项)
    // list: [{ id, type, styleConfig, points:[{lon,lat,height?}, ...] }]
    setData(list, options = {}) {
        const arr = Array.isArray(list) ? list : []
        const clearMissing = options.clearMissing !== false

        const nextIds = new Set()
        const errors = []

        arr.forEach((raw) => {
            if (!raw || !raw.id || !raw.type) return
            nextIds.add(raw.id)

            // hash 相同则无需重建
            const prev = this.items.get(raw.id)
            const nextHash = hashPlotData(raw)
            if (prev && prev.hash === nextHash) return

            if (prev && prev.geometry && typeof prev.geometry.remove === 'function') {
                prev.geometry.remove()
            }

            try {
                const geometry = this._createGeometryFromData(raw)
                const meta = this.getTypeMeta(raw.type)
                const item = {
                    id: raw.id,
                    type: raw.type,
                    label: meta.label,
                    kind: meta.kind,
                    styleConfig: normalizeStyleConfig(meta.kind, raw.styleConfig),
                    geometry,
                    hash: nextHash,
                    visible: true
                }
                this.items.set(raw.id, item)
            } catch (e) {
                errors.push({ id: raw.id, type: raw.type, message: String(e && e.message ? e.message : e) })
            }
        })

        // 默认删除不在新数据中的图形(保持与数据一致)
        if (clearMissing) {
            Array.from(this.items.keys()).forEach((id) => {
                if (nextIds.has(id)) return
                this.remove(id)
            })
        }

        if (typeof this.options.onChange === 'function') this.options.onChange(this.getList(), errors)
        return { list: this.getList(), errors }
    }

    // 用于 UI 展示的简表
    getList() {
        return Array.from(this.items.values()).map((it) => {
            const pointsCount = it.geometry && typeof it.geometry.getPoints === 'function' ? it.geometry.getPoints().length : 0
            return {
                id: it.id,
                type: it.type,
                label: it.label,
                kind: it.kind,
                pointsCount,
                canGrowth: PLOT_GROWTH_TYPES.has(it.type),
                visible: it.visible !== false
            }
        })
    }

    // 删除指定 id
    remove(id) {
        const item = this.items.get(id)
        if (!item) return
        if (item.geometry && typeof item.geometry.remove === 'function') item.geometry.remove()
        this.items.delete(id)
        if (typeof this.options.onChange === 'function') this.options.onChange(this.getList(), [])
    }

    // 清空全部
    clear() {
        Array.from(this.items.keys()).forEach((id) => this.remove(id))
    }

    // 显示(支持淡入动画)
    show(id, opts) {
        const item = this.items.get(id)
        if (!item) return
        item.visible = true
        if (item.geometry && typeof item.geometry.show === 'function') item.geometry.show(opts)
        if (typeof this.options.onChange === 'function') this.options.onChange(this.getList(), [])
    }

    // 隐藏(支持淡出动画)
    hide(id, opts) {
        const item = this.items.get(id)
        if (!item) return
        item.visible = false
        if (item.geometry && typeof item.geometry.hide === 'function') item.geometry.hide(opts)
        if (typeof this.options.onChange === 'function') this.options.onChange(this.getList(), [])
    }

    // 生长动画(仅部分类型支持)
    startGrowthAnimation(id, opts) {
        const item = this.items.get(id)
        if (!item) return
        if (!PLOT_GROWTH_TYPES.has(item.type)) return
        this.ensureGeometryStatic(item.geometry)
        if (item.geometry && typeof item.geometry.startGrowthAnimation === 'function') item.geometry.startGrowthAnimation(opts)
    }

    // 定位:与交互标绘一致,使用点位包围球定位并固定 pitch=-90°
    flyTo(id, opts) {
        const Cesium = this.getCesium()
        const item = this.items.get(id)
        if (!item) return
        const options = Object.assign({ duration: 1.2 }, opts || {})
        this.ensureGeometryStatic(item.geometry)

        const points = item.geometry && typeof item.geometry.getPoints === 'function' ? item.geometry.getPoints() : []
        const usablePoints = (points || []).filter((p) => Cesium.defined(p) && typeof p.x === 'number' && typeof p.y === 'number')
        if (usablePoints.length === 0) return

        const sphere = Cesium.BoundingSphere.fromPoints(usablePoints)
        if (!sphere || !Number.isFinite(sphere.radius)) return

        const range = Number.isFinite(options.range) ? options.range : Math.max(800, sphere.radius * 3.0)
        const heading = Number.isFinite(options.heading) ? options.heading : 0
        const offset = new Cesium.HeadingPitchRange(heading, -Cesium.Math.PI_OVER_TWO, range)
        const cameraOptions = Object.assign({}, options, { offset })
        return this.viewer.camera.flyToBoundingSphere(sphere, cameraOptions)
    }

    // 导出:返回可持久化 JSON(经纬度形式)
    exportData() {
        const Cesium = this.getCesium()
        return Array.from(this.items.values()).map((it) => {
            const points = it.geometry && typeof it.geometry.getPoints === 'function' ? it.geometry.getPoints() : []
            return {
                id: it.id,
                type: it.type,
                styleConfig: it.styleConfig,
                points: (points || []).map((p) => cartesianToDegrees(Cesium, p))
            }
        })
    }

    // 释放资源
    destroy() {
        this.clear()
        this.viewer = null
    }
}
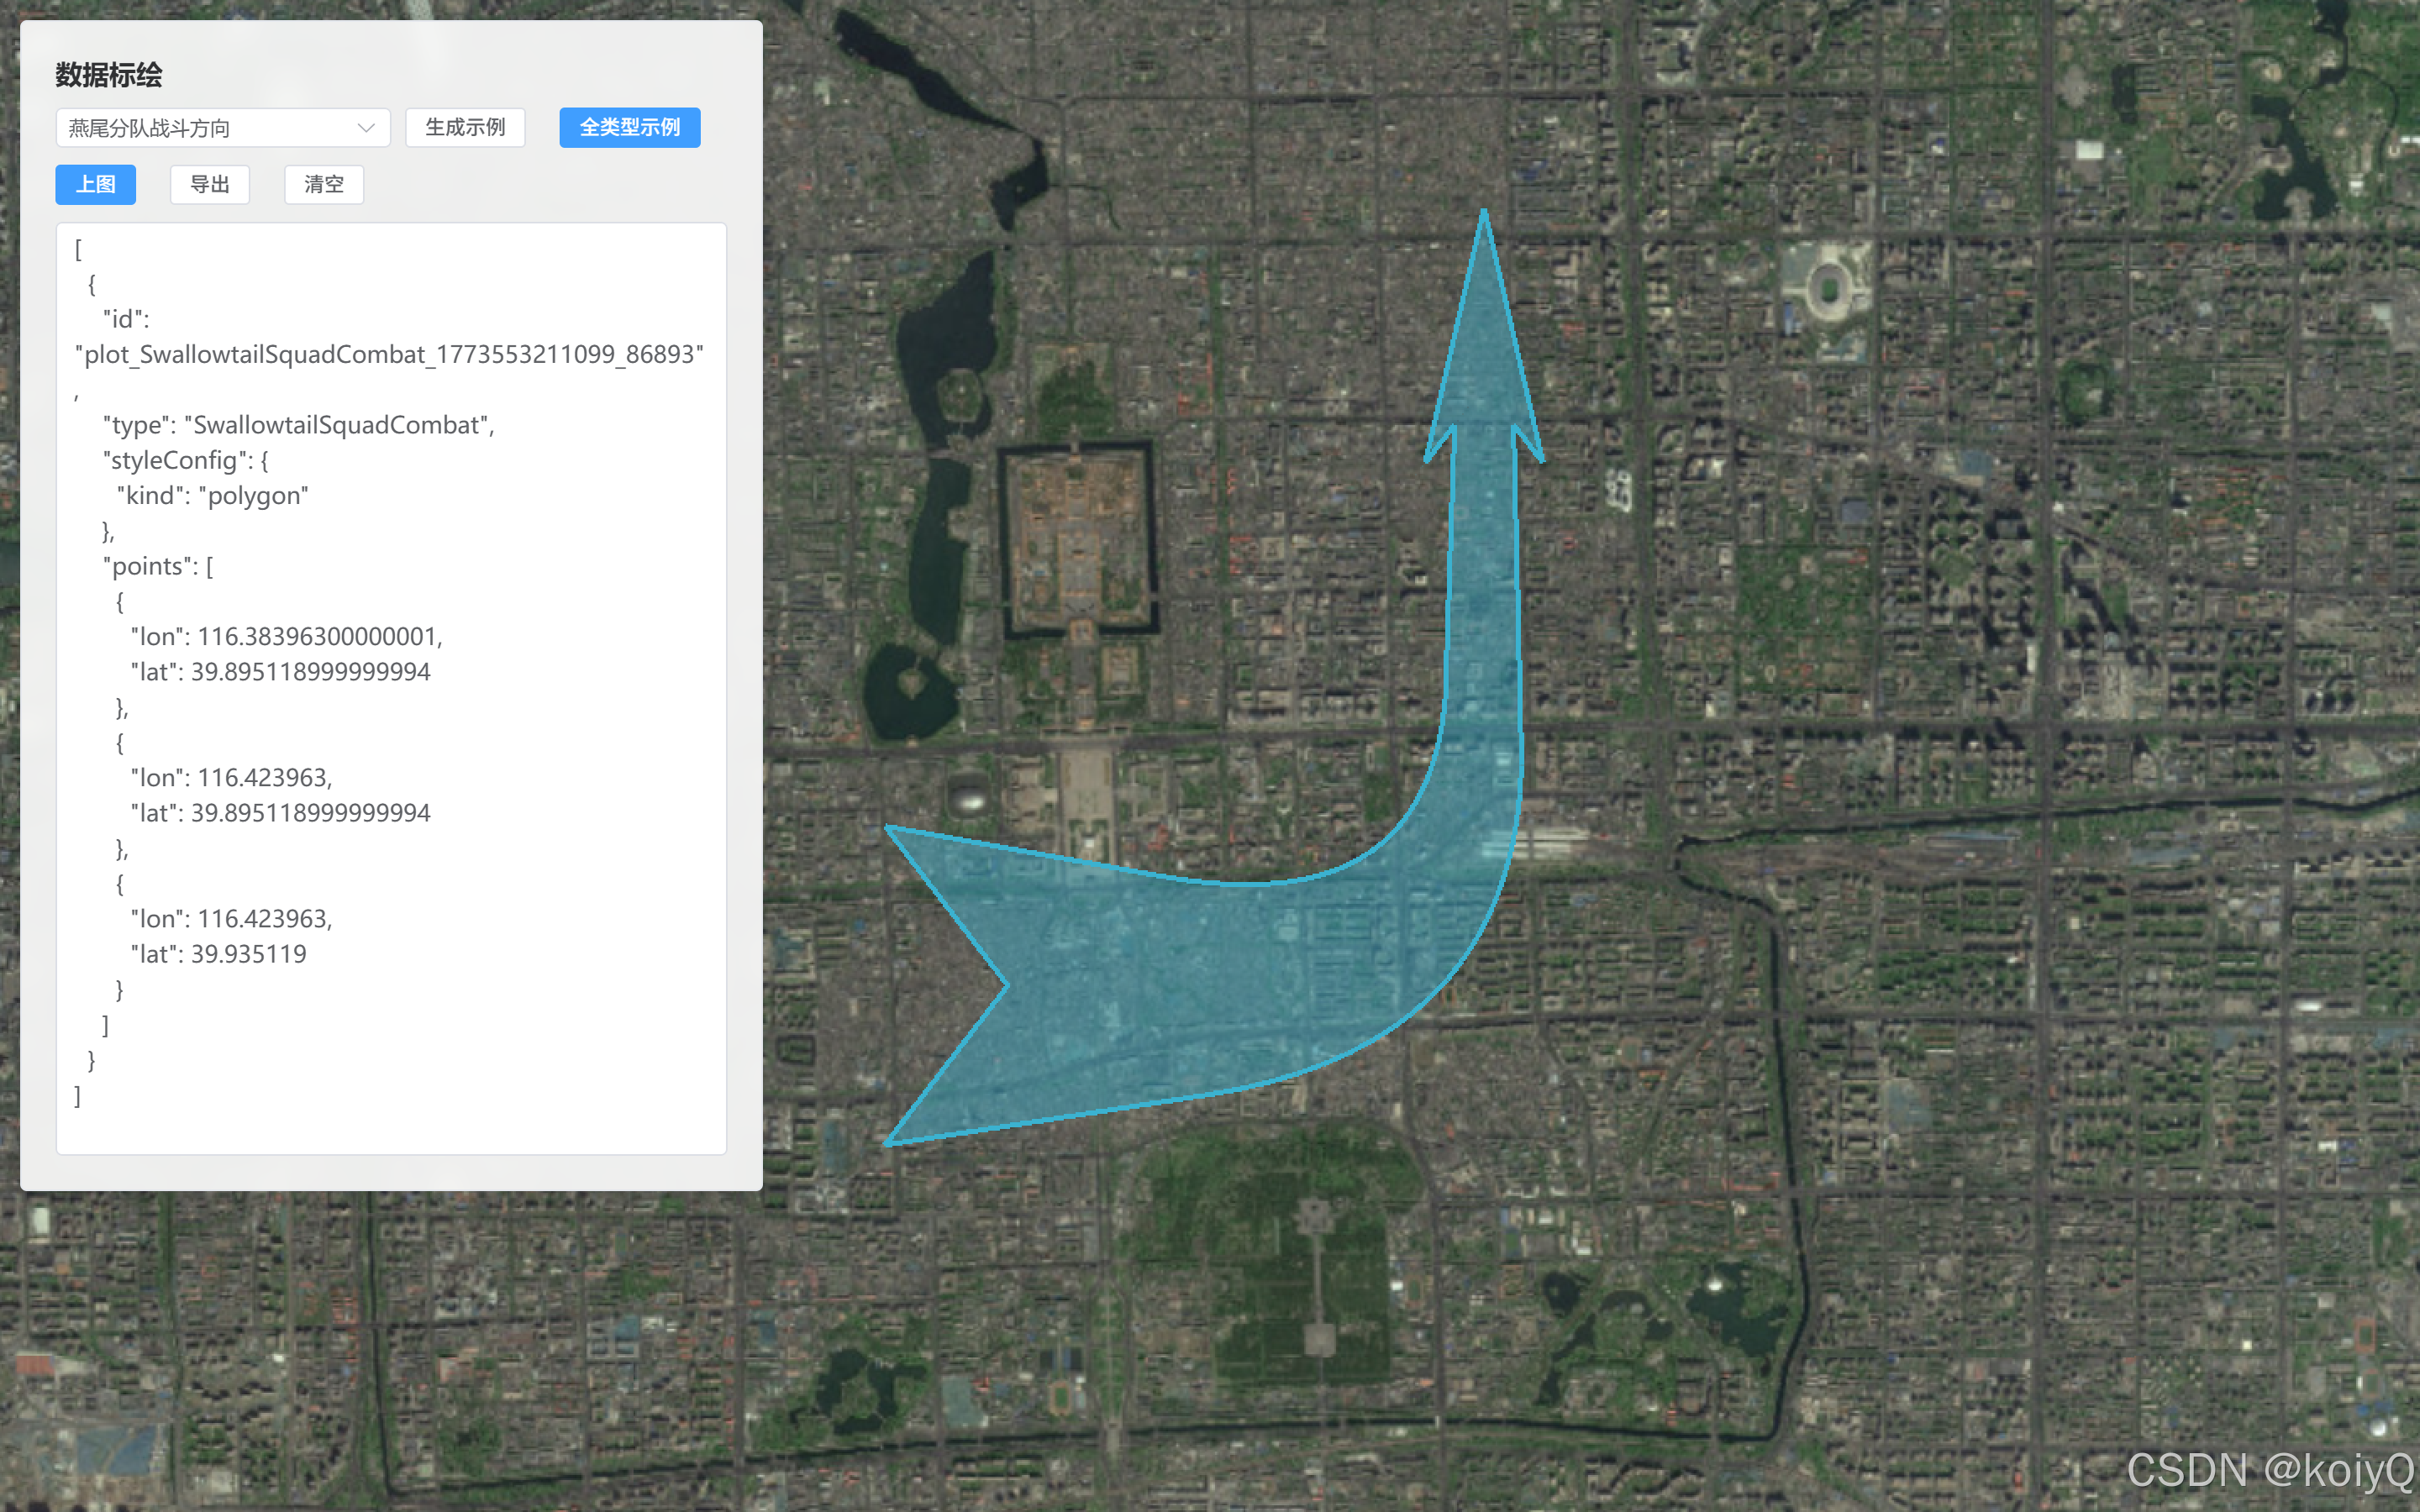
2、数据驱动 demo
<template>
    <div class="military-plot-by-data">
        <el-card class="military-plot-by-data-card" shadow="always">
            <div class="military-plot-by-data-title">数据标绘</div>

            <div class="military-plot-by-data-row">
                <el-select v-model="selectedType" size="small" class="military-plot-by-data-type" :disabled="!viewer"
                    filterable>
                    <el-option v-for="opt in typeOptions" :key="opt.type" :label="opt.label" :value="opt.type" />
                </el-select>
                <el-button size="small" :disabled="!viewer" @click="onFillOneSample">生成示例</el-button>
                <el-button size="small" type="primary" :disabled="!viewer" @click="onFillAllSamples">全类型示例</el-button>
            </div>

            <div class="military-plot-by-data-row">
                <el-button type="primary" size="small" :disabled="!viewer" @click="onApply">上图</el-button>
                <el-button size="small" :disabled="!viewer" @click="onExport">导出</el-button>
                <el-button size="small" :disabled="!viewer" @click="onClear">清空</el-button>
            </div>

            <el-input v-model="dataText" type="textarea" :rows="26" class="military-plot-by-data-textarea"
                placeholder="数据格式:[{ id, type, styleConfig, points:[{lon,lat,height?}, ...] }]" />

        </el-card>
    </div>
</template>

<script>
import { ElMessage } from 'element-plus'
import { PLOT_TYPES } from '@/utils/map/militaryPlot'
import { MilitaryPlotByDataLayer, createAllTypesSampleData, createSampleDataForType } from '@/utils/map/militaryPlotByData'

export default {
    name: 'MilitaryPlotByData',
    props: {
        viewer: {
            type: Object,
            default: null
        }
    },
    data() {
        return {
            // 数据驱动图层:内部维护 id -> 图形实例映射
            layer: null,
            // 下拉:全部标绘类型
            typeOptions: PLOT_TYPES,
            selectedType: 'FineArrow',
            // JSON 输入框内容:[{id,type,styleConfig,points:[{lon,lat,height?}]}]
            dataText: ''
        }
    },
    watch: {
        viewer: {
            immediate: true,
            handler(next) {
                if (!next) return
                // viewer 就绪后再初始化图层
                if (!this.layer) this.initLayer()
            }
        }
    },
    methods: {
        // 创建数据驱动图层
        initLayer() {
            this.layer = new MilitaryPlotByDataLayer(this.viewer)
        },
        // 生成一个类型的示例数据(便于快速验证数据格式)
        onFillOneSample() {
            const sample = createSampleDataForType(this.selectedType)
            this.dataText = JSON.stringify([sample], null, 2)
        },
        // 生成全部类型示例数据(覆盖所有标绘类型)
        onFillAllSamples() {
            const list = createAllTypesSampleData()
            this.dataText = JSON.stringify(list, null, 2)
        },
        // 上图:解析 JSON -> setData 增量更新 -> 上图后定位到最后一个图形
        onApply() {
            try {
                if (!this.layer) this.initLayer()
                const list = JSON.parse(String(this.dataText || '[]'))
                const result = this.layer.setData(list, { clearMissing: true })
                if (result.errors && result.errors.length > 0) {
                    ElMessage.warning(`上图完成,但有 ${result.errors.length} 个图形失败`)
                } else {
                    ElMessage.success('上图成功')
                }
                const arr = Array.isArray(list) ? list : []
                const last = arr.length > 0 ? arr[arr.length - 1] : null
                if (last && last.id) {
                    if (this.layer) this.layer.flyTo(last.id)
                }
            } catch (e) {
                ElMessage.error(String(e && e.message ? e.message : e))
            }
        },
        // 导出:将当前已上图图形导出回 JSON 输入框
        onExport() {
            if (!this.layer) return
            this.dataText = JSON.stringify(this.layer.exportData(), null, 2)
            ElMessage.success('已导出到输入框')
        },
        // 清空:移除图层内全部图形,并重置输入框
        onClear() {
            if (!this.layer) return
            this.layer.clear()
            this.dataText = '[]'
            ElMessage.success('已清空')
        }
    },
    beforeUnmount() {
        if (this.layer) {
            // 组件卸载时释放实体/事件
            this.layer.destroy()
            this.layer = null
        }
    }
}
</script>

<style lang="scss" scoped>
.military-plot-by-data {
    position: absolute;
    top: 12px;
    left: 12px;
    z-index: 10;
}

.military-plot-by-data-card {
    width: 440px;
    background: rgba(255, 255, 255, 0.9);
    backdrop-filter: blur(6px);
}

.military-plot-by-data-title {
    font-weight: 600;
    margin-bottom: 10px;
}

.military-plot-by-data-row {
    display: flex;
    gap: 8px;
    align-items: center;
    margin-bottom: 10px;
    flex-wrap: wrap;
}

.military-plot-by-data-type {
    width: 200px;
}

.military-plot-by-data-hint {
    font-size: 12px;
    color: #909399;
    line-height: 1.4;
    margin: 8px 0 10px;
}
</style>
3、效果图