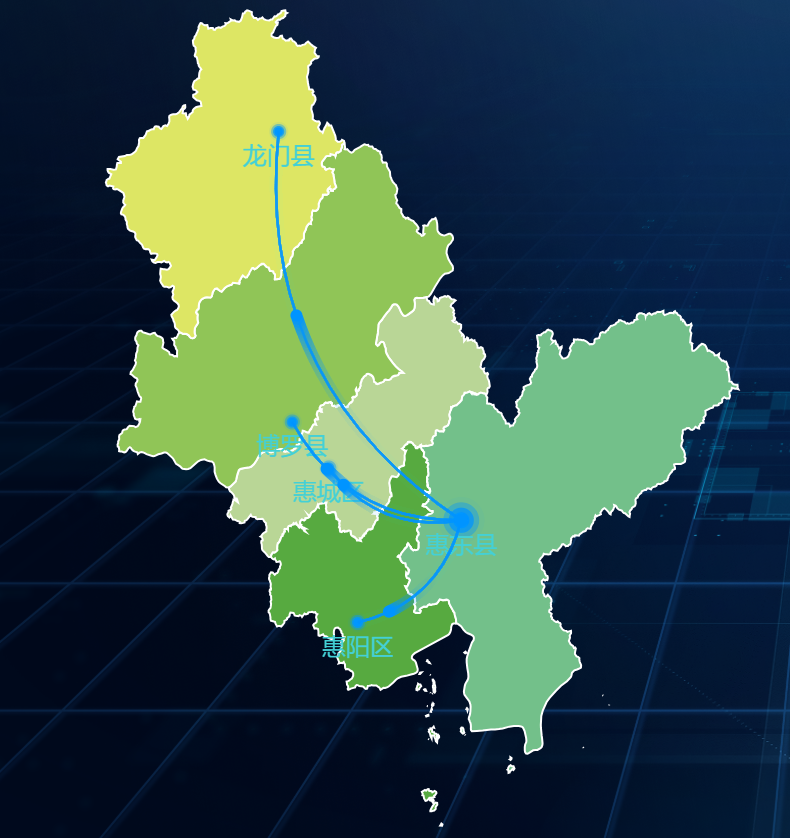
最终完成效果示例
开发前准备的工作
yarn add echarts
或者
npm install echarts --save
下载geojson地图数据包
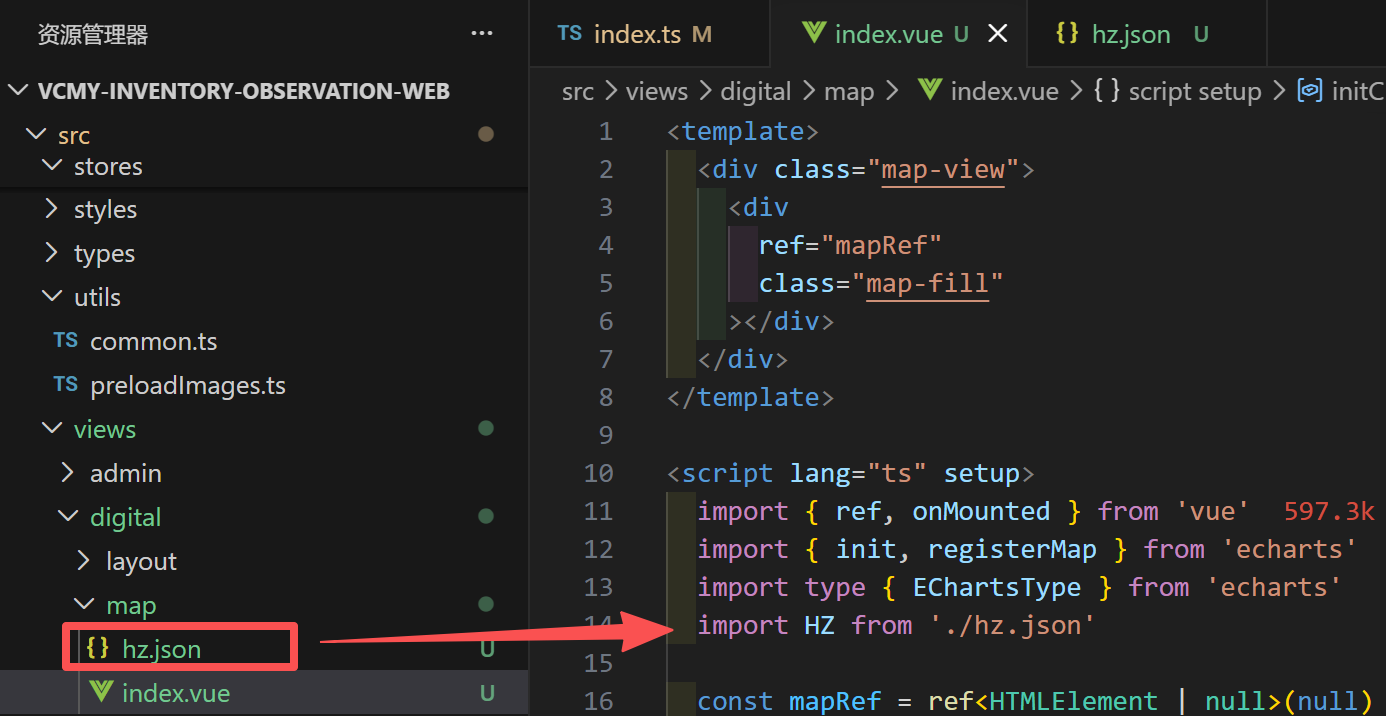
地图数据包geojson文件与页面代码文件放在同一级并引用echarts与geojson文件
javascript
<template>
  <div class="map-view">
    <div
      ref="mapRef"
      class="map-fill"
    ></div>
  </div>
</template>

<script lang="ts" setup>
  import { ref, onMounted } from 'vue'
  import { init, registerMap } from 'echarts'
  import type { EChartsType } from 'echarts'
  import HZ from './hz.json'

  const mapRef = ref<HTMLElement | null>(null)
  let chart: EChartsType | null = null

  const initChart = () => {
    if (!chart) {
      chart = init(mapRef.value as HTMLElement)

      // 局本部颜色,长度要与局本部一致
      const color = '#409EFF'
      // 供电所
      const place: any[] = []
      // 飞线
      const lines: any[] = []
      // 循环生成子节点与飞线坐标
      HZ.features.forEach((item) => {
        // 子节点
        place.push({
          name: item.properties.name,
          value: item.properties.center,
          itemStyle: {
            color
          }
        })
        // 飞线
        lines.push({
          name: item.properties.name,
          // 中心点到子节点的坐标
          coords: [['114.720136', '22.984831'], item.properties.center],
          // 线特效的配置
          effect: {
            color
          },
          lineStyle: {
            normal: {
              width: 1.2,
              curveness: 0.3,
              color
            },
            opacity: 0.3
          }
        })
      })

      // 添加地图数据 registerMap(城市字母开头大写, geojson数据)
      registerMap('HZ', HZ as any)

      // echarts 配置项
      chart.setOption({
        series: [
          // 局本部
          {
            name: '惠州地图',
            type: 'effectScatter',
            coordinateSystem: 'geo',
            zlevel: 15,
            symbolSize: 8,
            label: {
              show: false
            },
            // 涟漪特效相关配置
            rippleEffect: {
              period: 6, // 动画的周期,秒数
              num: 3, // 波纹的数量
              brushType: 'fill', // 波纹的绘制方式,可选 'stroke' 和 'fill'
              scale: 3 // 动画中波纹的最大缩放比例
            },
            // 中心点的数据,可以有多个,可以根据数据生成
            data: [
              {
                name: '惠东县',
                value: ['114.720136', '22.984831'],
                itemStyle: {
                  color: color,
                  border: '1px solid #FFFFFF'
                },
                label: {
                  show: false,
                  formatter: '惠东县',
                  position: 'top',
                  padding: [0, 10],
                  height: 30,
                  lineHeight: 30,
                  borderRadius: 5,
                  textStyle: {
                    fontSize: 14,
                    fontWeight: 600,
                    color: '#05092C'
                  },
                  backgroundColor: color
                }
              }
            ]
          },
          // 供电所
          {
            type: 'effectScatter',
            coordinateSystem: 'geo',
            zlevel: 15,
            symbolSize: 4,
            label: {
              show: true,
              formatter: (params: any) => params.name,
              position: 'bottom',
              textStyle: {
                fontSize: 12,
                color: '#43D0D6'
              }
            },
            data: place
          },
          // 飞线
          {
            type: 'lines',
            coordinateSystem: 'geo',
            zlevel: 15,
            // 线特效的配置
            effect: {
              show: true,
              period: 2, // 控制流星的速度,数字越小越快
              trailLength: 0.2, // 控制流星尾巴的长度,范围为0-1
              symbolSize: 6 // 尾巴大小
            },
            data: lines
          }
        ],
        geo: {
          // geo 配置
          map: 'HZ',
          roam: false,
          label: {
            show: false
          },
          itemStyle: {
            normal: {
              areaColor: '#323c48', //默认区块颜色
              borderColor: '#ffffff', //区块描边颜色
              borderWidth: 1 //区块描边颜色宽度
            },
            emphasis: {
              areaColor: '#45ad00' //鼠标划过区块的颜色
            }
          },
          regions: [
            // 区域配置
            {
              name: '惠城区', //区块名称
              itemStyle: {
                normal: {
                  areaColor: '#B9D696' // 区域颜色
                }
              }
            },
            {
              name: '惠阳区',
              itemStyle: {
                normal: {
                  areaColor: '#57AA40'
                }
              }
            },
            {
              name: '惠东县',
              itemStyle: {
                normal: {
                  areaColor: '#73C08A'
                }
              }
            },
            {
              name: '博罗县',
              itemStyle: {
                normal: {
                  areaColor: '#90C557'
                }
              }
            },
            {
              name: '龙门县',
              itemStyle: {
                normal: {
                  areaColor: '#DDE664'
                }
              }
            }
          ]
        }
      })
    }
  }

  onMounted(() => {
    initChart()
  })
</script>

<style lang="scss" scoped>
  .map-view {
    .map-fill {
      width: useVH(1000);
      height: useVH(1000);
    }
  }
</style>