方式一:nginx-module-vts 方式(推荐,无需额外 exporter)
1. 环境准备与依赖安装
# 1. 安装基础依赖
yum -y install gcc-c++ pcre pcre-devel zlib zlib-devel openssl openssl-devel git wget

# 2. 创建工作目录
mkdir -p /opt/nginx-install && cd /opt/nginx-install

# 3. 下载 Nginx 1.24.0 和 nginx-module-vts 模块
wget http://nginx.org/download/nginx-1.24.0.tar.gz
git clone git://github.com/vozlt/nginx-module-vts.git

# 4. 解压 Nginx 源码包
tar -zxvf nginx-1.24.0.tar.gz
mv nginx-module-vts /usr/local/nginx-module-vts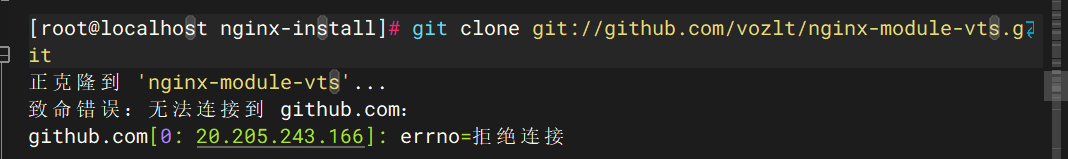
GitHub 的 git 协议(git://)可能被防火墙拦截,换成 HTTPS 协议,同时使用国内镜像源(如 GitHub 镜像站):
# 1. 先删除失败的空目录(如果有)
rm -rf nginx-module-vts

# 2. 使用 HTTPS 协议克隆(优先)
git clone https://github.com/vozlt/nginx-module-vts.git

# 如果依然失败,使用国内镜像站(如 gitee 镜像)
git clone https://gitee.com/mirrors/nginx-module-vts.git
2. 编译安装 Nginx(带 vts 模块)
# 进入 Nginx 源码目录
cd /opt/nginx-install/nginx-1.24.0

# 配置编译参数(指定安装路径 + 加载 vts 模块)
./configure --prefix=/usr/local/nginx --add-module=/usr/local/nginx-module-vts/

# 编译并安装(-j 后接CPU核心数,加快编译速度,比如 -j4)
make -j4 && make install

# 验证模块是否加载成功
/usr/local/nginx/sbin/nginx -V | grep nginx-module-vts
# 输出包含 --add-module=/usr/local/nginx-module-vts/ 即表示成功
3. 配置 Nginx 开启状态监控
# 备份原有配置文件
cp /usr/local/nginx/conf/nginx.conf /usr/local/nginx/conf/nginx.conf.bak
# 编辑 Nginx 主配置文件
cat > /usr/local/nginx/conf/nginx.conf << 'EOF'
worker_processes 1;
events {
worker_connections 1024;
}
http {
include mime.types;
default_type application/octet-stream;
# 开启 vts 状态监控区域
vhost_traffic_status_zone;
sendfile on;
keepalive_timeout 65;
server {
listen 80;
server_name localhost;
# 配置状态监控接口
location /status {
vhost_traffic_status_display;
vhost_traffic_status_display_format html;
}
location / {
root html;
index index.html index.htm;
}
error_page 500 502 503 504 /50x.html;
location = /50x.html {
root html;
}
}
}
EOF
# 启动/重启 Nginx
/usr/local/nginx/sbin/nginx -t # 验证配置文件
/usr/local/nginx/sbin/nginx # 启动
# 如果已启动,执行重启:/usr/local/nginx/sbin/nginx -s reload
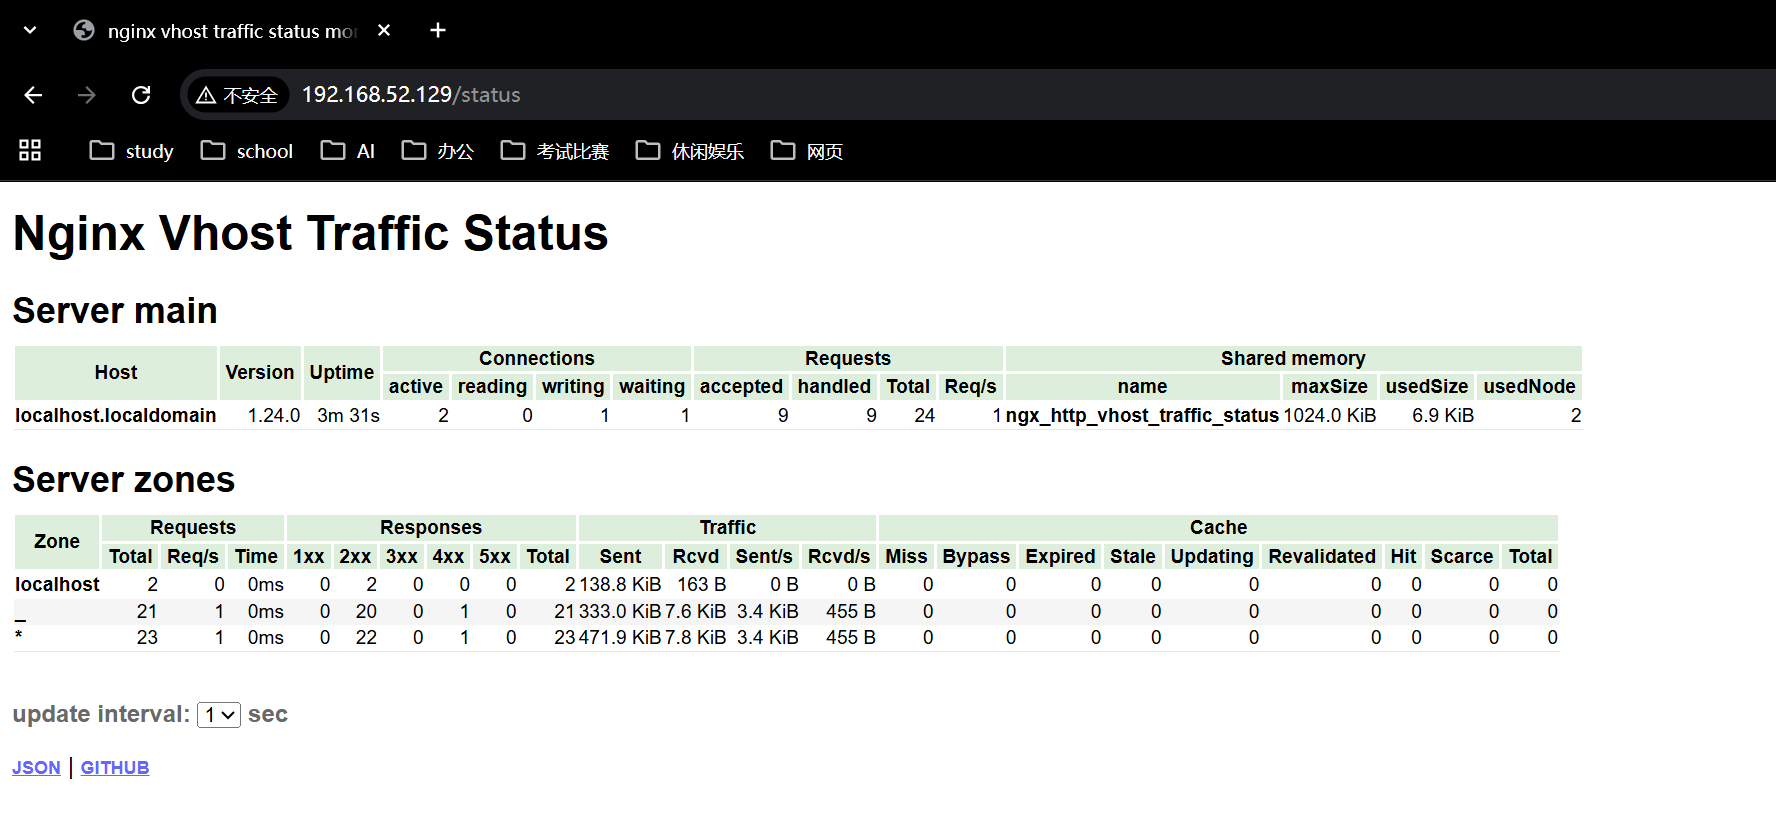
# 验证状态页面是否可访问
curl http://172.16.213.29/status # 查看 HTML 格式状态
curl http://172.16.213.29/status/format/prometheus # 查看 Prometheus 格式指标4. 配置 Prometheus 采集 Nginx 指标
# 备份 Prometheus 配置文件
cp /usr/local/prometheus/prometheus.yml /usr/local/prometheus/prometheus.yml.bak

# 编辑 Prometheus 配置,添加 Nginx 采集任务
sed -i '/scrape_configs:/a\  - job_name: "nginx"\n    metrics_path: /status/format/prometheus\n    static_configs:\n      - targets: ["172.16.213.29"]' /usr/local/prometheus/prometheus.yml

# 验证配置文件
/usr/local/prometheus/promtool check config /usr/local/prometheus/prometheus.yml

# 重启 Prometheus(根据你的启动方式选择,以下是 systemd 方式示例)
systemctl restart prometheus
# 如果是直接启动,先杀死进程再重启:
# ps -ef | grep prometheus | grep -v grep | awk '{print $2}' | xargs kill
# /usr/local/prometheus/prometheus --config.file=/usr/local/prometheus/prometheus.yml &
方式二:nginx-prometheus-exporter 方式(官方推荐,更简单)
1. 确保 Nginx 已开启 stub_status 模块
# 编辑 Nginx 配置,开启 stub_status
cp /usr/local/nginx/conf/nginx.conf /usr/local/nginx/conf/nginx.conf.bak
sed -i '/server {/a\        location /basic_status {\n            stub_status on;\n            allow 127.0.0.1;\n            allow 172.16.213.0/24;\n            deny all;\n        }' /usr/local/nginx/conf/nginx.conf

# 验证配置并重启
/usr/local/nginx/sbin/nginx -t
/usr/local/nginx/sbin/nginx -s reload

# 验证 stub_status 是否可用
curl http://172.16.213.29/basic_status
# 正常输出示例:
# Active connections: 1
# server accepts handled requests
#  1 1 1
# Reading: 0 Writing: 1 Waiting: 0
2. 用 Docker 运行 nginx-prometheus-exporter
# 拉取官方镜像
docker pull nginx/nginx-prometheus-exporter:latest

# 启动 exporter(关联 Nginx 的 stub_status 地址)
docker run -d --name nginx-exporter \
  -p 9113:9113 \
  nginx/nginx-prometheus-exporter:latest \
  --nginx.scrape-uri=http://172.16.213.29/basic_status

# 验证 exporter 是否正常输出指标
curl http://172.16.213.29:9113/metrics
3. 配置 Prometheus 采集 exporter 指标
# 编辑 Prometheus 配置,添加 exporter 采集任务
sed -i '/scrape_configs:/a\  - job_name: "nginx-exporter"\n    static_configs:\n      - targets: ["172.16.213.29:9113"]' /usr/local/prometheus/prometheus.yml

# 验证配置并重启 Prometheus
/usr/local/prometheus/promtool check config /usr/local/prometheus/prometheus.yml
systemctl restart prometheus
总结
- nginx-module-vts 方式:无需额外运行 exporter,直接通过 Nginx 自身模块暴露 Prometheus 格式指标,指标更丰富(支持虚拟主机、upstream 等)。
- nginx-prometheus-exporter 方式:官方维护,部署更简单,仅依赖 Nginx 原生的 stub_status 模块,适合基础监控需求。
- 核心验证步骤:确保 Nginx 状态接口可访问 → Prometheus 配置正确 → Prometheus 页面能看到
nginx或nginx-exporter任务状态为UP。
执行完上述命令后,你可以在 Prometheus Web UI(默认 http://prometheus服务器IP:9090)的「Targets」页面查看 Nginx 采集任务是否正常,也可以通过「Graph」页面查询 Nginx 相关指标(如 nginx_connections_active、nginx_requests_total 等)。
正确的验证操作
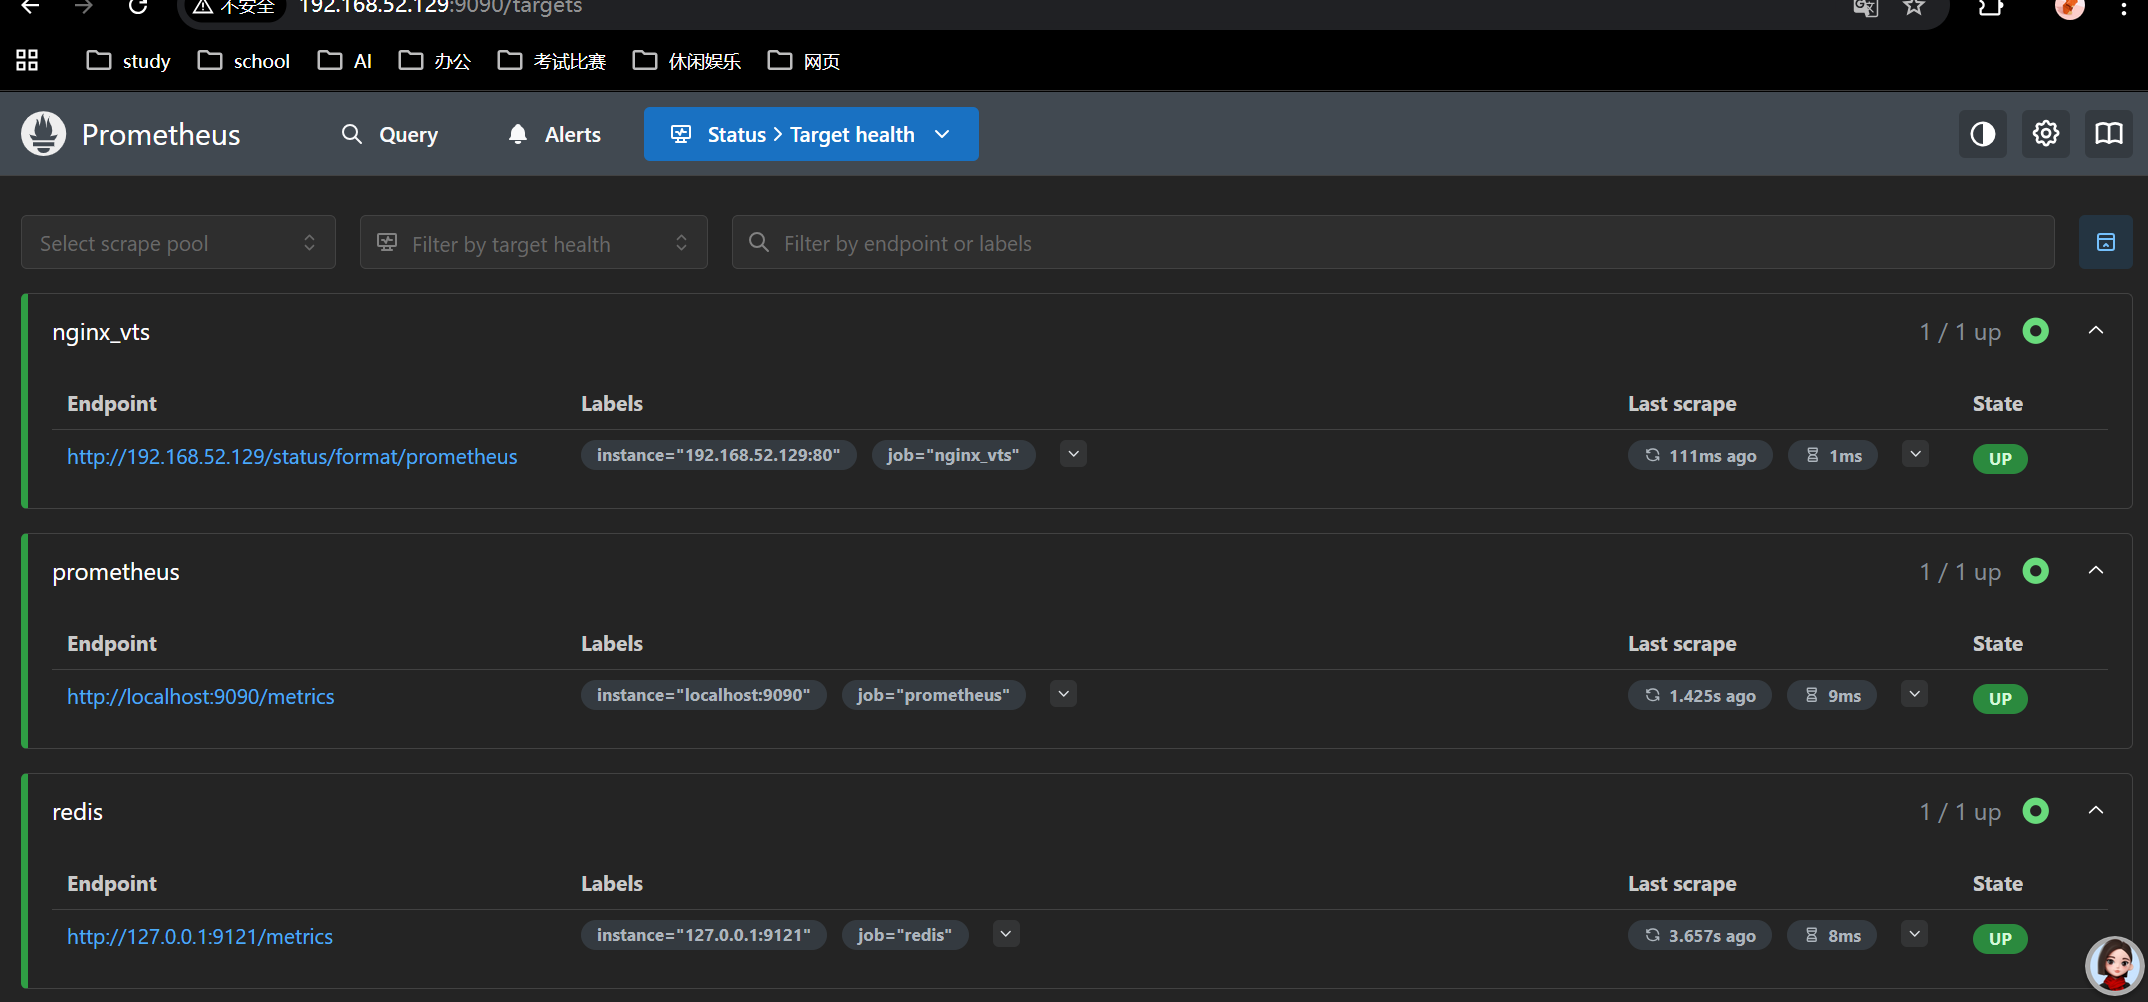
- 用浏览器访问 Prometheus UI
在你的电脑(能访问 192.168.52.129 的机器)上打开浏览器,输入:
http://192.168.52.129:9090/targets- 你会看到 Prometheus 的 Targets 页面,里面会列出 3 个采集任务:
prometheus、redis、nginx_vts - 检查
nginx_vts的状态:
-
- 如果显示UP:说明采集成功
- 如果显示DOWN:大概率是 Prometheus 访问 Nginx 时的网络问题(但你 curl 能通,大概率是 UP)
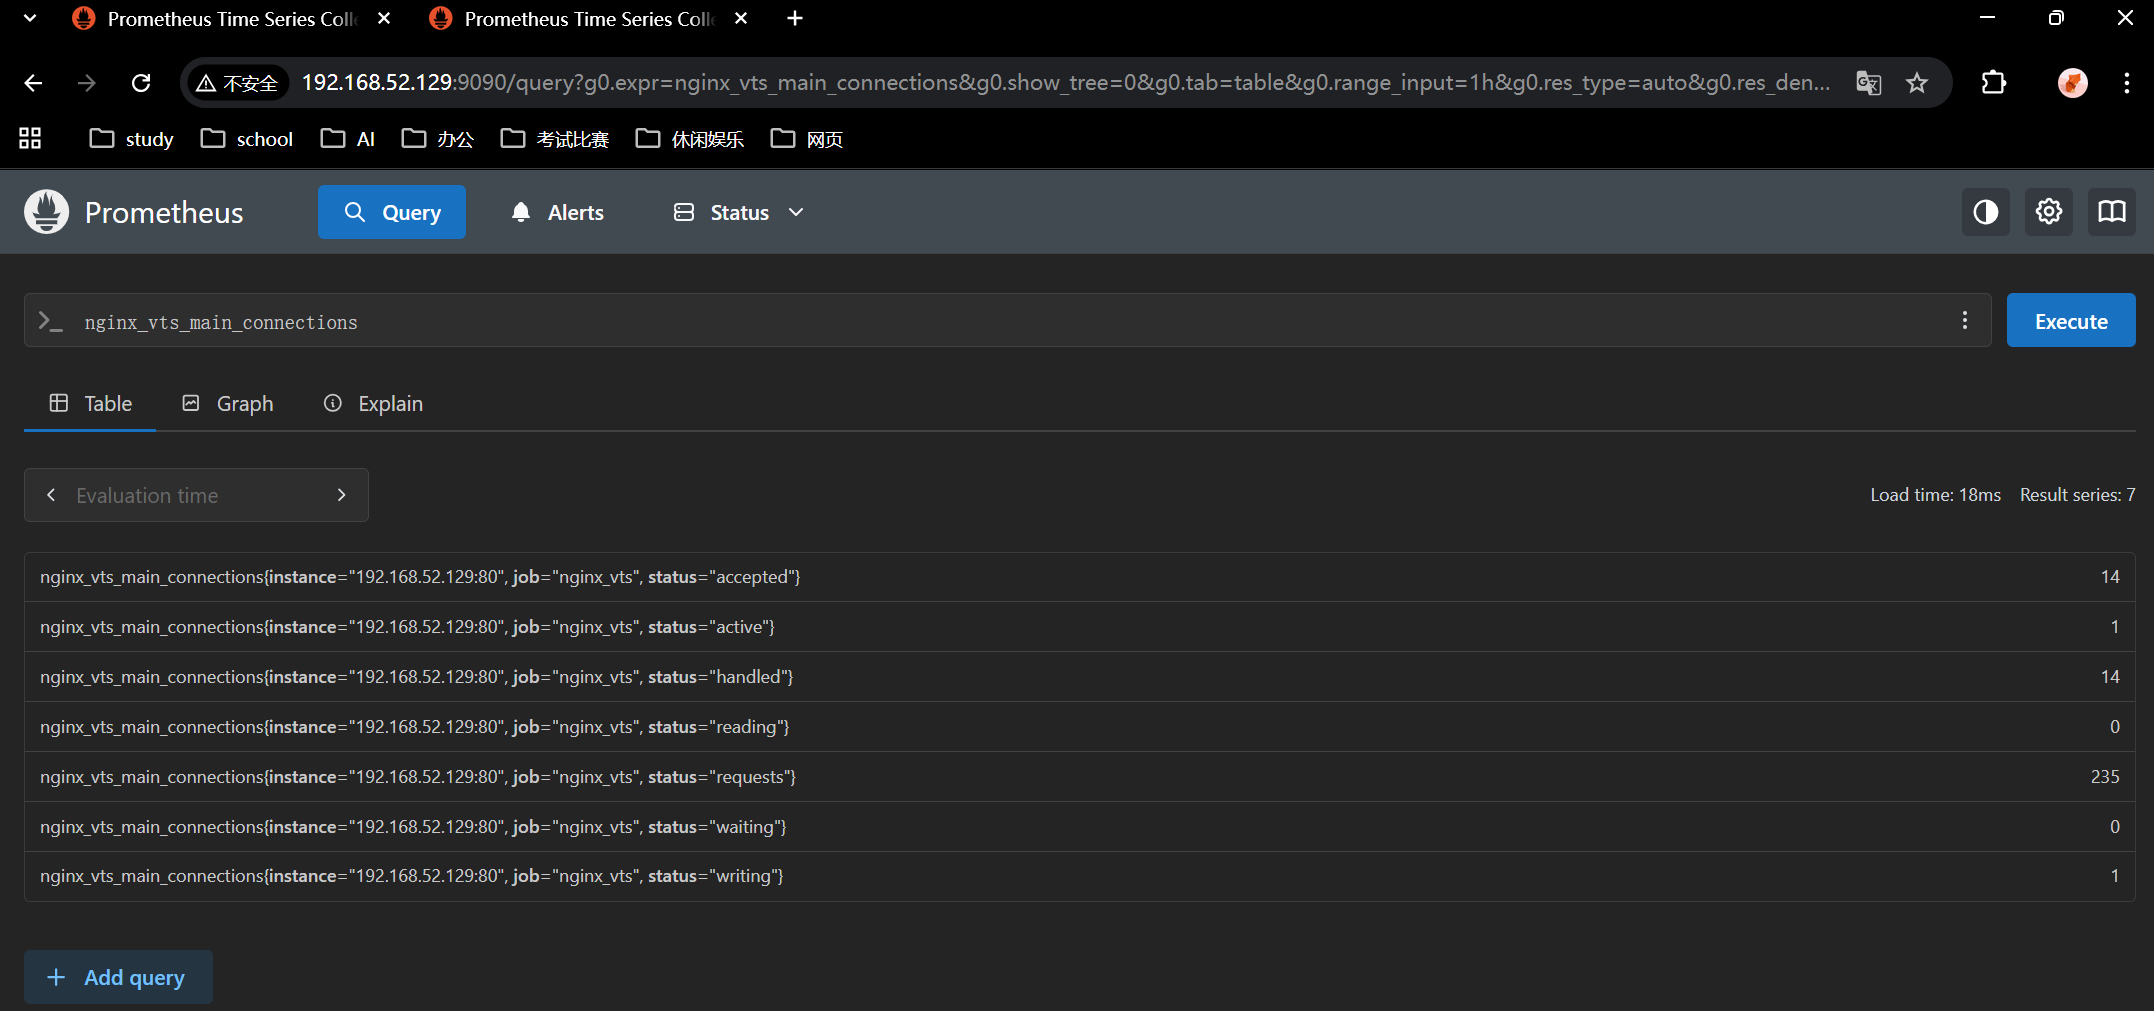
- 验证是否采集到 Nginx 指标
在浏览器中访问:
http://192.168.52.129:9090/graph- 在输入框中输入指标名:
nginx_vts_main_connections - 点击
Execute按钮,就能看到 Nginx 的连接数指标数据(如果能看到,说明采集成功)