安装prometheus
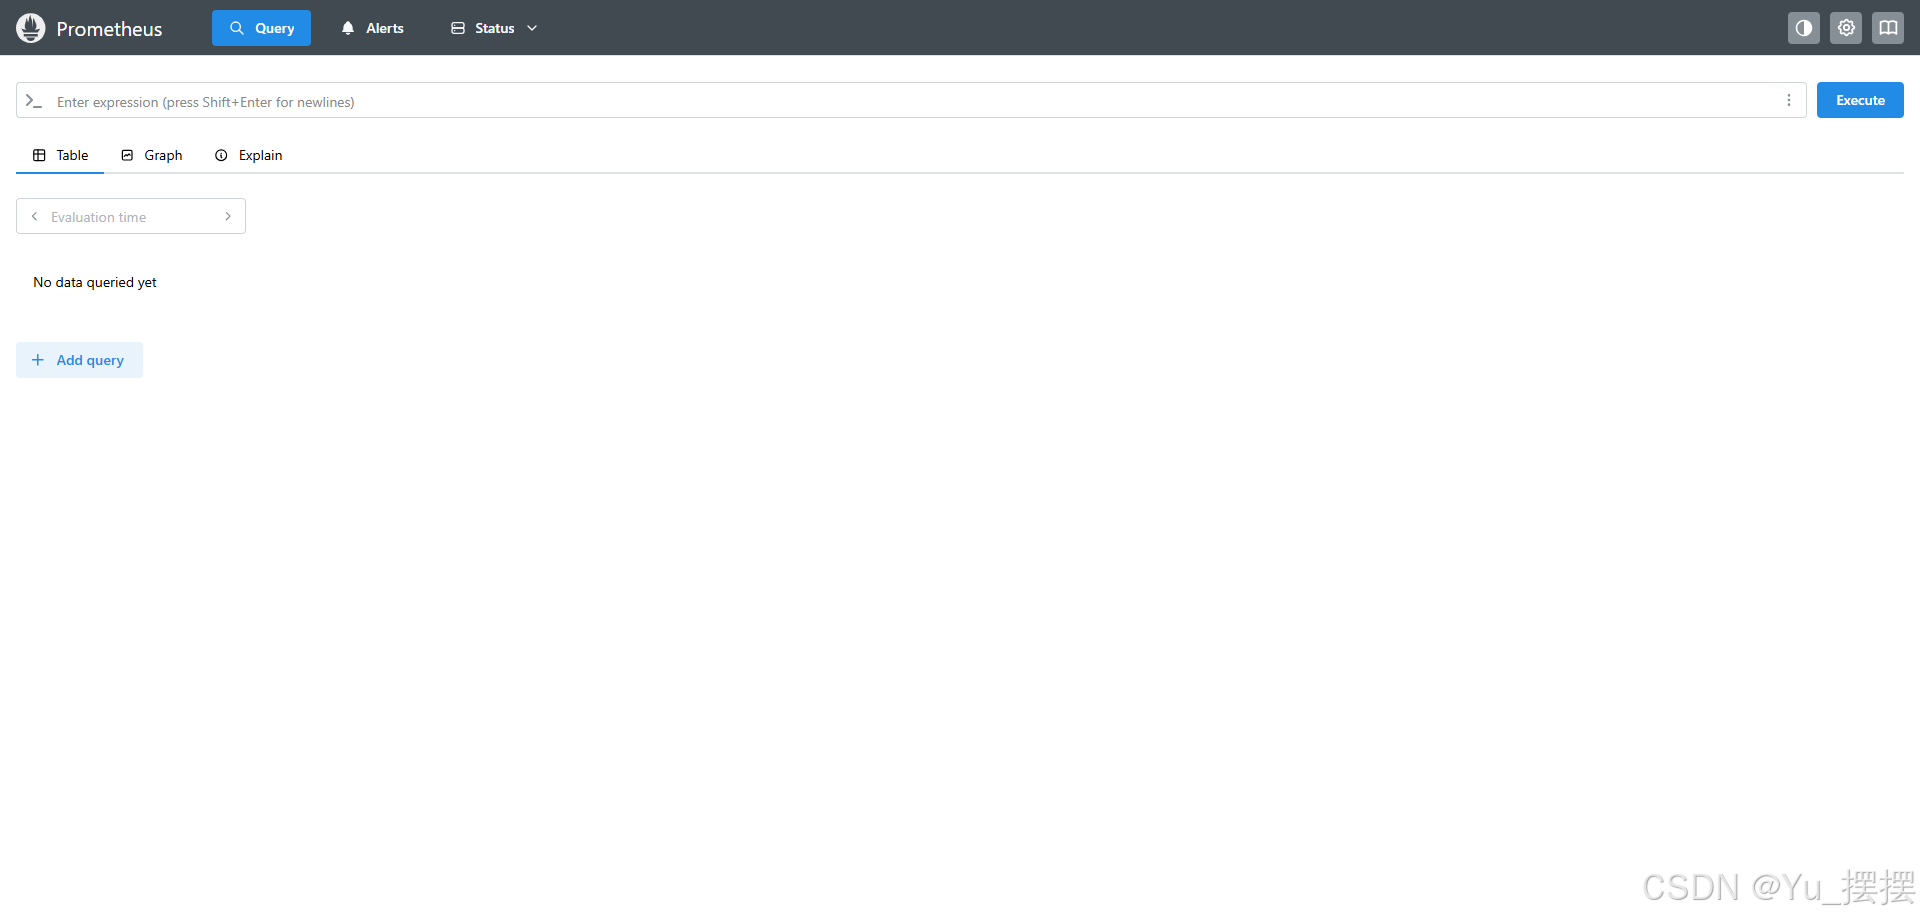
下载版本是prometheus-3.5.1.windows-amd64.zip,下载后直接解压,双击目录下的prometheus.exe即可运行,默认端口是9090,访问http://localhost:9090/,出现以下界面即成功启动
安装windows_exporter
下载windows_exporter-0.30.7-amd64.msi,双击运行安装即可
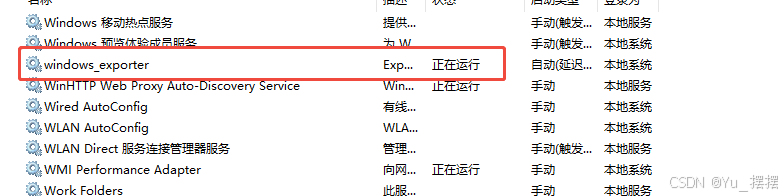
安装后默认地址是C:\Program Files\windows_exporter,双击该目录下的windows_exporter.exe运行,查看该服务状态,显示运行中
- 注意 :不要下载最新版,下载最新版大部分监控数据无法正常显示
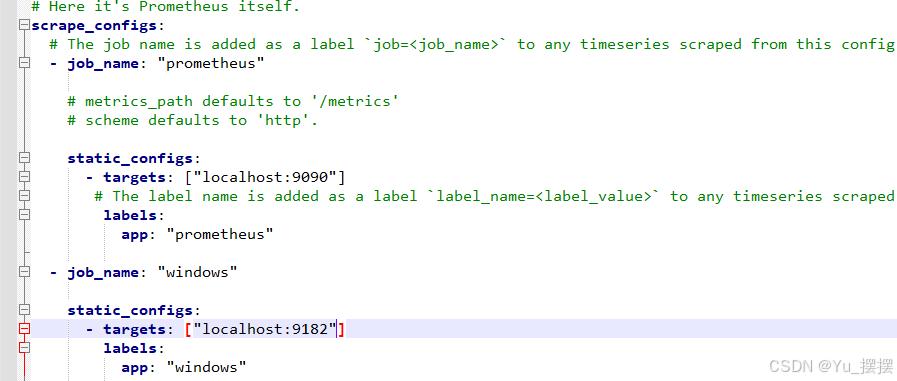
修改prometheus安装目录下的prometheus.yml,加上windows_exporter的配置,重启prometheus
yaml
scrape_configs:
  # The job name is added as a label `job=<job_name>` to any timeseries scraped from this config.
  - job_name: "prometheus"

    # metrics_path defaults to '/metrics'
    # scheme defaults to 'http'.

    static_configs:
      - targets: ["localhost:9090"]
       # The label name is added as a label `label_name=<label_value>` to any timeseries scraped from this config.
        labels:
          app: "prometheus"

  - job_name: "windows"

    static_configs:
      - targets: ["localhost:9182"]
        labels: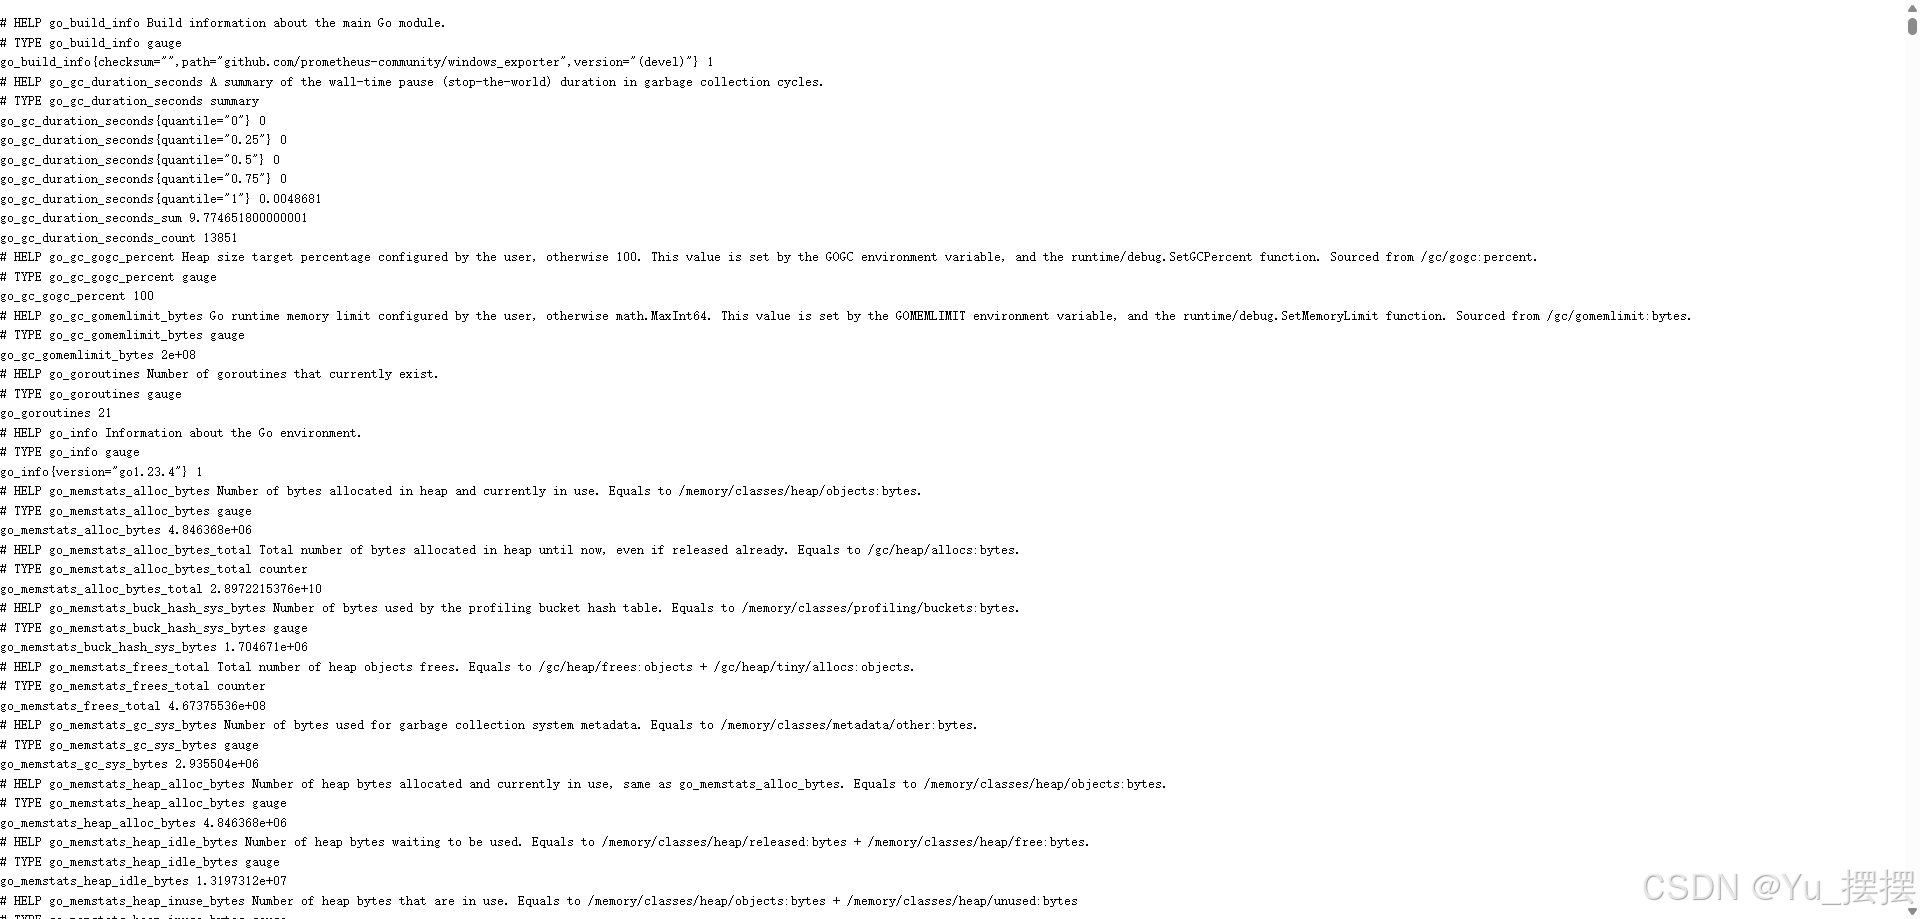
app: "windows"浏览器访问http://localhost:9182/metrics,出现以下页面则正常运行
安装grafana
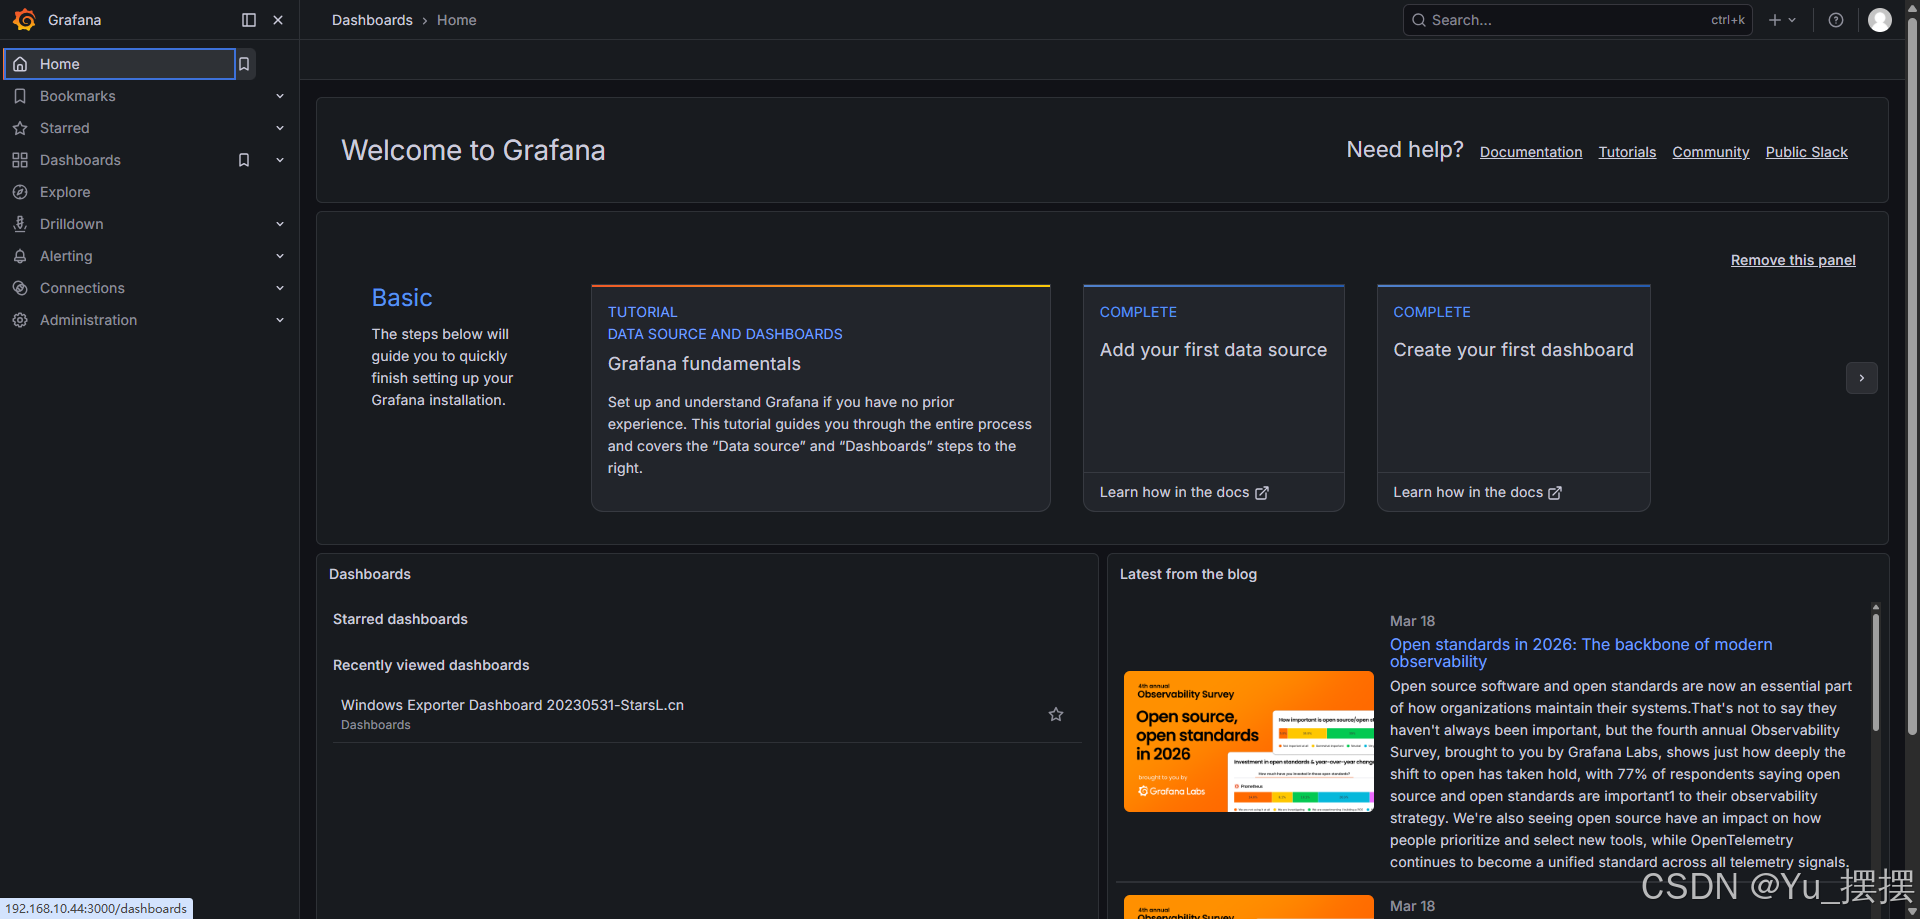
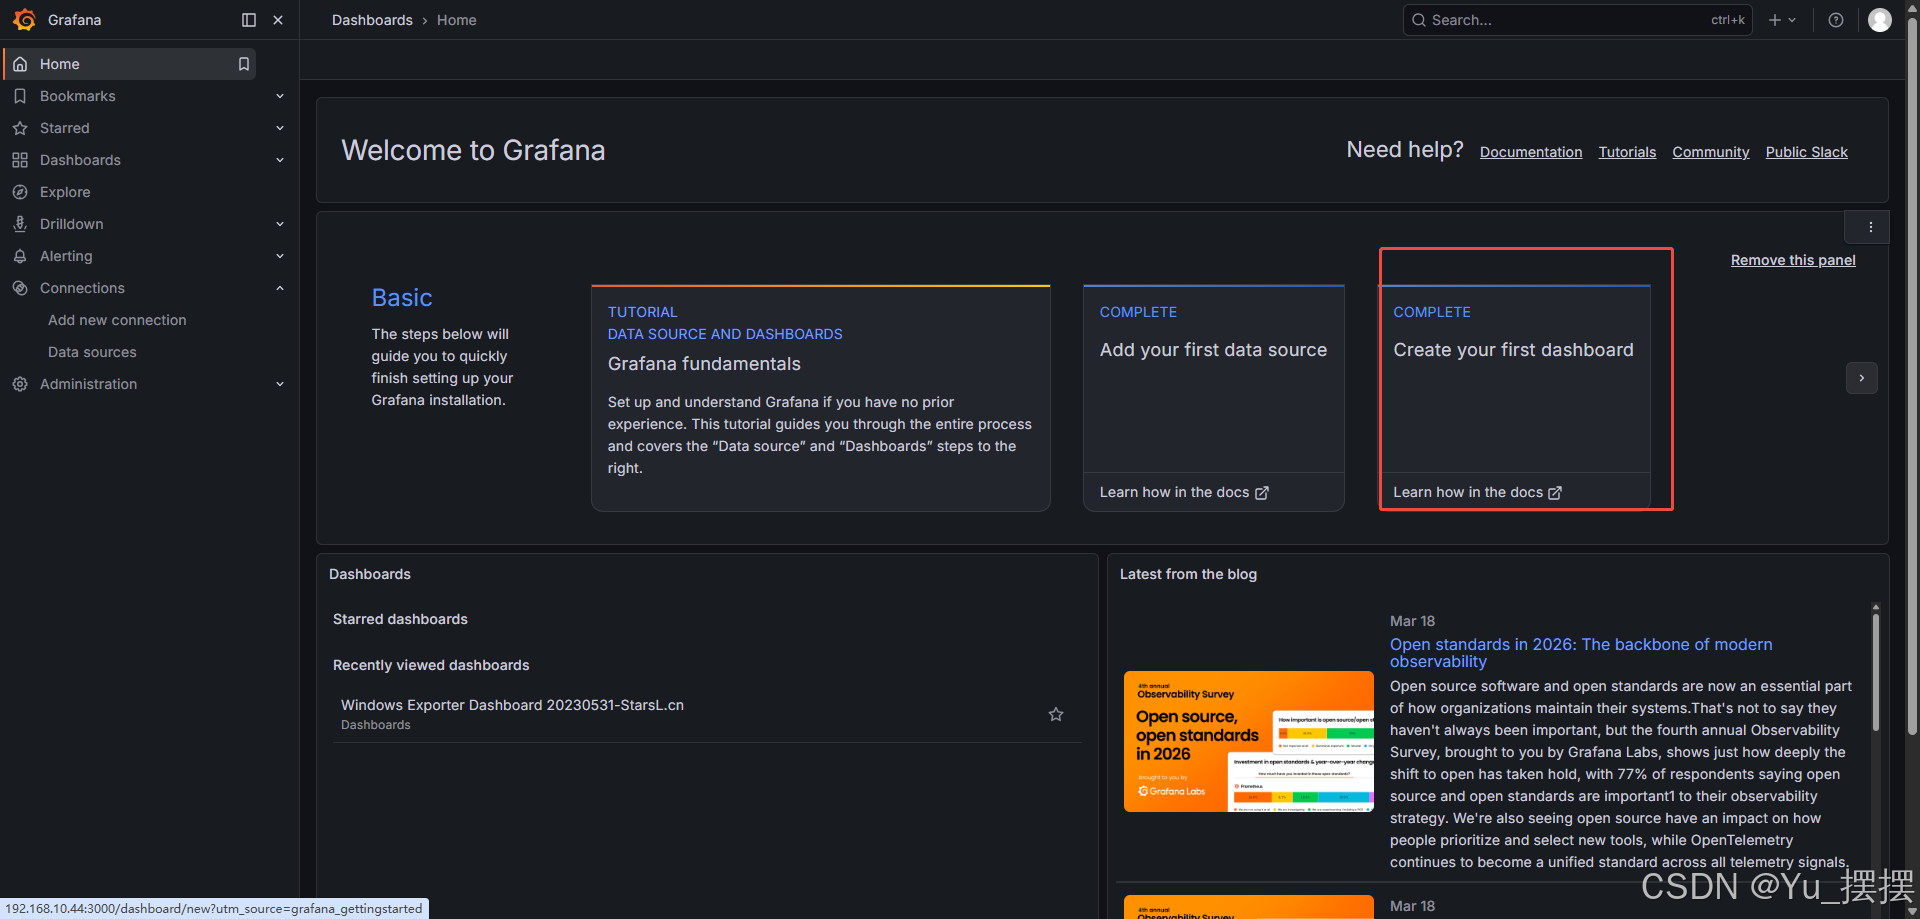
下载grafana_12.4.1_22846628243_windows_amd64.msi,双击运行即可,默认端口是3000,启动双击安装目录下的C:\Program Files\GrafanaLabs\grafana\bin\grafana.exe即可,访问http://localhost:3000/,出现登录页,默认密码是admin/admin,登录成功后出现以下界面
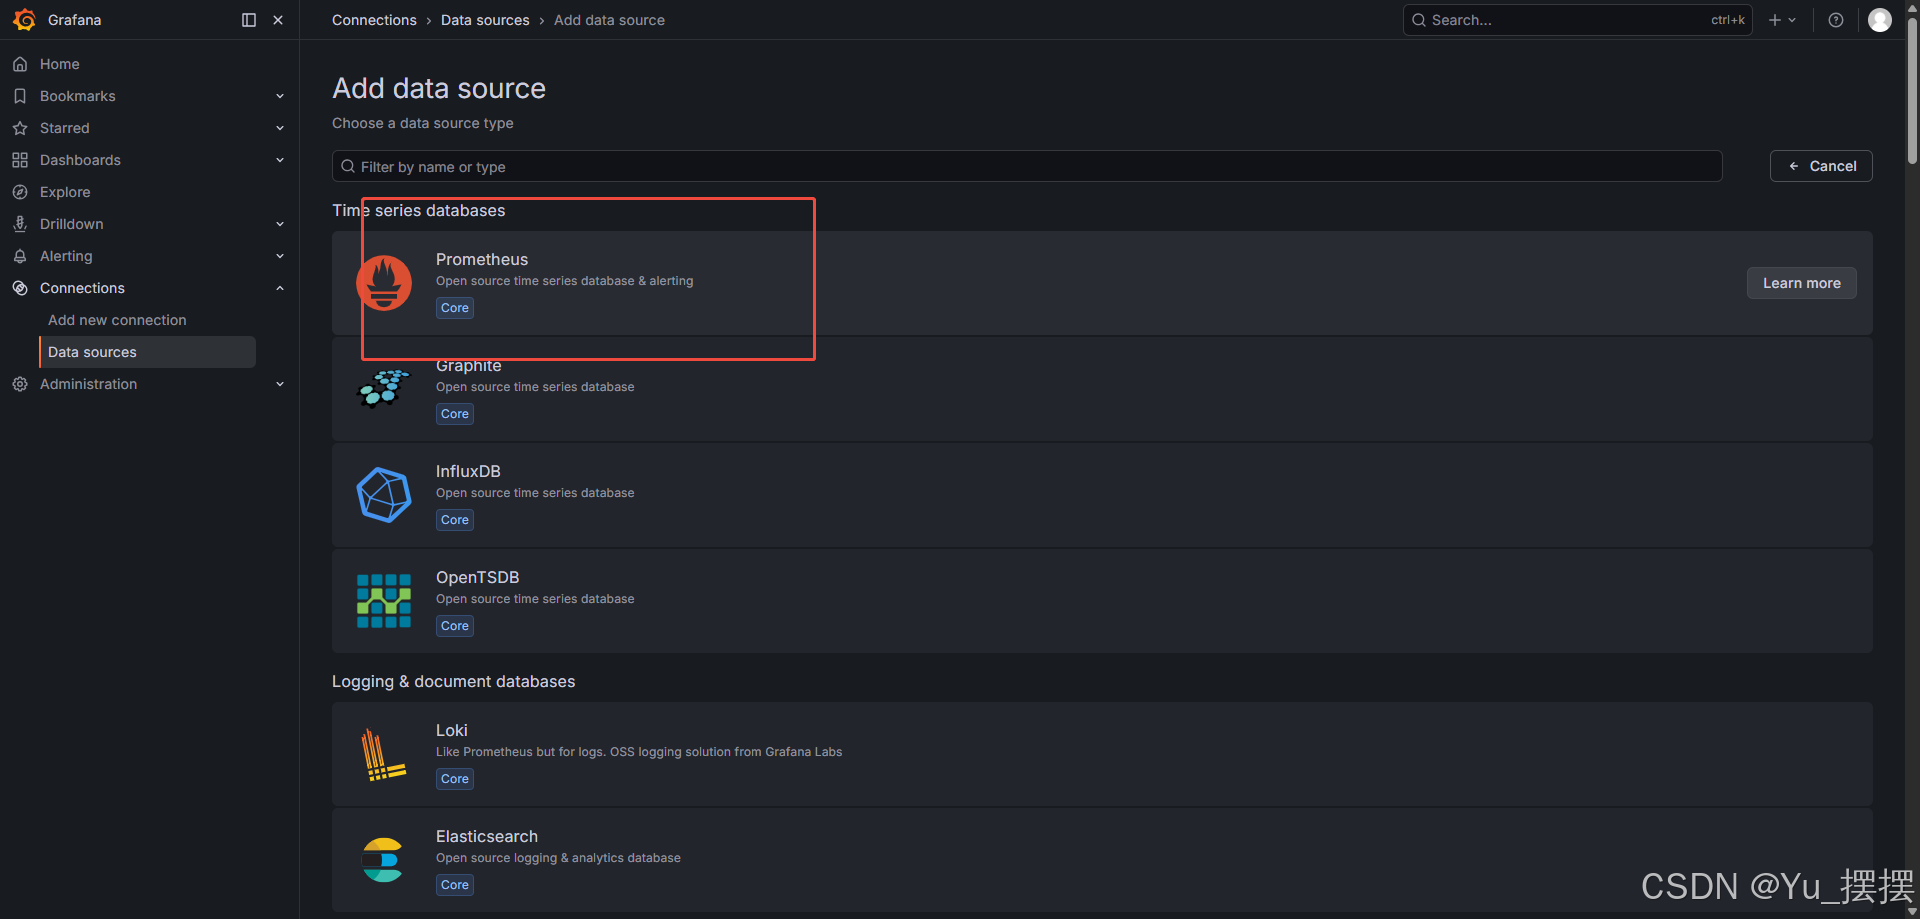
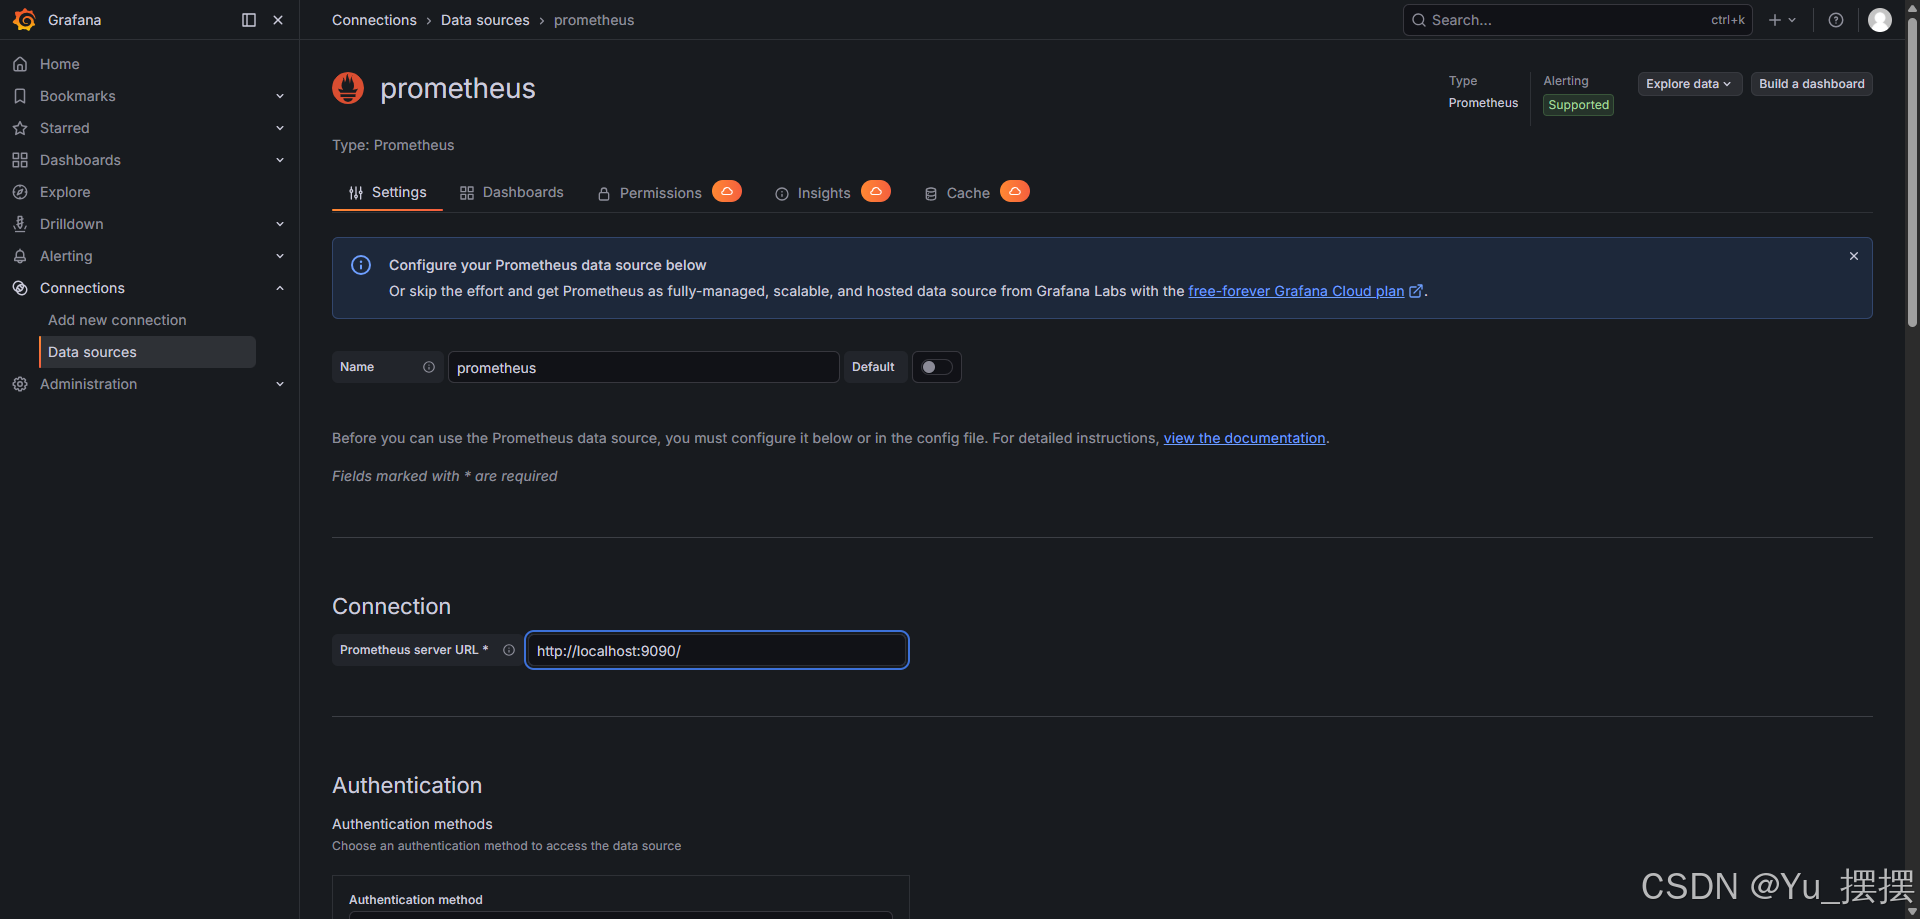
- 添加数据源,选择prometheus并保存
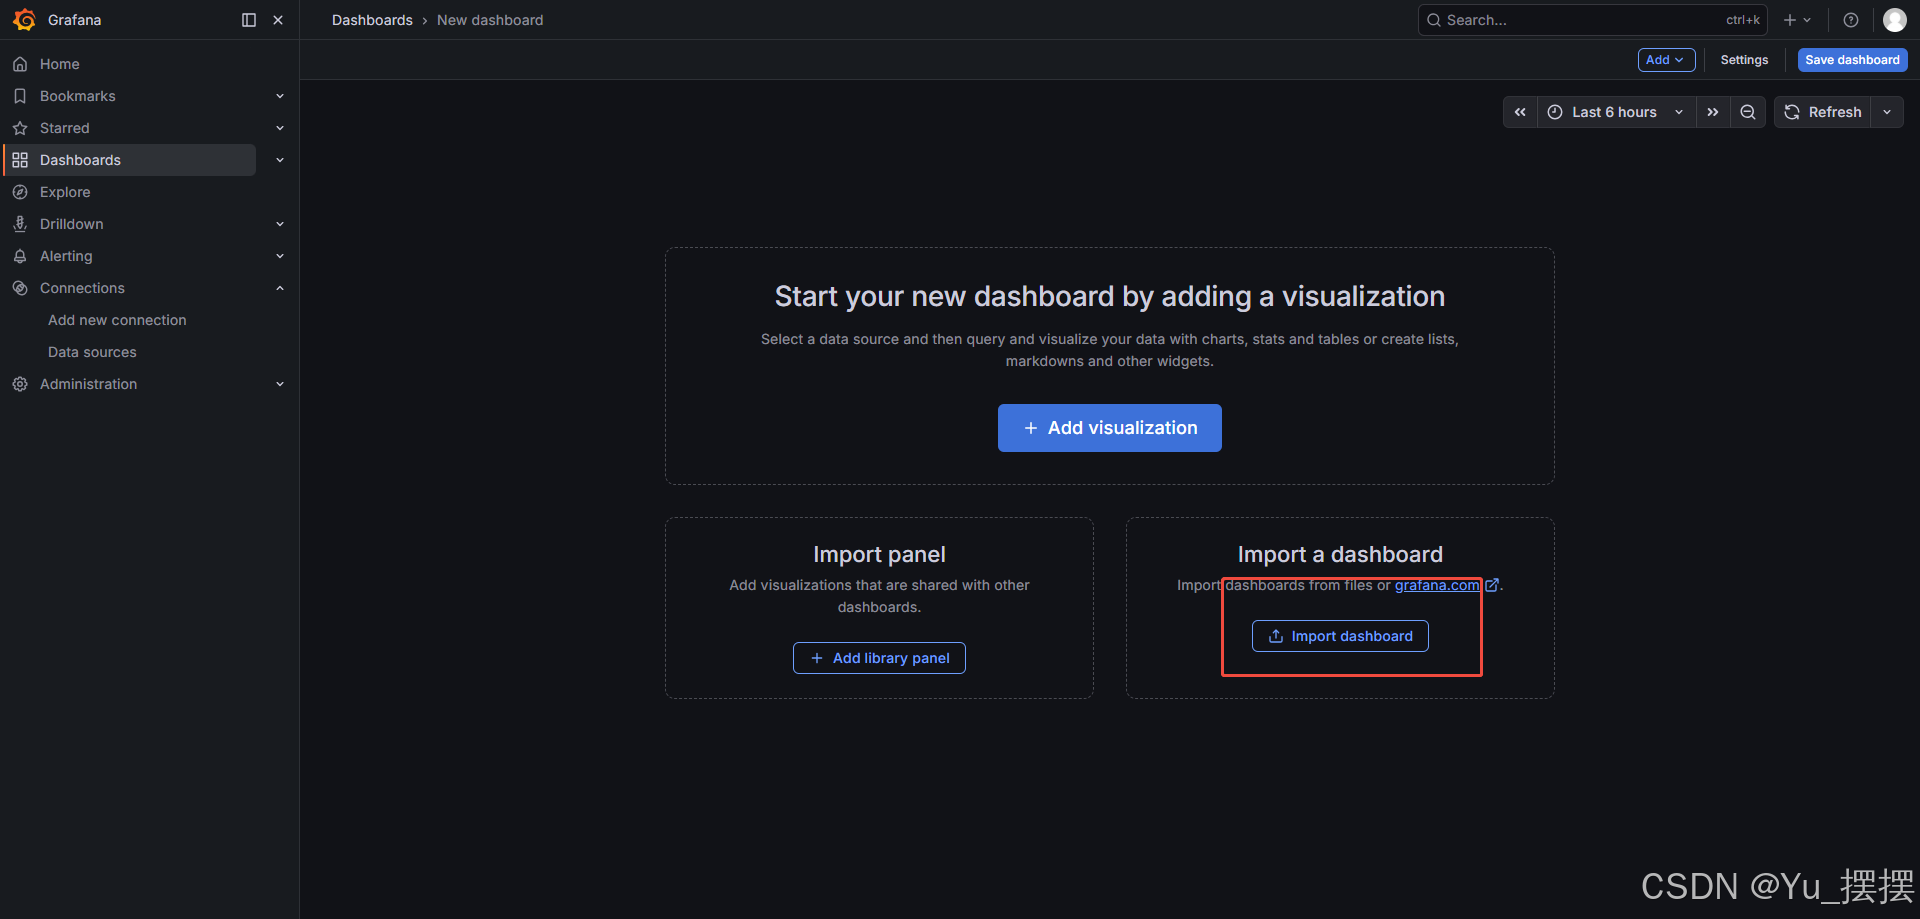
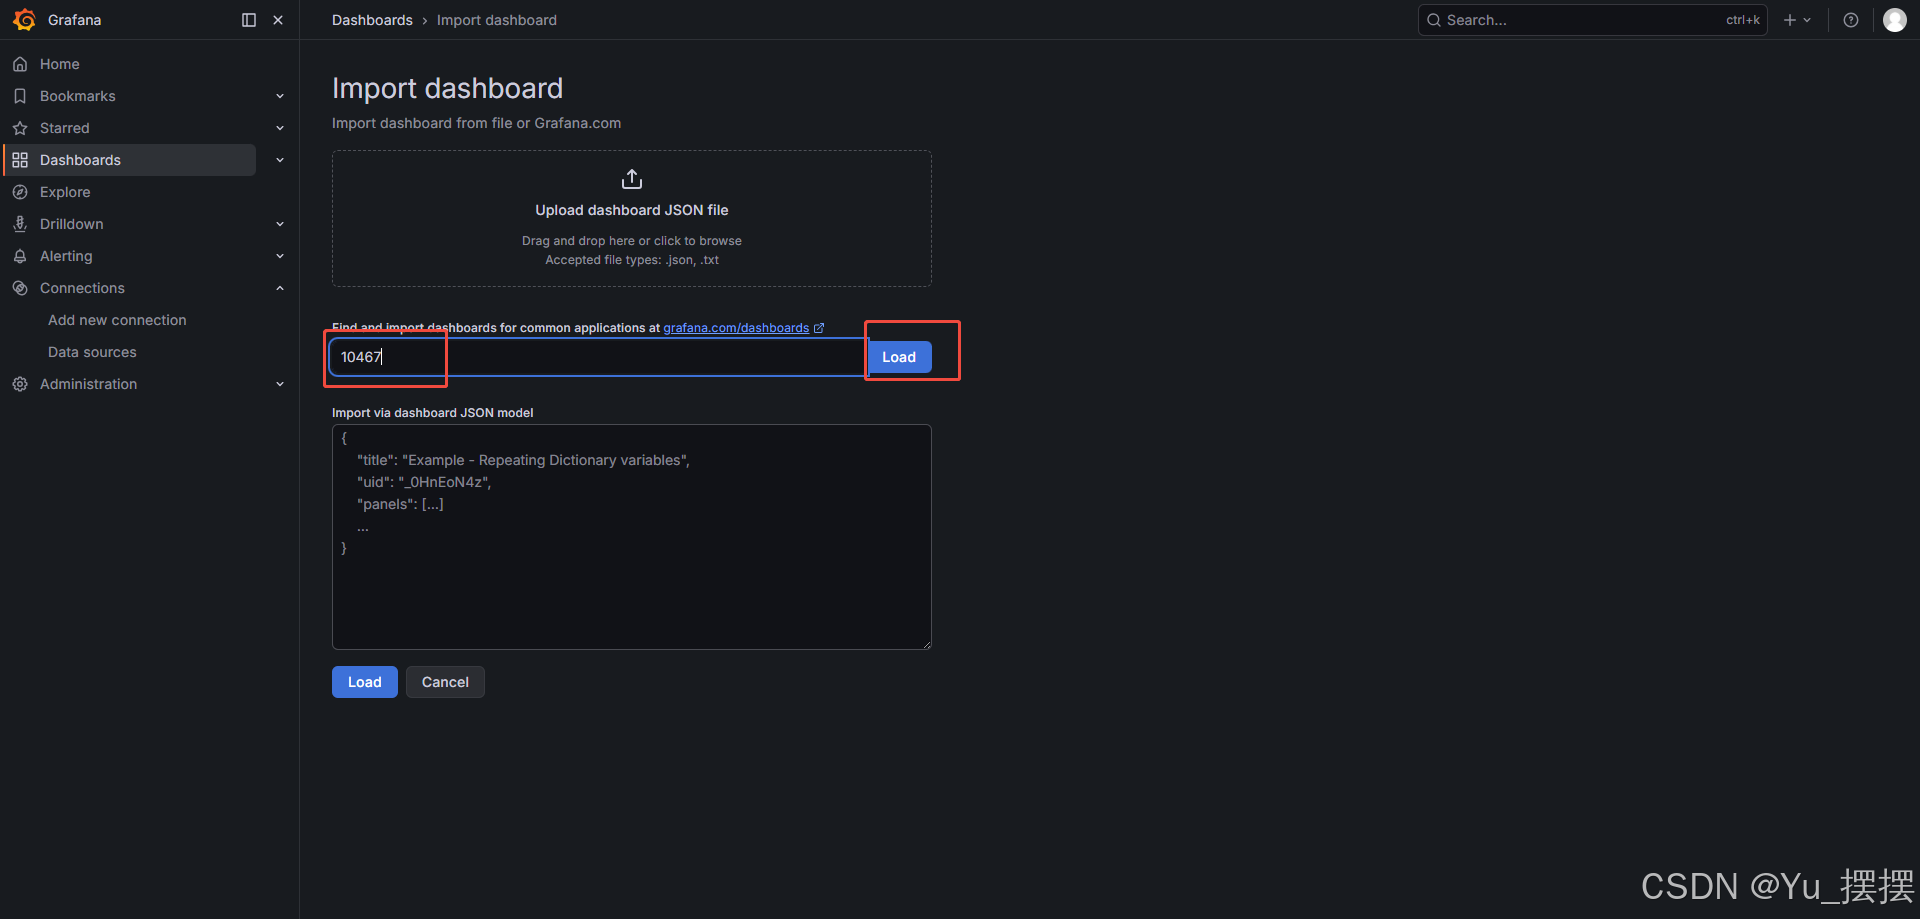
- 添加仪表盘,本次只用到ID导入的方式添加,ID是10467,这是windows常用监控面板
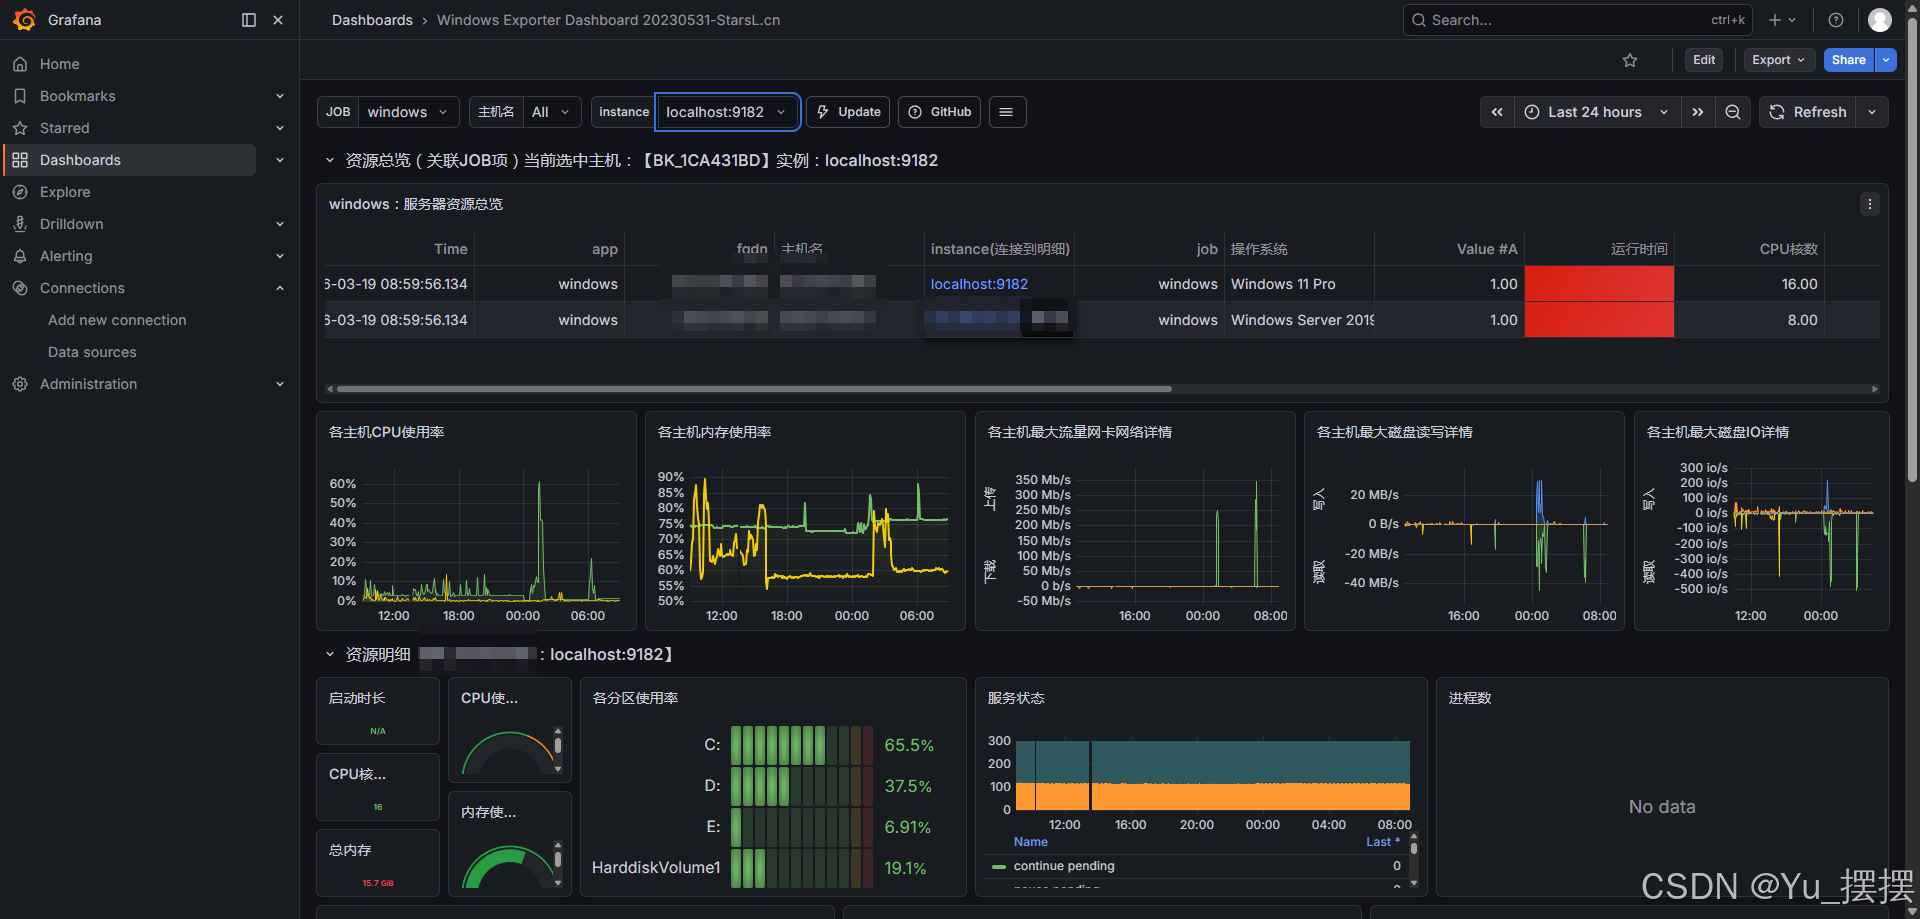
- 添加成功后等待一段时间,在仪表盘就能看到正常的监控数据
安装alertmanager
alertmanager主要是实现告警管理和发送邮件、消息等功能,也可以接通企业微信的群机器人实现通知,本次只用到发送邮件功能,alert消息通知有一个自动去重功能,在设置时间段内只发送一次,具体规则可以网上查询。
alertmanager下载地址
我下载的版本是0.27.0,下载alertmanager-0.27.0.windows-amd64.zip,解压即可
解压后进入目录双击alertmanager.exe则成功运行,默认端口是9093,访问http://localhost:9093/,出现以下界面则启动成功
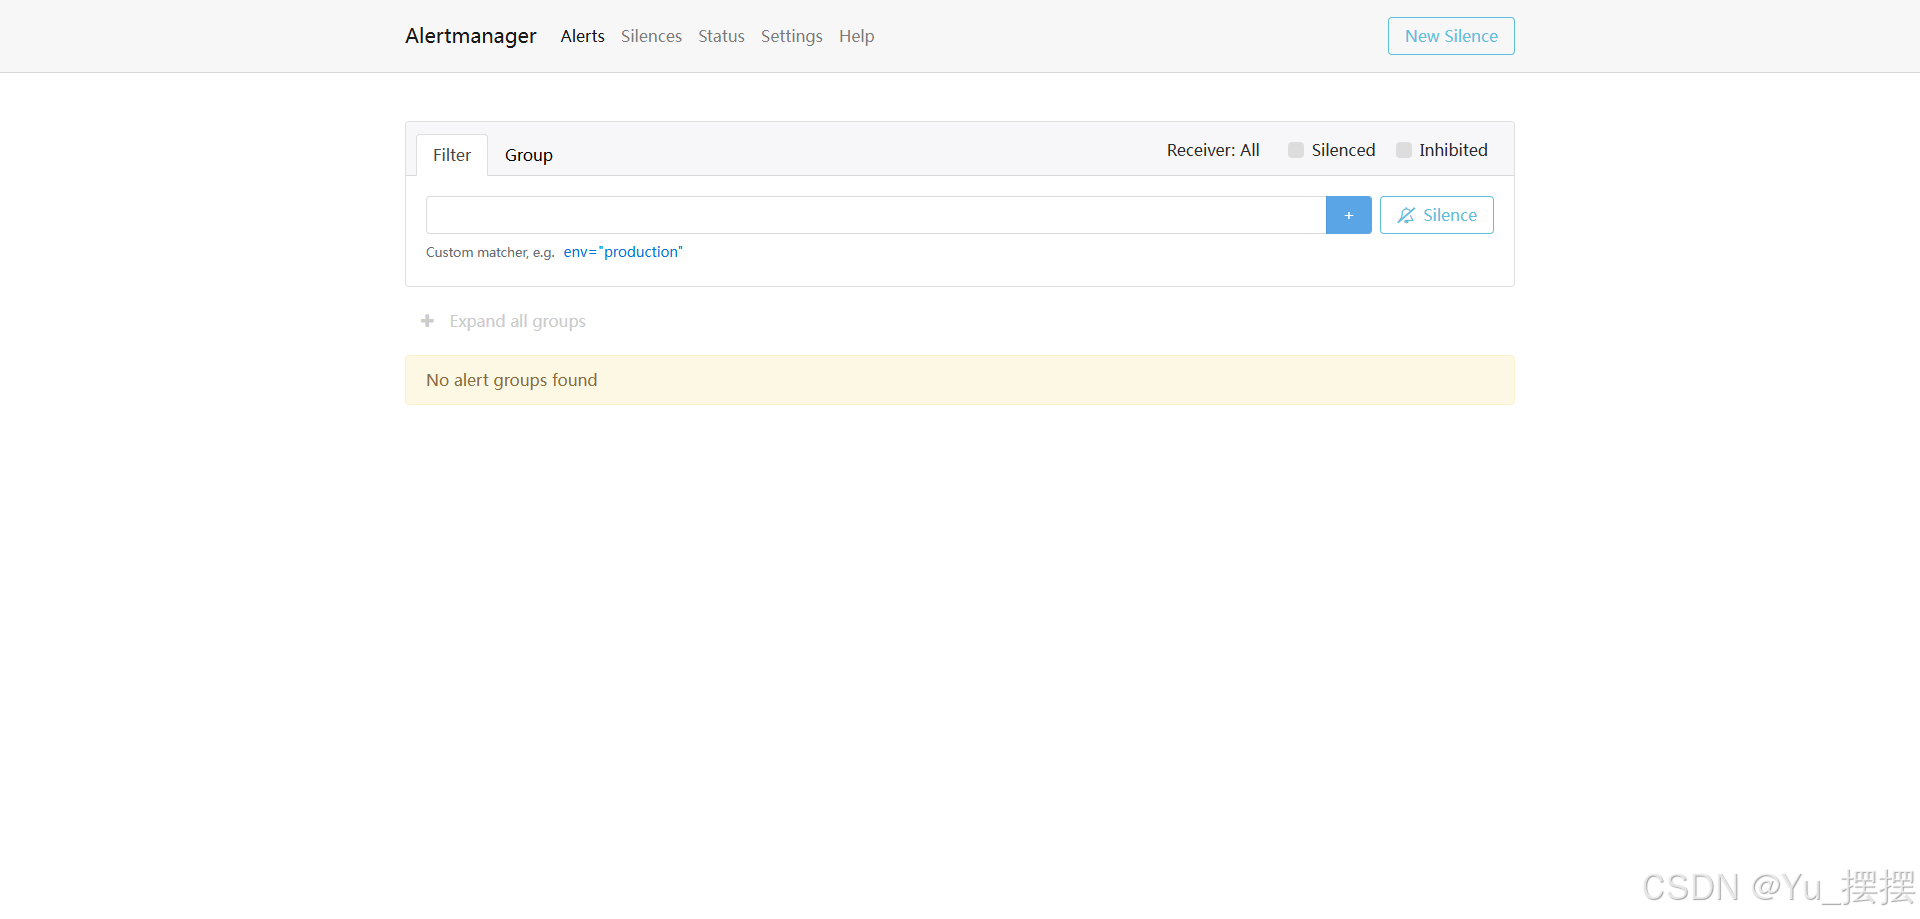
- 实现告警发送邮件需要修改安装目录下的配置文件alertmanager.yml,邮箱需要修改为自己的邮箱,授权码到QQ邮箱管理页获取,修改配置后重启alertmanager

yaml
global:
  resolve_timeout: 5m
  smtp_smarthost: 'smtp.qq.com:465'
  smtp_from: 'test@qq.com'
  smtp_auth_username: 'test@qq.com'
  smtp_auth_password: '****'    # 16位qq邮箱授权码作为密码
  smtp_require_tls: false

route:
  group_by: ['alertname']
  group_wait: 10s
  group_interval: 10s
  repeat_interval: 1h
  receiver: 'email'    # 选用邮箱告警发送

receivers:
- name: 'email'
  email_configs:
  - to: 'test@qq.com'

inhibit_rules:
  - source_match:
      severity: 'critical'
    target_match:
      severity: 'warning'
equal: ['alertname', 'dev', 'instance']- 和prometheus实现连通需要修改prometheus的配置prometheus.yml,完整配置如下
yaml
# my global config
global:
  scrape_interval: 15s # Set the scrape interval to every 15 seconds. Default is every 1 minute.
  evaluation_interval: 15s # Evaluate rules every 15 seconds. The default is every 1 minute.
  # scrape_timeout is set to the global default (10s).

# Alertmanager configuration
alerting:
  alertmanagers:
    - static_configs:
        - targets:
           - localhost:9093

# Load rules once and periodically evaluate them according to the global 'evaluation_interval'.
rule_files:
  - "rules/alert_rules.yml"
  # - "second_rules.yml"

# A scrape configuration containing exactly one endpoint to scrape:
# Here it's Prometheus itself.
scrape_configs:
  # The job name is added as a label `job=<job_name>` to any timeseries scraped from this config.
  - job_name: "prometheus"

    # metrics_path defaults to '/metrics'
    # scheme defaults to 'http'.

    static_configs:
      - targets: ["localhost:9090"]
       # The label name is added as a label `label_name=<label_value>` to any timeseries scraped from this config.
        labels:
          app: "prometheus"

  - job_name: "windows"

    static_configs:
      - targets: ["localhost:9182"]
        labels:
          app: "windows"

  - job_name: "alertmanager"
    scrape_interval: 5s

    static_configs:
- targets: ["localhost:9093"]- rule_files需要在prometheus安装目录下新建rules文件夹,再在文件夹下新建文件alert_rules.yml,输入以下配置,主要是设置告警的规则,当前设置的是90%,如果需要验证告警是否成功,可以修改为10%或者其他更低的数据,查看是否有告警消息,修改后重启prometheus:
yaml
groups:
  - name: WindowsHost
    rules:
      # CPU 告警
      - alert: WindowsCPUHigh
        expr: |
          100 * (1 - avg by (instance) (rate(windows_cpu_time_total{mode="idle"}[5m]))) > 90
        for: 5m
        labels:
          severity: warning
        annotations:
          summary: "Windows 主机 {{$labels.instance}}:CPU 使用率过高"
          description: "主机 {{$labels.instance}} 的平均 CPU 使用率为 {{ printf \"%.1f\" $value }}%,已超过阈值(90%),持续 1 分钟。请检查进程负载。"

      # 内存告警
      - alert: WindowsMemoryHigh
        expr: |
          (1 - windows_os_physical_memory_free_bytes / windows_cs_physical_memory_bytes) * 100 > 90
        for: 5m
        labels:
          severity: warning
        annotations:
          summary: "Windows 主机 {{$labels.instance}}:内存使用率过高"
          description: "主机 {{$labels.instance}} 的内存使用率为 {{ printf \"%.1f\" $value }}%,已超过阈值(90%)。可用内存可能不足。"

      # 磁盘告警
      - alert: WindowsDiskHigh
        expr: |
          100 - (
            windows_logical_disk_free_bytes{volume!~"HarddiskVolume.*"}
            * 100
            / windows_logical_disk_size_bytes{volume!~"HarddiskVolume.*"}
          ) > 90
        for: 5m
        labels:
          severity: warning
        annotations:
          summary: "Windows 主机 {{$labels.instance}}:磁盘 {{$labels.volume}} 使用率过高"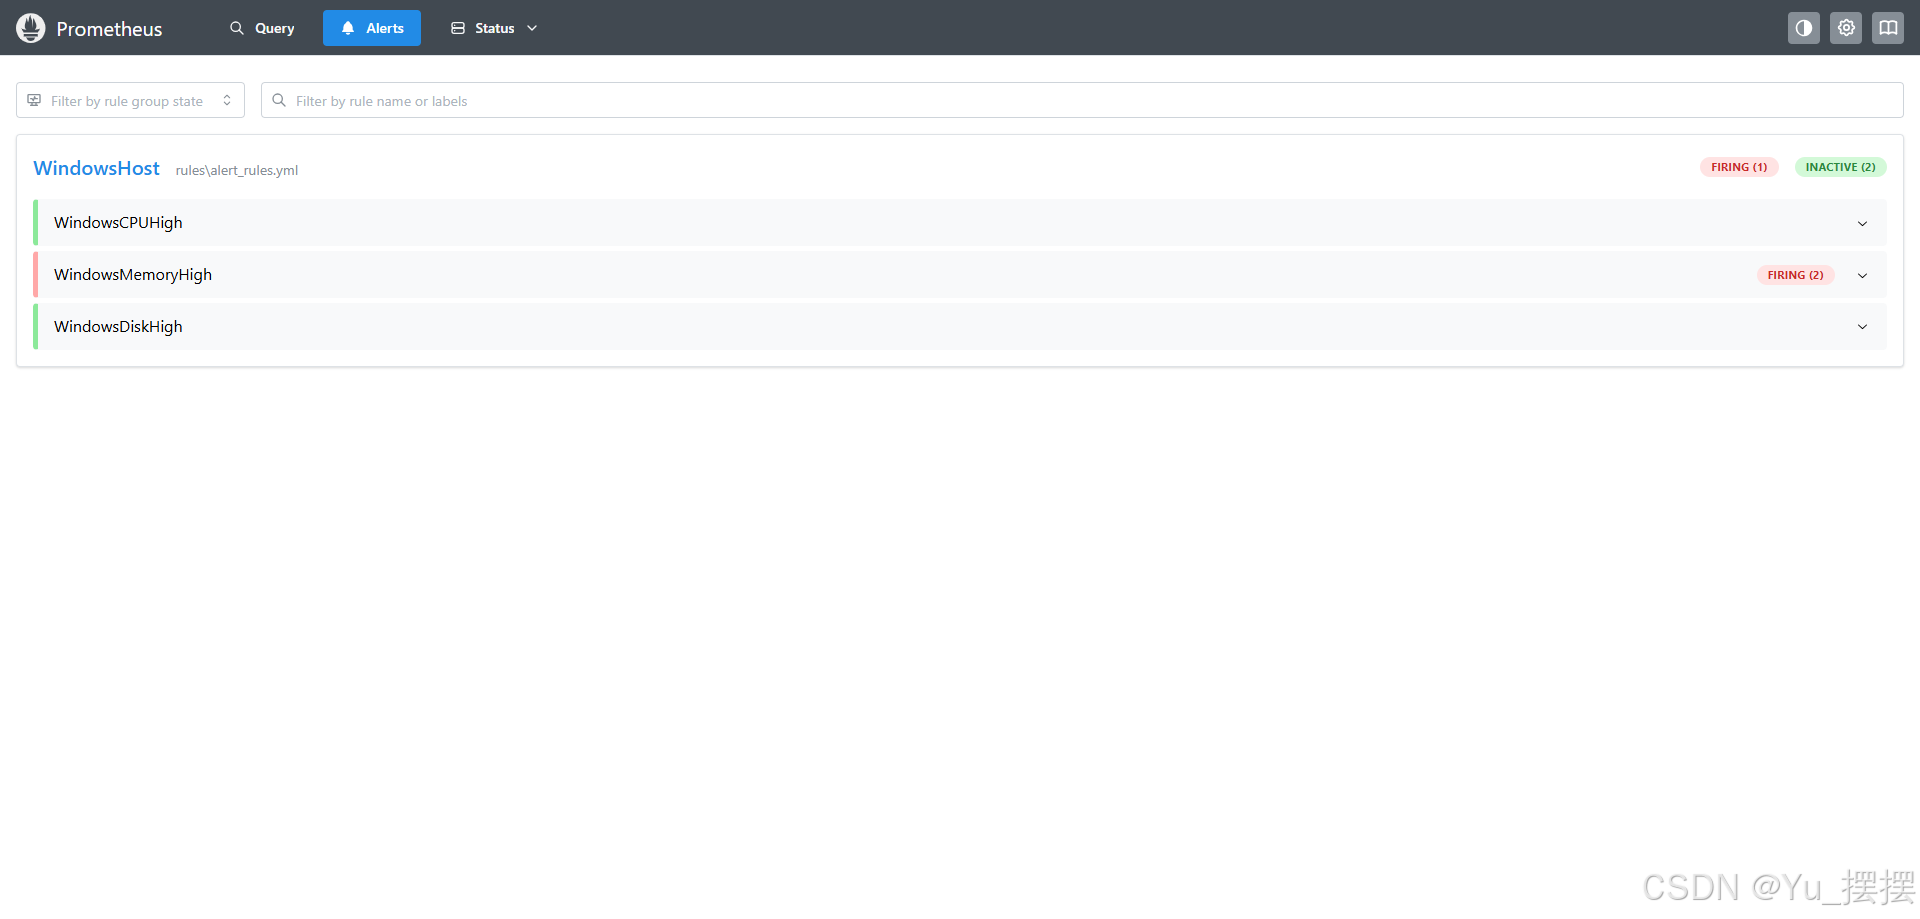
description: "主机 {{$labels.instance}} 的磁盘 {{$labels.volume}} 使用率为 {{ printf \"%.1f\" $value }}%,已超过阈值(90%)。剩余空间可能严重不足。"成功设置所有配置后,查看http://localhost:9090/alerts,可这里如果正确显示设置的规则,说明成功读取到rules,无告警状态是绿色,有告警会显示红色
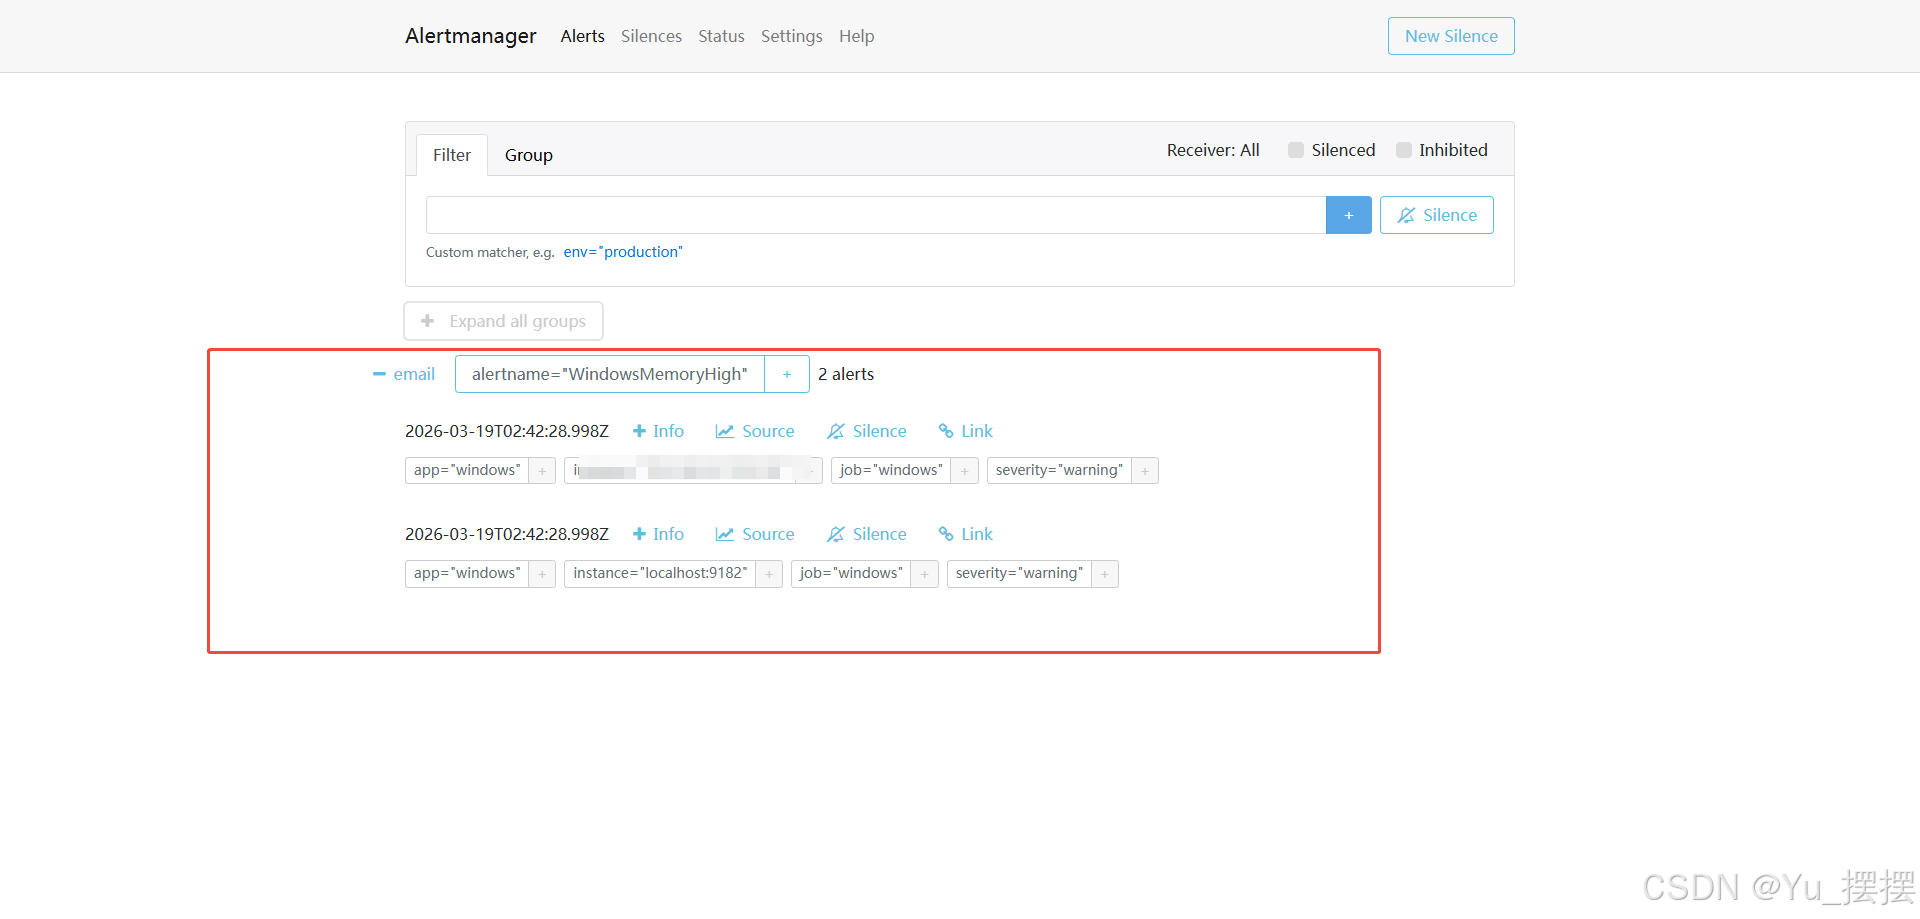
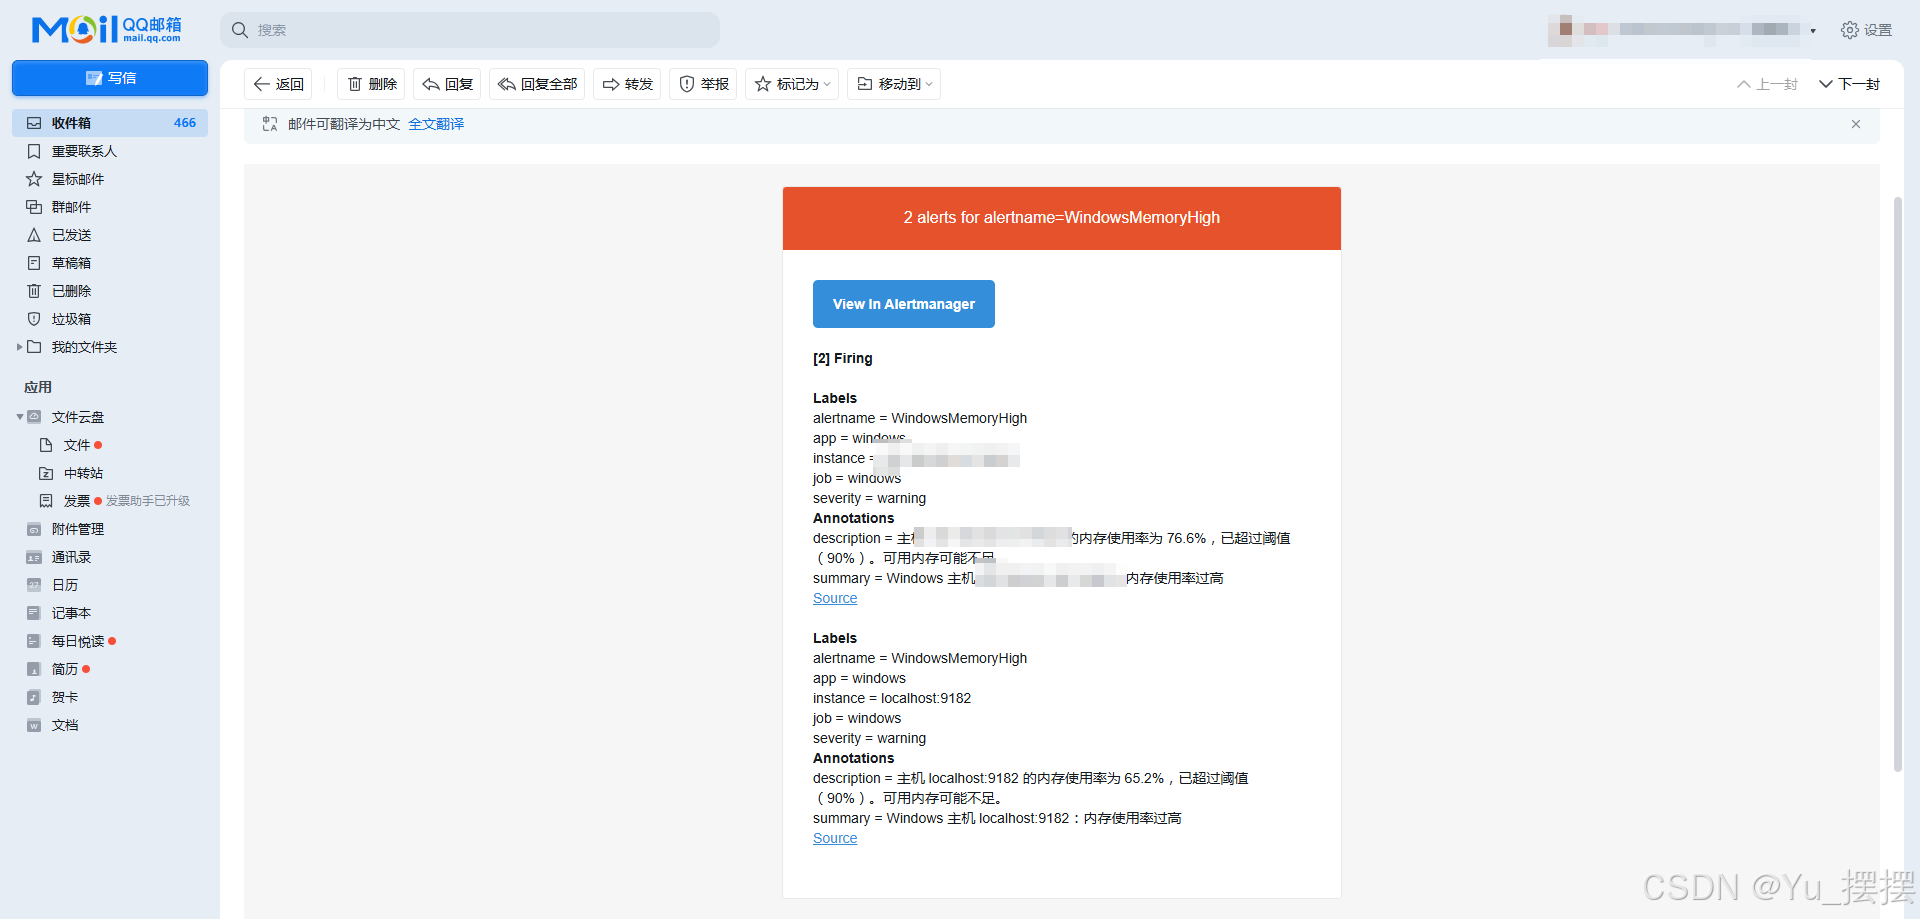
访问http://localhost:9093/#/alerts,可以看到alert是否成功收到告警消息并发送
其他
如果使用powershell在命令行使用以下命令启动,则不需要每次手动重启prometheus,使用命令Invoke-WebRequest -Uri "http://localhost:9090/-/reload" -Method POST就可以重载相关修改配置
powershell
Start-Process " E:\prometheus-3.5.1.windows-amd64\prometheus.exe" -ArgumentList "--config.file=prometheus.yml --web.enable-lifecycle --storage.tsdb.path=data" 参考文档:
记-Windows环境下Prometheus+alertmanager+windows_exporter+mtail监控部署提起网关日志
Windows监控:基于Prometheus+Grafana监控CPU、内存、磁盘、网络、GPU信息
对主机进行监控告警