前言
我一开始Filebeat 在 192.168.92.17 上,而 Docker 项目在 192.168.92.13 上,因此你不能直接在 Filebeat 配置中写 192.168.92.13 的本地路径,因为 Filebeat 只能读取运行它的机器上的本地文件系统。跨主机采集日志需要采用网络传输方式。
Filebeat 本身没有能力通过 IP 直接访问另一台机器的文件系统(除非挂载了远程文件系统如 NFS,但这不推荐)
你需要在日志产生的那台机器(192.168.92.13)上也部署一个日志收集代理,将日志发送到你的 Elastic Stack 所在机器(192.168.92.17)。通常有两种主流做法:
-
在 192.168.92.13 上安装 Filebeat(最简单)
2.在 192.168.92.13 上运行 Filebeat 容器(如果你喜欢容器化)
你完全可以用 RPM 包的方式在 192.168.92.13 上安装 Filebeat,来采集 Docker Compose 部署的应用日志。这样做不仅能和你现有的 RPM 部署的 ELK 生态无缝集成,管理上也是最方便的
这里是elasticsearch+logstash+kibana+filebeat的elk
1.elk监控springboot2+vue3+redis中的nginx
(1)安装基础软件
#配置rockylinux9.6的yum源
sed -e 's|^mirrorlist=|#mirrorlist=|g' \
    -e 's|^#baseurl=http://dl.rockylinux.org/$contentdir|baseurl=https://mirrors.aliyun.com/rockylinux|g' \
    -i.bak \
    /etc/yum.repos.d/rocky*.repo
dnf makecache

yum install wget vim net-tools -y
selinux、firewall关闭、设置时区
timedatectl set-timezone Asia/Shanghai
systemctl stop firewalld
systemctl disable firewalld
setenforce 0
vim /etc/selinux/config
(2)安装filebeat
[root@filebeat01 ~]# wget https://artifacts.elastic.co/downloads/beats/filebeat/filebeat-7.17.10-x86_64.rpm
[root@filebeat01 ~]# ls
anaconda-ks.cfg  filebeat-7.17.10-x86_64.rpm
[root@filebeat01 ~]# yum -y install filebeat-7.17.10-x86_64.rpm
(3)修改配置文件 /etc/filebeat/filebeat.yml(192.168.92.13),设置日志输入(采集 Docker 容器日志)和输出(发送到 192.168.92.14 的 Elasticsearch)
# 备份原配置文件
cp /etc/filebeat/filebeat.yml /etc/filebeat/filebeat.yml.bak
# 编辑配置文件
vi /etc/filebeat/filebeat.yml
#注释掉下面这里
#filebeat.inputs:
#- type: filestream
# id: my-filestream-id
# enabled: false
# paths:
# - /var/log/*.log
#写入
[root@localhost filebeat]# cat filebeat.yml
filebeat.inputs:
- type: container #输入类型,专门用于采集 Docker 容器日志
enabled: true #启用状态,true=启用,false=禁用
paths: #Docker 容器日志的绝对路径
- "/var/lib/docker/containers/868ec03b41ca90261c5f3bbea28dfb6b8af0f1b856b1e1de1f95dd3e9101fe05/868ec03b41ca90261c5f3bbea28dfb6b8af0f1b856b1e1de1f95dd3e9101fe05-json.log"
json.keys_under_root: true #JSON 解析,将 JSON 字段提升到根级别(便于查询)
json.add_error_key: true #错误标记 解析失败时添加 error 字段
processors:
- add_docker_metadata: #处理器,自动添加容器元数据(容器名、镜像名等)
host: "unix:///var/run/docker.sock"
output.elasticsearch:
hosts: ["192.168.92.14:9200"]
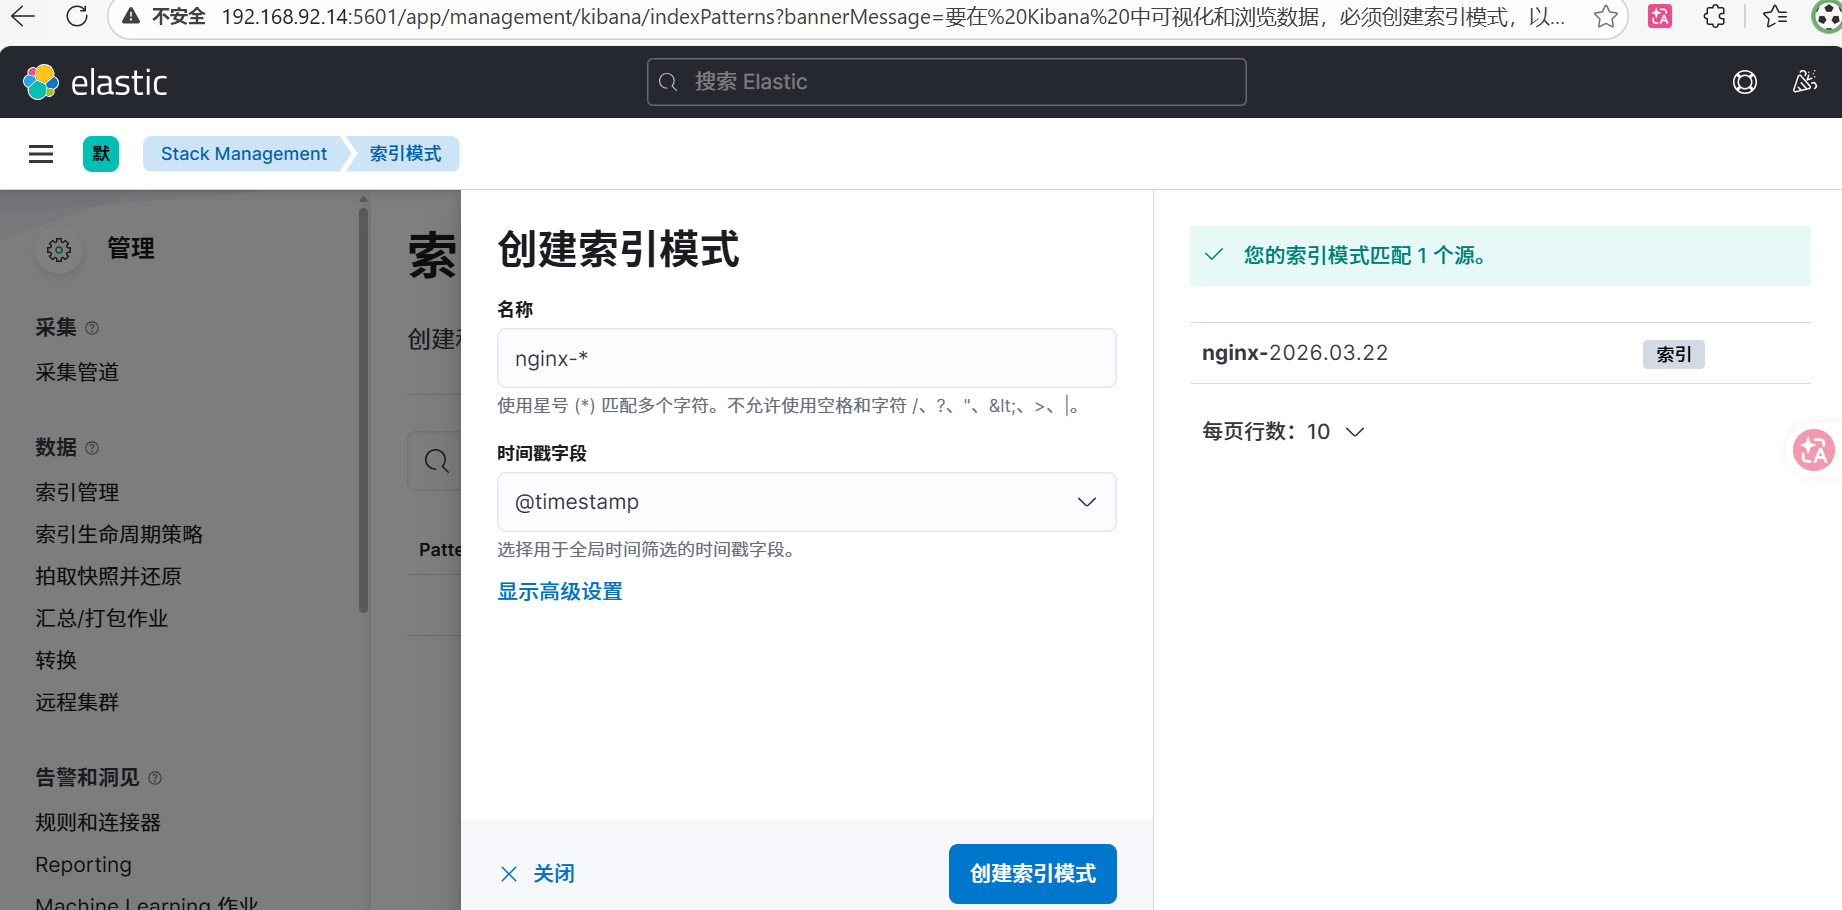
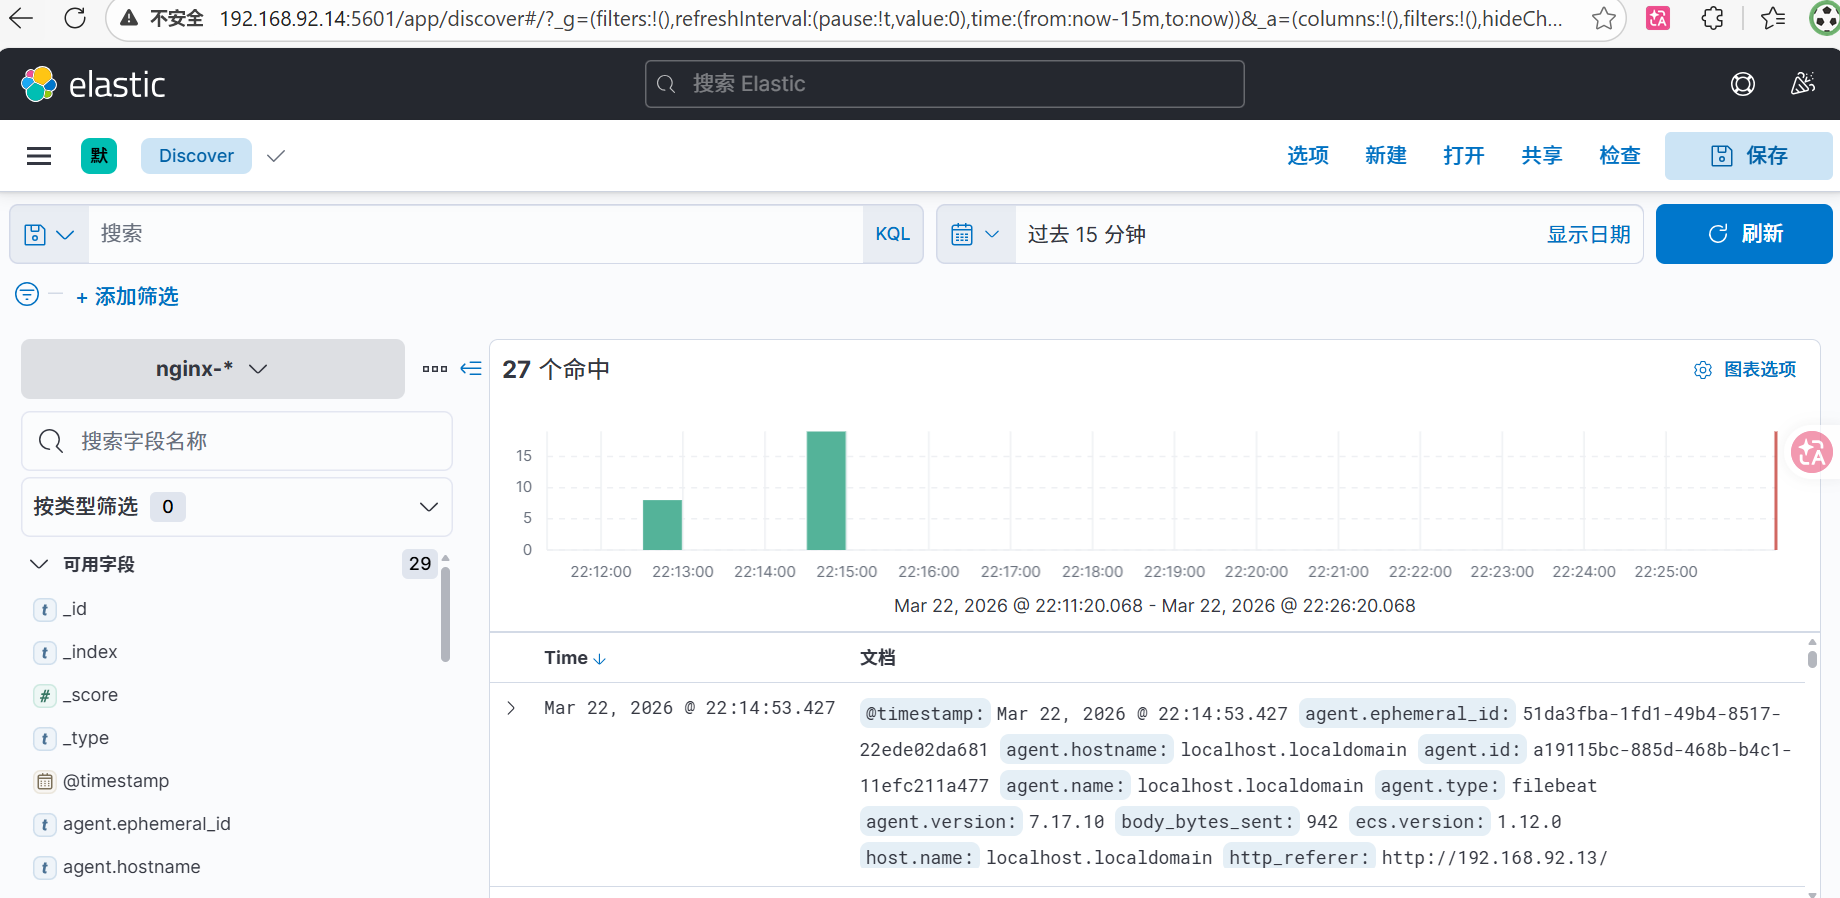
index: "nginx-%{+yyyy.MM.dd}"
setup.template.name: "nginx"
setup.template.pattern: "nginx-*"
setup.template.enabled: true
setup.ilm.enabled: false
filebeat.config.modules:
path: ${path.config}/modules.d/*.yml
reload.enabled: false
logging.level: info
# 如需认证,取消注释并填写
# username: "elastic"
# password: "your_password"修改192.168.92.13的nginx.conf,nginx配置已经正确设置了 JSON 格式日志。
[root@localhost nginx]# cat nginx.conf
worker_processes  1;

# 错误日志输出到 stderr(Docker 会捕获)
error_log  /dev/stderr warn;

events {
    worker_connections  1024;
}

http {
    include       mime.types;
    default_type  application/octet-stream;
    sendfile        on;
    keepalive_timeout  65;

    # JSON 日志格式
    log_format  main_json escape=json '{'
        '"time_local":"$time_iso8601",'
        '"remote_addr":"$remote_addr",'
        '"request":"$request",'
        '"status":$status,'
        '"body_bytes_sent":$body_bytes_sent,'
        '"request_time":$request_time,'
        '"http_referer":"$http_referer",'
        '"http_user_agent":"$http_user_agent",'
        '"http_x_forwarded_for":"$http_x_forwarded_for"'
    '}';

    # 访问日志输出到 stdout(JSON 格式)
    access_log  /dev/stdout  main_json;

    server {
        listen  80;
        server_name  192.168.92.13 localhost;

        location / {
            root   /usr/share/nginx/html;
            index  index.html index.htm;
            try_files $uri $uri/ /index.html;
        }

        location /api/ {
            add_header 'Access-Control-Allow-Origin' '$http_origin' always;
            add_header 'Access-Control-Allow-Methods' 'GET, POST, OPTIONS, PUT, DELETE, PATCH' always;
            add_header 'Access-Control-Allow-Headers' 'DNT,User-Agent,X-Requested-With,If-Modified-Since,Cache-Control,Content-Type,Range,Authorization' always;
            add_header 'Access-Control-Allow-Credentials' 'true' always;

            if ($request_method = 'OPTIONS') {
                add_header 'Access-Control-Max-Age' 1728000;
                add_header 'Content-Type' 'text/plain; charset=utf-8';
                add_header 'Content-Length' 0;
                return 204;
            }

            proxy_pass http://springboot:8080/;
            proxy_set_header Host $host;
            proxy_set_header X-Real-IP $remote_addr;
            proxy_set_header X-Forwarded-For $proxy_add_x_forwarded_for;
            proxy_set_header X-Forwarded-Proto $scheme;
            proxy_connect_timeout 75s;
            proxy_read_timeout 300s;
        }

        location /actuator/ {
            proxy_pass http://springboot:8080/actuator/;
            proxy_set_header Host $host;
            proxy_set_header X-Real-IP $remote_addr;
            proxy_set_header X-Forwarded-For $proxy_add_x_forwarded_for;
            proxy_set_header X-Forwarded-Proto $scheme;
            proxy_connect_timeout 75s;
            proxy_read_timeout 300s;
        }

        location = /stub_status {
            stub_status on;
            access_log off;
            allow all;
            default_type text/plain;
            charset utf-8;
            add_header Cache-Control "no-store, no-cache, must-revalidate";
            add_header Pragma "no-cache";
            add_header Expires "0";
            add_header X-Content-Type-Options "nosniff";
            add_header X-Frame-Options "DENY";
            add_header X-XSS-Protection "1; mode=block";
            add_header Content-Security-Policy "default-src 'self'; script-src 'none'";
        }

        error_page   500 502 503 504  /50x.html;
        location = /50x.html {
            root   html;
        }
    }
}
192.168.92.13的docker-compose.yml内的nginx内容
nginx:
image: nginx:alpine
container_name: nginx
restart: unless-stopped
ports:
- "80:80" # 对外只暴露 80 端口
volumes:
- ./nginx/nginx.conf:/etc/nginx/nginx.conf:ro # Nginx 配置
- ./nginx/dist:/usr/share/nginx/html:ro # 前端静态文件
depends_on:
- springboot
networks:
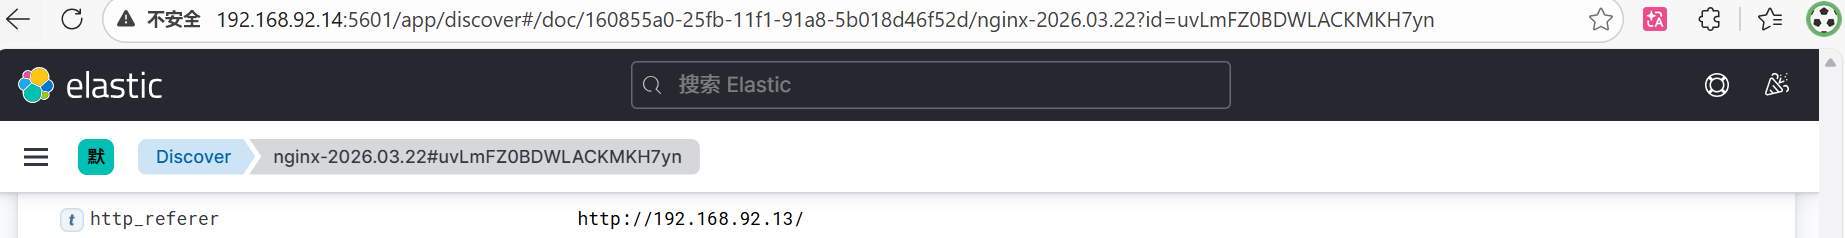
- app-networknginx 输出 JSON 到 stdout → Docker 将其包装成外层 JSON 并写入宿主机文件 → Filebeat 读取这些文件 → 发送到 Elasticsearch→ Kibana
Elasticsearch 和 Kibana 之间是 Kibana 主动从 Elasticsearch 拉取数据 的关系,而不是 Elasticsearch 主动推送。
这里没有经过logstash。
-
Elasticsearch 本身就是一个高性能的存储和搜索引擎,可以直接接收 Beats 系列采集器(如 Filebeat、Metricbeat)发送的数据。
-
配置简单 :只需在 Filebeat 的
output.elasticsearch中指定 ES 地址,即可直接写入。 -
适合日志量不大、处理逻辑不复杂的场景:如果你的需求只是采集、解析 JSON 日志并存储,不需要在中间进行复杂的字段转换、过滤或路由,那么直接输出到 ES 是最轻量的方式。
[root@es01 ~]# cat /etc/kibana/kibana.yml
elasticsearch.hosts: ["http://localhost:9200"] #我的kibana和elasticsearch是安装到了同一台宿主机
elk监控springboot2+vue3+redis中的nginx完毕!
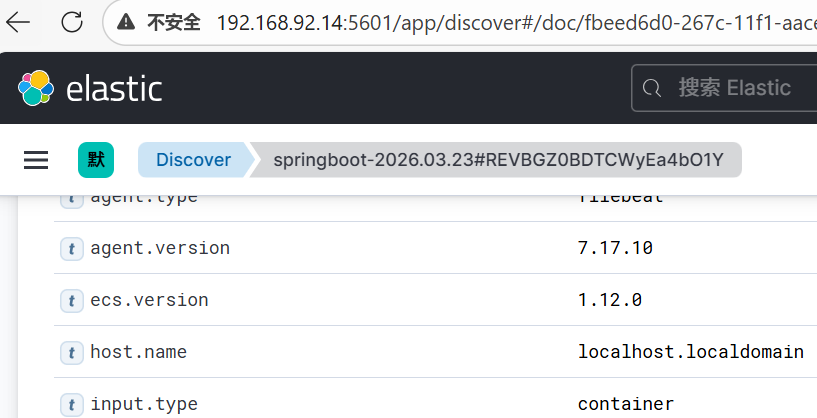
2.elk监控springboot2+vue3+redis中的springboot2
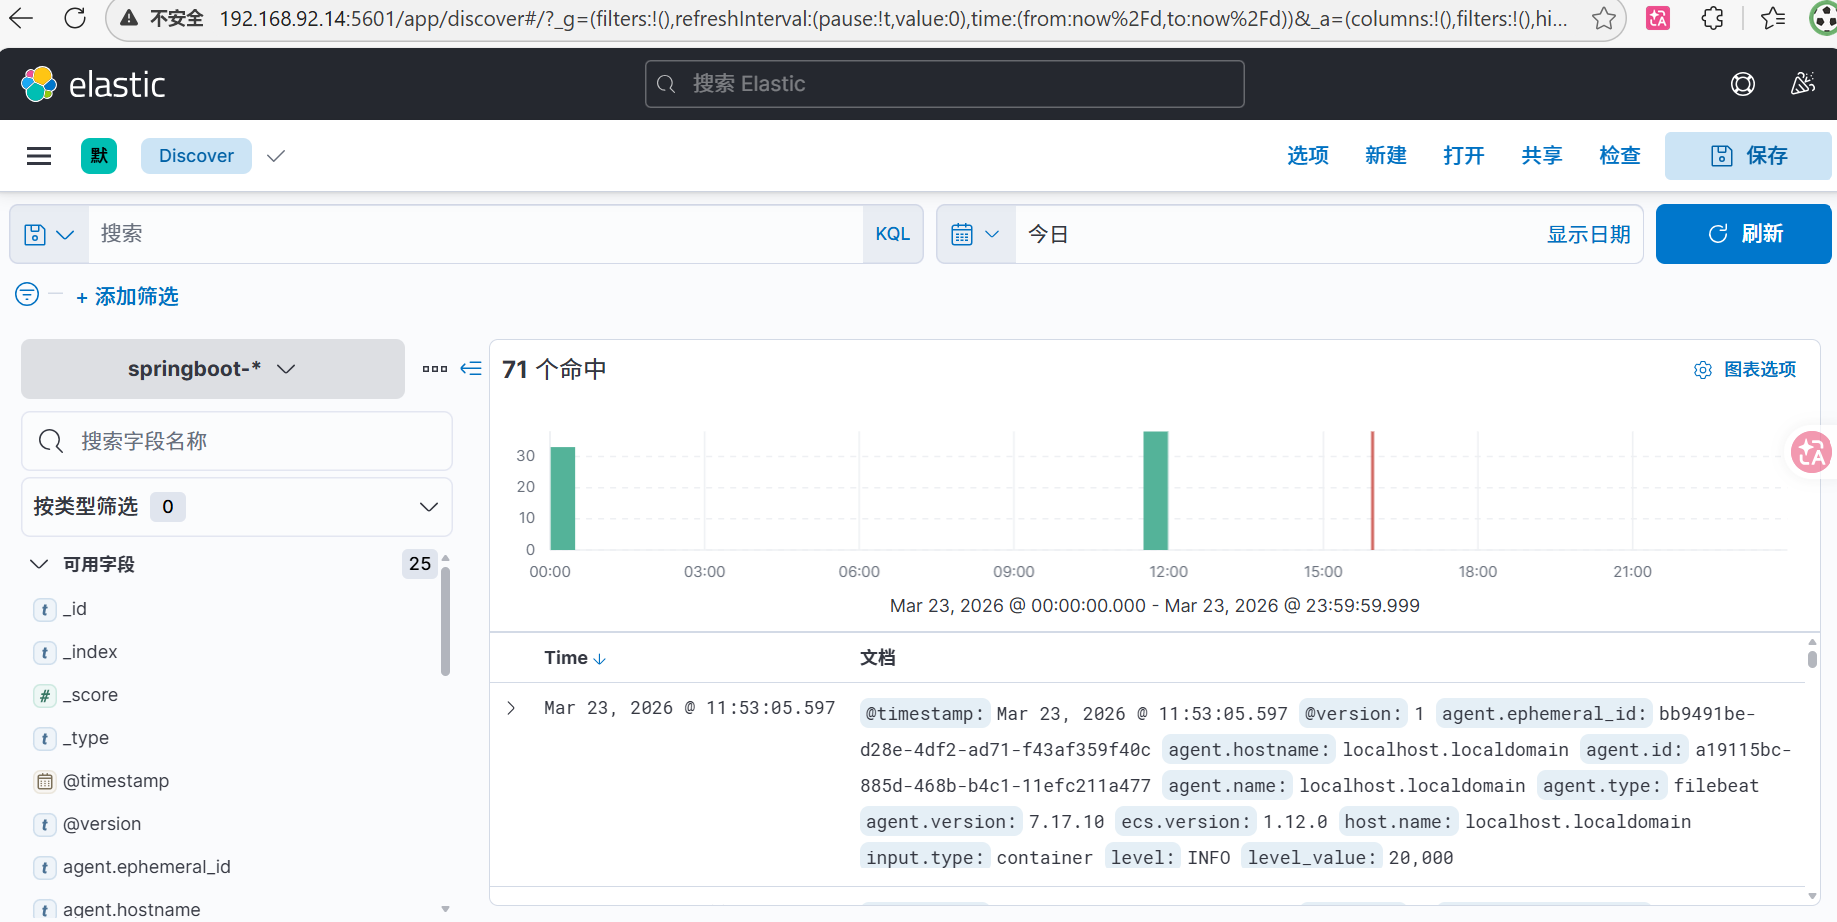
SpringBoot 输出日志到 stdout → Docker 捕获 → Filebeat 读取 → ES(这里也没有经过logstash,日志量少)
你已经有一个 Filebeat(192.168.92.13) 在采集所有容器日志 ,完全可以复用这个 Filebeat 来采集 SpringBoot 容器的 stdout,不需要额外部署 Logstash。这样架构更简单,与 Nginx 的采集方式完全一致。
让springboot的输出格式为json
1.添加依赖
<dependency>
    <groupId>net.logstash.logback</groupId>
    <artifactId>logstash-logback-encoder</artifactId>
    <version>6.6</version>
</dependency>
2.配置 logback-spring.xml
<?xml version="1.0" encoding="UTF-8"?>
<configuration debug="true">
    <!-- 将日志以 JSON 格式输出到控制台 -->
    <appender name="JSON_CONSOLE" class="ch.qos.logback.core.ConsoleAppender">
        <encoder class="net.logstash.logback.encoder.LogstashEncoder"/>
    </appender>

    <root level="INFO">
        <appender-ref ref="JSON_CONSOLE"/>
    </root>
</configuration>iguration>
重新打包,重新上传jar包
[root@localhost backend]# ls
Dockerfile  Springbootdemo-0.0.1-SNAPSHOT.jar
[root@localhost backend]# rm -rf Springbootdemo-0.0.1-SNAPSHOT.jar
[root@localhost backend]# ls
Dockerfile
[root@localhost backend]# ls
Dockerfile  Springbootdemo-0.0.1-SNAPSHOT.jar
[root@localhost backend]#
在 /data/docker-compose/ 目录下执行:
docker-compose build springboot   # 重新构建镜像
docker-compose up -d springboot   # 重启容器
docker logs springboot #查看容器日志,应该看到每行都是 JSON 格式的对象。
  .   ____          _            __ _ _
 /\\ / ___'_ __ _ _(_)_ __  __ _ \ \ \ \
( ( )\___ | '_ | '_| | '_ \/ _` | \ \ \ \
 \\/  ___)| |_)| | | | | || (_| |  ) ) ) )
  '  |____| .__|_| |_|_| |_\__, | / / / /
 =========|_|==============|___/=/_/_/_/
 :: Spring Boot ::               (v2.6.13)

{"@timestamp":"2026-03-22T16:02:39.644Z","@version":"1","message":"HV000001: Hibernate Validator 6.2.5.Final","logger_name":"org.hibernate.validator.internal.util.Version","thread_name":"background-preinit","level":"INFO","level_value":20000}
{"@timestamp":"2026-03-22T16:02:39.678Z","@version":"1","message":"Starting Springbootdemo2466Application using Java 17.0.18 on fff33868a859 with PID 1 (/app.jar started by root in /)","logger_name":"com.chichi.Springbootdemo2466Application","thread_name":"main","level":"INFO","level_value":20000}
{"@timestamp":"2026-03-22T16:02:39.680Z","@version":"1","message":"No active profile set, falling back to 1 default profile: \"default\"","logger_name":"com.chichi.Springbootdemo2466Application","thread_name":"main","level":"INFO","level_value":20000}
修改/etc/filebeat/filebeat.yml的配置文件(192.168.92.13)
[root@localhost filebeat]# cat filebeat.yml
setup.ilm.enabled: false
setup.template.enabled: false

filebeat.inputs:
# nginx 容器
- type: container
  enabled: true
  paths:
    - "/var/lib/docker/containers/868ec03b41ca90261c5f3bbea28dfb6b8af0f1b856b1e1de1f95dd3e9101fe05/868ec03b41ca90261c5f3bbea28dfb6b8af0f1b856b1e1de1f95dd3e9101fe05-json.log"
  json.keys_under_root: true
  json.add_error_key: true
  processors:
    - add_docker_metadata:
        host: "unix:///var/run/docker.sock"

# springboot 容器
- type: container
  enabled: true
  paths:
    - "/var/lib/docker/containers/fff33868a859c200f66d2aeda0b43b15000477c50ae32991a1b2f44d2d73fae3/fff33868a859c200f66d2aeda0b43b15000477c50ae32991a1b2f44d2d73fae3-json.log"
  json.keys_under_root: true
  json.add_error_key: true
  processors:
    - add_docker_metadata:
        host: "unix:///var/run/docker.sock"

output.elasticsearch:
  hosts: ["192.168.92.14:9200"]
  indices:
    - index: "nginx-%{+yyyy.MM.dd}"
      when.contains:
        log.file.path: "868ec03b41ca90261c5f3bbea28dfb6b8af0f1b856b1e1de1f95dd3e9101fe05"
    - index: "springboot-%{+yyyy.MM.dd}"
      when.contains:
        log.file.path: "fff33868a859c200f66d2aeda0b43b15000477c50ae32991a1b2f44d2d73fae3"
    - index: "default-logs-%{+yyyy.MM.dd}"
[root@localhost filebeat]#
确认 SpringBoot 容器的完整长 ID,确认 nginx 容器的完整长 ID
docker inspect springboot --format '{{.Id}}'
docker inspect nginx --format '{{.Id}}'
[root@localhost ~]# hostname
localhost.localdomain
[root@localhost ~]# hostname -I
192.168.92.13 172.18.0.1 172.17.0.1 172.19.0.1
elk监控springboot2+vue3+redis中的springboot2完毕!
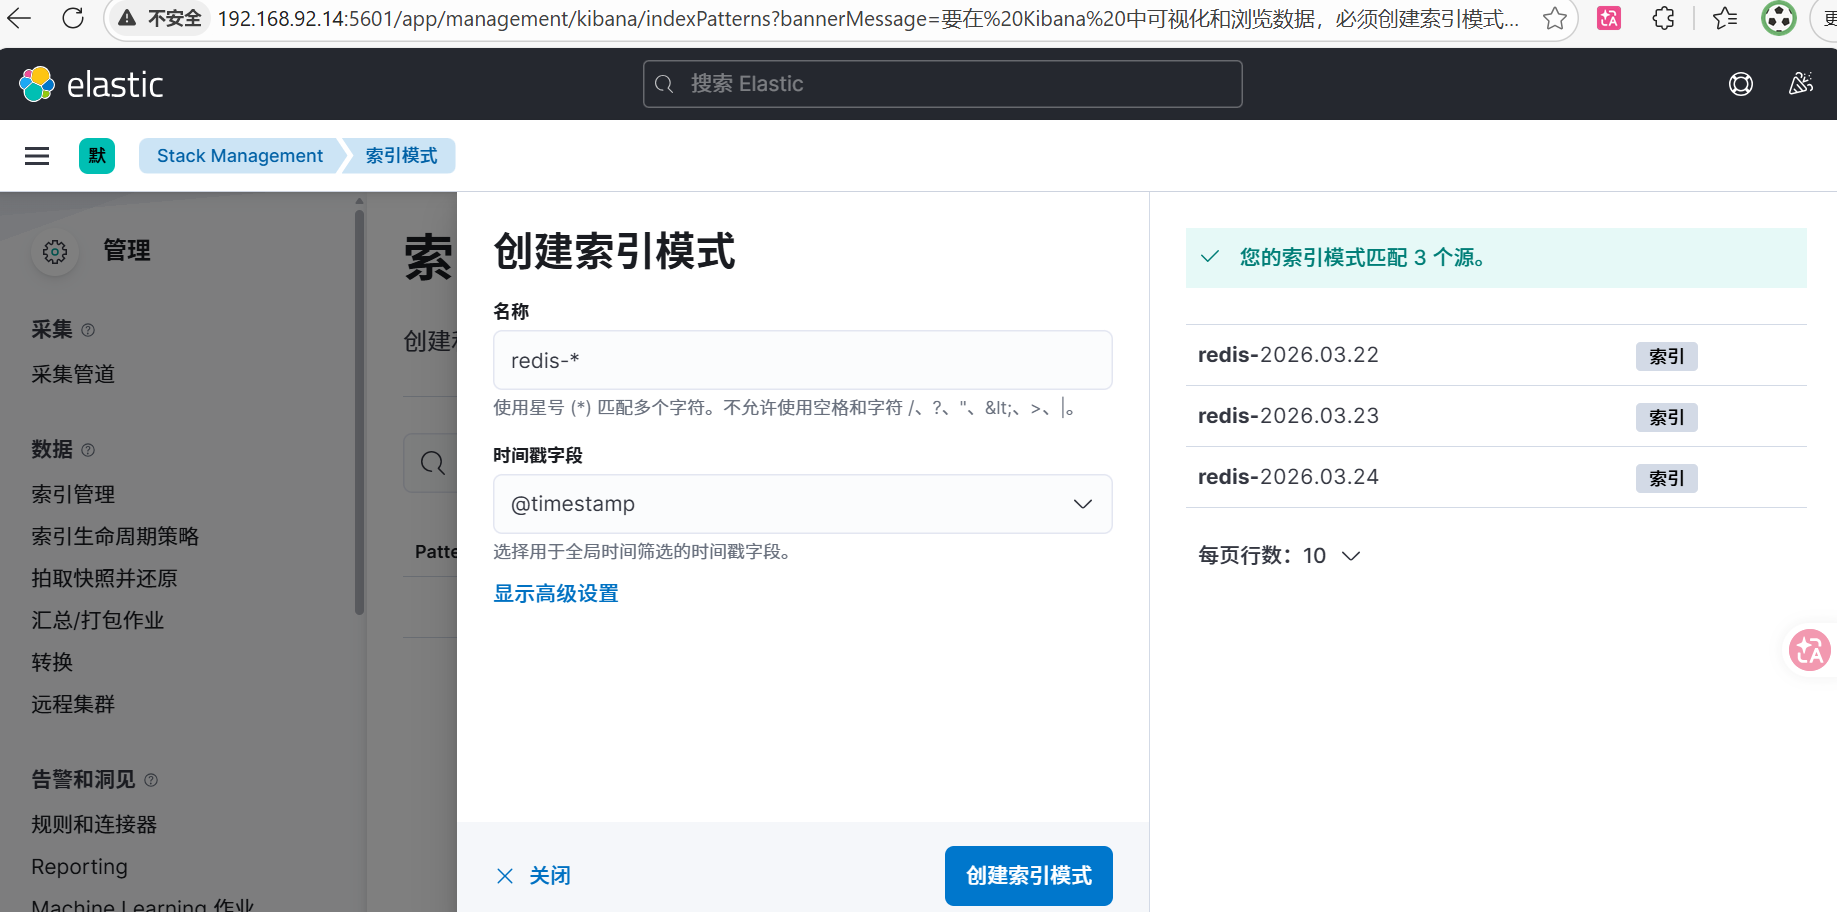
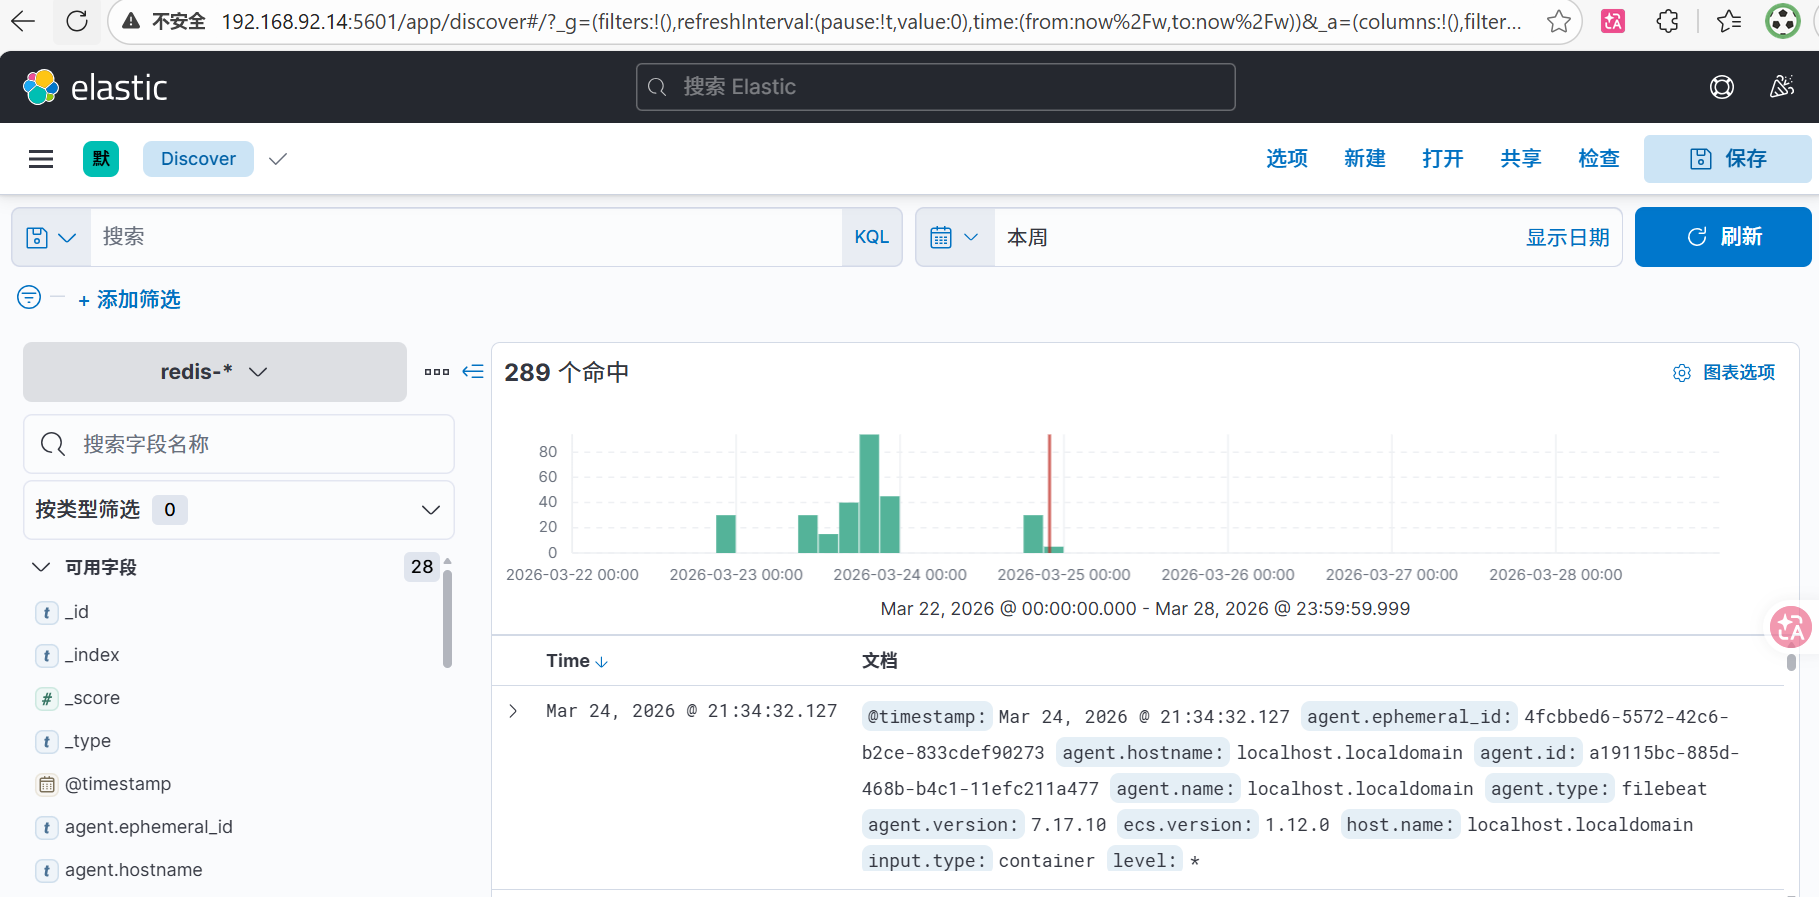
3.elk监控springboot2+vue3+redis中的redis
查看 Redis 容器 ID 及日志路径
docker inspect redis --format '{{.Id}}'修改/etc/filebeat/filebeat.yml的配置文件(192.168.92.13)
# /etc/filebeat/filebeat.yml
setup.ilm.enabled: false
setup.template.enabled: false

filebeat.inputs:
  # nginx 容器
  - type: container
    enabled: true
    paths:
      - "/var/lib/docker/containers/868ec03b41ca90261c5f3bbea28dfb6b8af0f1b856b1e1de1f95dd3e9101fe05/868ec03b41ca90261c5f3bbea28dfb6b8af0f1b856b1e1de1f95dd3e9101fe05-json.log"
    json.keys_under_root: true
    json.add_error_key: true
    processors:
      - add_docker_metadata:
          host: "unix:///var/run/docker.sock"

  # springboot 容器
  - type: container
    enabled: true
    paths:
      - "/var/lib/docker/containers/fff33868a859c200f66d2aeda0b43b15000477c50ae32991a1b2f44d2d73fae3/fff33868a859c200f66d2aeda0b43b15000477c50ae32991a1b2f44d2d73fae3-json.log"
    json.keys_under_root: true
    json.add_error_key: true
    processors:
      - add_docker_metadata:
          host: "unix:///var/run/docker.sock"

  # Redis 容器
  # 修复:改为 container 类型,且不要配置 json.keys_under_root (因为 Redis 日志内容是纯文本)
  - type: container
    enabled: true
    paths:
      - "/var/lib/docker/containers/7ebfd230a3c82736b87585ab4c86eda33efc15c867c867cb4e81f7778a86178f/7ebfd230a3c82736b87585ab4c86eda33efc15c867c867cb4e81f7778a86178f-json.log"
    processors:
      - add_docker_metadata:
          host: "unix:///var/run/docker.sock"

output.elasticsearch:
  hosts: ["192.168.92.14:9200"]
  # 索引路由保持不变
  indices:
    - index: "nginx-%{+yyyy.MM.dd}"
      when.contains:
        log.file.path: "868ec03b41ca90261c5f3bbea28dfb6b8af0f1b856b1e1de1f95dd3e9101fe05"
    - index: "springboot-%{+yyyy.MM.dd}"
      when.contains:
        log.file.path: "fff33868a859c200f66d2aeda0b43b15000477c50ae32991a1b2f44d2d73fae3"
    - index: "redis-%{+yyyy.MM.dd}"
      when.contains:
        log.file.path: "7ebfd230a3c82736b87585ab4c86eda33efc15c867c867cb4e81f7778a86178f"
    - index: "default-logs-%{+yyyy.MM.dd}"

  # 修复:Pipeline 必须单独配置在 pipelines 块下
  pipelines:
    - pipeline: "redis-grok-pipeline"
      when.contains:
        log.file.path: "7ebfd230a3c82736b87585ab4c86eda33efc15c867c867cb4e81f7778a86178f"
redis-grok-pipeline(采集管道,在kibana页面192.168.92.14:5601中配置)
描述
Parse Redis log format
处理器
[
{
"grok": {
"field": "message",
"patterns": [
"%{NUMBER:pid}:%{WORD:role} %{MONTHDAY:day} %{MONTH:month} %{YEAR:year} %{TIME:time} %{DATA:level} %{GREEDYDATA:message}"
],
"ignore_missing": true
}
},
{
"script": {
"lang": "painless",
"source": "if (ctx.day != null) { ctx.redis_timestamp = ctx.day + ' ' + ctx.month + ' ' + ctx.year + ' ' + ctx.time; } ctx.service = 'redis';"
}
},
{
"date": {
"field": "redis_timestamp",
"formats": [
"dd MMM yyyy HH:mm:ss.SSS"
],
"target_field": "@timestamp",
"ignore_failure": true
}
},
{
"remove": {
"field": [
"day",
"month",
"year",
"time",
"redis_timestamp"
],
"ignore_failure": true
}
}
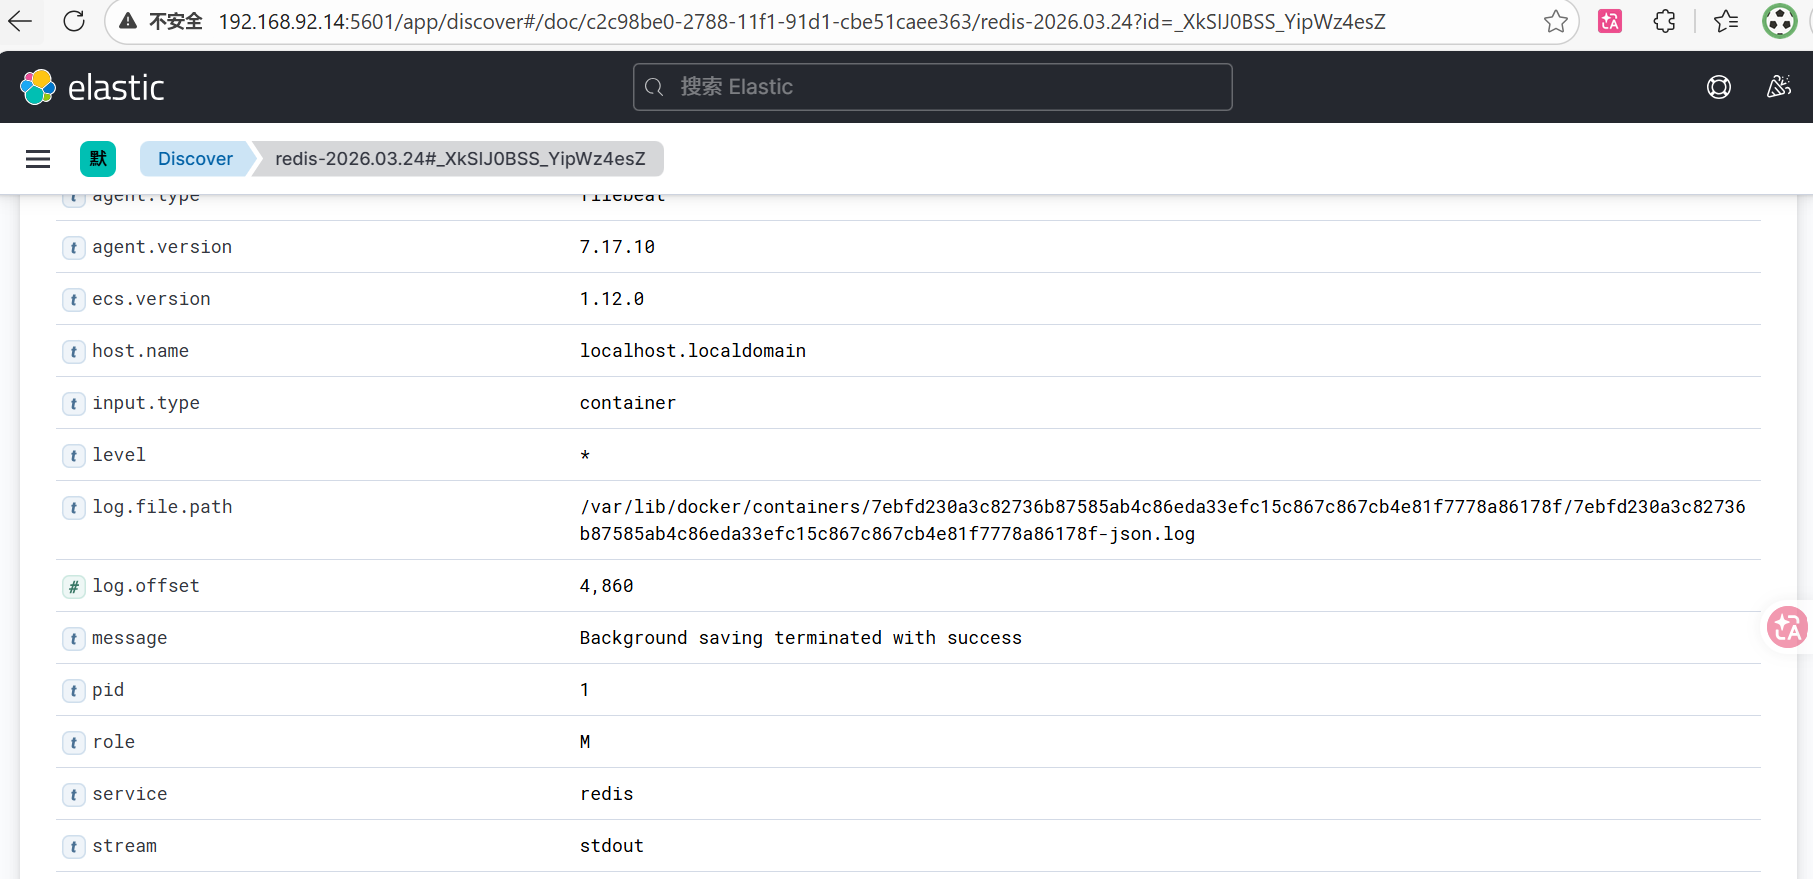
]Redis 不支持原生 JSON 日志,因此通过 Filebeat + Elasticsearch Ingest Pipeline 使用 Grok 对日志进行解析,实现结构化存储,从而统一与 Spring Boot 和 Nginx 的 JSON 日志格式。
你踩了一个经典 ELK 坑: ❌ 错误路径 Redis 日志 → 被当 JSON 解析 → 报错 ✅ 正确路径 Redis 日志 → 当字符串 → pipeline 解析 → 结构化
这里是Redis:纯文本日志 → Ingest Pipeline 解析(没有经过logstash,项目很轻量,主要是一开始nginx和springboot也没有用)
测试语句
[root@localhost filebeat]# systemctl stop filebeat
[root@localhost filebeat]# rm -rf /var/lib/filebeat/registry
[root@localhost filebeat]# systemctl start filebeatdocker exec redis redis-cli ping
[root@localhost filebeat]# docker exec redis redis-cli ping
PONG
[root@localhost filebeat]# docker logs redis --tail 5
1:M 24 Mar 2026 13:34:32.017 * 1 changes in 3600 seconds. Saving...
1:M 24 Mar 2026 13:34:32.026 * Background saving started by pid 46
46:C 24 Mar 2026 13:34:32.033 * DB saved on disk
46:C 24 Mar 2026 13:34:32.034 * RDB: 0 MB of memory used by copy-on-write
1:M 24 Mar 2026 13:34:32.127 * Background saving terminated with success
[root@localhost filebeat]# "192.168.92.14:9200/redis-*/_search?size=1&sort=@timestamp:desc&pretty" | jq '.hits.hits[0]._source'
{
  "agent": {
    "hostname": "localhost.localdomain",
    "name": "localhost.localdomain",
    "id": "a19115bc-885d-468b-b4c1-11efc211a477",
    "type": "filebeat",
    "ephemeral_id": "4fcbbed6-5572-42c6-b2ce-833cdef90273",
    "version": "7.17.10"
  },
  "role": "M",
  "log": {
    "file": {
      "path": "/var/lib/docker/containers/7ebfd230a3c82736b87585ab4c86eda33efc15c867c867cb4e81f7778a86178f/7ebfd230a3c82736b87585ab4c86eda33efc15c867c867cb4e81f7778a86178f-json.log"
    },
    "offset": 4860
  },
  "level": "*",
  "pid": "1",
  "message": "Background saving terminated with success",
  "input": {
    "type": "container"
  },
  "@timestamp": "2026-03-24T13:34:32.127Z",
  "ecs": {
    "version": "1.12.0"
  },
  "stream": "stdout",
  "service": "redis",
  "host": {
    "name": "localhost.localdomain"
  }
}
elk监控springboot2+vue3+redis中的redis完毕!
4.elk监控springboot2+vue3+redis中的mysql
查看 mysql 容器 ID 及日志路径
docker inspect mysql --format '{{.Id}}'在kibana中创建mysql的解析管道(ingest pipeline)
在kibana dev tool(192.168.92.12:5601)中执行一下命令,创建mysql-grok-pipeline
PUT _ingest/pipeline/mysql-grok-pipeline
{
  "description": "Parse Docker MySQL error logs",
  "processors": [
    {
      "grok": {
        "field": "message",
        "patterns": [
          "%{TIMESTAMP_ISO8601:mysql_timestamp} %{NUMBER:thread_id} \\[%{WORD:level}\\] (?>\\[%{DATA:error_code}\\] \\[.*?\\] )?%{GREEDYDATA:message}"
        ],
        "ignore_missing": true
      }
    },
    {
      "date": {
        "field": "mysql_timestamp",
        "formats": ["ISO8601"],
        "target_field": "@timestamp",
        "ignore_failure": true
      }
    },
    {
      "set": {
        "field": "service",
        "value": "mysql"
      }
    },
    {
      "remove": {
        "field": ["mysql_timestamp"],
        "ignore_failure": true
      }
    }
  ]
}
修改 Filebeat 配置文件,编辑 /etc/filebeat/filebeat.yml (192.168.92.13),追加 MySQL 的配置块。
# /etc/filebeat/filebeat.yml
setup.ilm.enabled: false
setup.template.enabled: false

filebeat.inputs:
  # nginx 容器 (JSON 日志)
  - type: container
    enabled: true
    paths:
      - "/var/lib/docker/containers/868ec03b41ca90261c5f3bbea28dfb6b8af0f1b856b1e1de1f95dd3e9101fe05/868ec03b41ca90261c5f3bbea28dfb6b8af0f1b856b1e1de1f95dd3e9101fe05-json.log"
    json.keys_under_root: true
    json.add_error_key: true
    processors:
      - add_docker_metadata:
          host: "unix:///var/run/docker.sock"

  # springboot 容器 (JSON 日志)
  - type: container
    enabled: true
    paths:
      - "/var/lib/docker/containers/fff33868a859c200f66d2aeda0b43b15000477c50ae32991a1b2f44d2d73fae3/fff33868a859c200f66d2aeda0b43b15000477c50ae32991a1b2f44d2d73fae3-json.log"
    json.keys_under_root: true
    json.add_error_key: true
    processors:
      - add_docker_metadata:
          host: "unix:///var/run/docker.sock"

  # Redis 容器 (纯文本日志)
  - type: container
    enabled: true
    paths:
      - "/var/lib/docker/containers/7ebfd230a3c82736b87585ab4c86eda33efc15c867c867cb4e81f7778a86178f/7ebfd230a3c82736b87585ab4c86eda33efc15c867c867cb4e81f7778a86178f-json.log"
    processors:
      - add_docker_metadata:
          host: "unix:///var/run/docker.sock"

  # MySQL 容器 (纯文本日志)
  - type: container
    enabled: true
    paths:
      - "/var/lib/docker/containers/d2eec9b0f992eb21d82880b47bcea77f71c3c11425fbd5e08617f514d9d81f7f/d2eec9b0f992eb21d82880b47bcea77f71c3c11425fbd5e08617f514d9d81f7f-json.log"
    processors:
      - add_docker_metadata:
          host: "unix:///var/run/docker.sock"

output.elasticsearch:
  hosts: ["192.168.92.14:9200"]
  indices:
    - index: "nginx-%{+yyyy.MM.dd}"
      when.contains:
        log.file.path: "868ec03b41ca90261c5f3bbea28dfb6b8af0f1b856b1e1de1f95dd3e9101fe05"
    - index: "springboot-%{+yyyy.MM.dd}"
      when.contains:
        log.file.path: "fff33868a859c200f66d2aeda0b43b15000477c50ae32991a1b2f44d2d73fae3"
    - index: "redis-%{+yyyy.MM.dd}"
      when.contains:
        log.file.path: "7ebfd230a3c82736b87585ab4c86eda33efc15c867c867cb4e81f7778a86178f"
    - index: "mysql-error-%{+yyyy.MM.dd}"
      when.contains:
        log.file.path: "d2eec9b0f992eb21d82880b47bcea77f71c3c11425fbd5e08617f514d9d81f7f"
    - index: "default-logs-%{+yyyy.MM.dd}"

  pipelines:
    - pipeline: "redis-grok-pipeline"
      when.contains:
        log.file.path: "7ebfd230a3c82736b87585ab4c86eda33efc15c867c867cb4e81f7778a86178f"
    - pipeline: "mysql-grok-pipeline"
      when.contains:
        log.file.path: "d2eec9b0f992eb21d82880b47bcea77f71c3c11425fbd5e08617f514d9d81f7f"
测试语句
systemctl stop filebeat
rm -rf /var/lib/filebeat/registry
systemctl start filebeat
curl -s "192.168.92.14:9200/mysql-*/_search?size=1&sort=@timestamp:desc&pretty" | jq '.hits.hits[0]._source'

{
  "agent": {
    "hostname": "localhost.localdomain",
    "name": "localhost.localdomain",
    "id": "a19115bc-885d-468b-b4c1-11efc211a477",
    "ephemeral_id": "12484463-0794-46dc-be5b-6d362c2636be",
    "type": "filebeat",
    "version": "7.17.10"
  },
  "log": {
    "file": {
      "path": "/var/lib/docker/containers/d2eec9b0f992eb21d82880b47bcea77f71c3c11425fbd5e08617f514d9d81f7f/d2eec9b0f992eb21d82880b47bcea77f71c3c11425fbd5e08617f514d9d81f7f-json.log"
    },
    "offset": 21773
  },
  "level": "Warning",
  "message": "Plugin mysql_native_password reported: ''mysql_native_password' is deprecated and will be removed in a future release. Please use caching_sha2_password instead'",
  "input": {
    "type": "container"
  },
  "thread_id": "8",
  "@timestamp": "2026-03-24T12:39:47.406Z",
  "ecs": {
    "version": "1.12.0"
  },
  "stream": "stderr",
  "service": "mysql",
  "host": {
    "name": "localhost.localdomain"
  },
  "error_code": "MY-013360"
}到此为止,我的配置只解析了 MySQL 错误日志 ,但慢查询日志是单独的文件,格式也完全不同。要监控慢查询,需要额外配置。
推荐的轻量级解决方案:Filebeat 多行匹配 + 专用 Pipeline(收集Mysql慢查询)
既然追求轻量且不加 Logstash,最好的办法是:让 MySQL 把慢查询写到容器内的一个特定文件,然后 Filebeat 增加一个 input 专门去抓它。
修改 MySQL 启动参数,修改你的 docker-compose.yml 或启动命令,让慢查询写到挂载出来的日志目录:
mysql:
  image: mysql:8.0
  container_name: mysql
  restart: always
  environment:
    TZ: Asia/Shanghai
    LANG: en_US.UTF-8
    MYSQL_ROOT_PASSWORD: "123456"
    MYSQL_DATABASE: big_event
  command:
    - --default-authentication-plugin=mysql_native_password
    - --character-set-server=utf8mb4
    - --collation-server=utf8mb4_general_ci
    - --lower-case-table-names=1
    - --performance-schema=1
    - --skip-log-bin
    # ===== 新增慢查询日志相关参数 =====
    - --slow-query-log=ON           # 开启慢查询日志
    - --long-query-time=1.0         # 慢查询阈值(秒)
    - --log-output=FILE             # 将日志输出到文件
    - --slow-query-log-file=/var/log/mysql/slow.log   # 慢查询日志文件名
  volumes:
    - /data/mysql/data:/var/lib/mysql
    - /data/mysql/init:/docker-entrypoint-initdb.d:ro
    - /data/mysql/logs:/var/log/mysql   # 新增:挂载日志目录,以便宿主机读取 slow.log
  networks:
    - app-network
  ports:
    - "3306:3306"将日志挂载到宿主机s
在 Kibana 中创建 mysql-slow-pipeline,慢查询需要专门的解析逻辑(提取执行时间、锁时间等)。
PUT _ingest/pipeline/mysql-slow-pipeline
{
  "description": "Parse MySQL Slow Logs",
  "processors": [
    {
      "grok": {
        "field": "message",
        "patterns": [
          "^# Time: %{TIMESTAMP_ISO8601:mysql_time}\\n# User@Host: %{USER:mysql_user}\\[.*?\\] @ %{HOSTNAME:mysql_host}.*?\\n# Query_time: %{NUMBER:query_time:float}\\s+Lock_time: %{NUMBER:lock_time:float}\\s+Rows_sent: %{NUMBER:rows_sent:int}\\s+Rows_examined: %{NUMBER:rows_examined:int}\\n%{GREEDYDATA:query}"
        ],
        "ignore_missing": true
      }
    },
    {
      "set": {
        "field": "service",
        "value": "mysql-slow"
      }
    },
    {
      "remove": {
        "field": ["message"],
        "ignore_failure": true
      }
    }
  ]
}
修改 filebeat.yml (关键:多行处理),对于慢查询,必须开启 multiline,否则一条 SQL 会被拆成十几条数据发给 ES。
# /etc/filebeat/filebeat.yml
setup.ilm.enabled: false
setup.template.enabled: false

filebeat.inputs:
  # nginx 容器 (JSON 日志)
  - type: container
    enabled: true
    paths:
      - "/var/lib/docker/containers/868ec03b41ca90261c5f3bbea28dfb6b8af0f1b856b1e1de1f95dd3e9101fe05/868ec03b41ca90261c5f3bbea28dfb6b8af0f1b856b1e1de1f95dd3e9101fe05-json.log"
    json.keys_under_root: true
    json.add_error_key: true
    processors:
      - add_docker_metadata:
          host: "unix:///var/run/docker.sock"

  # springboot 容器 (JSON 日志)
  - type: container
    enabled: true
    paths:
      - "/var/lib/docker/containers/fff33868a859c200f66d2aeda0b43b15000477c50ae32991a1b2f44d2d73fae3/fff33868a859c200f66d2aeda0b43b15000477c50ae32991a1b2f44d2d73fae3-json.log"
    json.keys_under_root: true
    json.add_error_key: true
    processors:
      - add_docker_metadata:
          host: "unix:///var/run/docker.sock"

  # Redis 容器 (纯文本日志)
  - type: container
    enabled: true
    paths:
      - "/var/lib/docker/containers/7ebfd230a3c82736b87585ab4c86eda33efc15c867c867cb4e81f7778a86178f/7ebfd230a3c82736b87585ab4c86eda33efc15c867c867cb4e81f7778a86178f-json.log"
    processors:
      - add_docker_metadata:
          host: "unix:///var/run/docker.sock"

  # MySQL 错误日志 (容器 stdout/stderr,纯文本)
  - type: container
    enabled: true
    paths:
      - "/var/lib/docker/containers/d2eec9b0f992eb21d82880b47bcea77f71c3c11425fbd5e08617f514d9d81f7f/d2eec9b0f992eb21d82880b47bcea77f71c3c11425fbd5e08617f514d9d81f7f-json.log"
    processors:
      - add_docker_metadata:
          host: "unix:///var/run/docker.sock"

  # MySQL 慢查询日志 (单独文件,需要多行合并)
  - type: log
    enabled: true
    paths:
      - "/data/mysql/logs/slow.log"
    fields:
      log_type: mysql_slow
    fields_under_root: true
    multiline:
      type: pattern
      pattern: '^# Time:'
      negate: true
      match: after

output.elasticsearch:
  hosts: ["192.168.92.14:9200"]
  indices:
    - index: "nginx-%{+yyyy.MM.dd}"
      when.contains:
        log.file.path: "868ec03b41ca90261c5f3bbea28dfb6b8af0f1b856b1e1de1f95dd3e9101fe05"
    - index: "springboot-%{+yyyy.MM.dd}"
      when.contains:
        log.file.path: "fff33868a859c200f66d2aeda0b43b15000477c50ae32991a1b2f44d2d73fae3"
    - index: "redis-%{+yyyy.MM.dd}"
      when.contains:
        log.file.path: "7ebfd230a3c82736b87585ab4c86eda33efc15c867c867cb4e81f7778a86178f"
    - index: "mysql-error-%{+yyyy.MM.dd}"
      when.contains:
        log.file.path: "d2eec9b0f992eb21d82880b47bcea77f71c3c11425fbd5e08617f514d9d81f7f"
    - index: "mysql-slow-%{+yyyy.MM.dd}"
      when.contains:
        log.file.path: "slow.log"
    - index: "default-logs-%{+yyyy.MM.dd}"

  pipelines:
    - pipeline: "redis-grok-pipeline"
      when.contains:
        log.file.path: "7ebfd230a3c82736b87585ab4c86eda33efc15c867c867cb4e81f7778a86178f"
    - pipeline: "mysql-grok-pipeline"
      when.contains:
        log.file.path: "d2eec9b0f992eb21d82880b47bcea77f71c3c11425fbd5e08617f514d9d81f7f"
    - pipeline: "mysql-slow-pipeline"
      when.equals:
        log_type: "mysql_slow"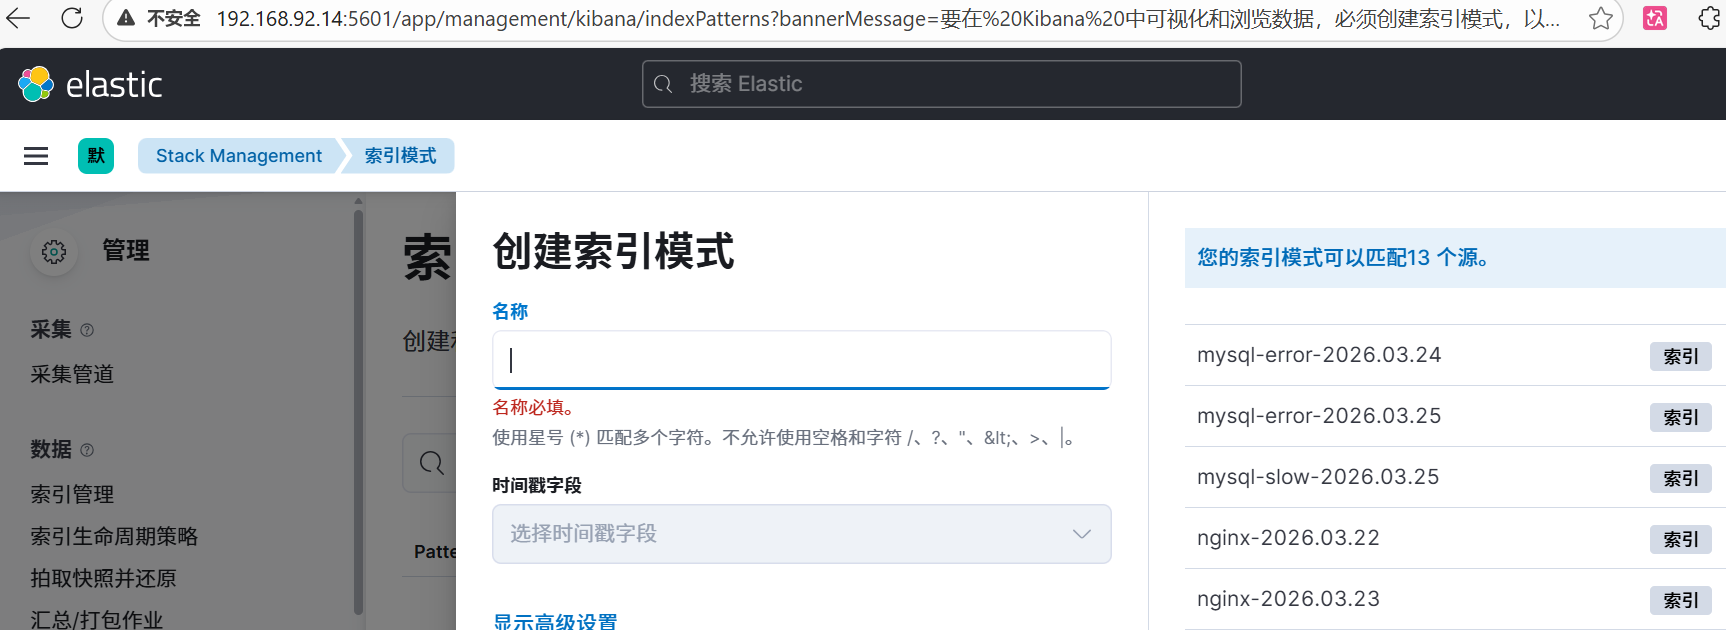
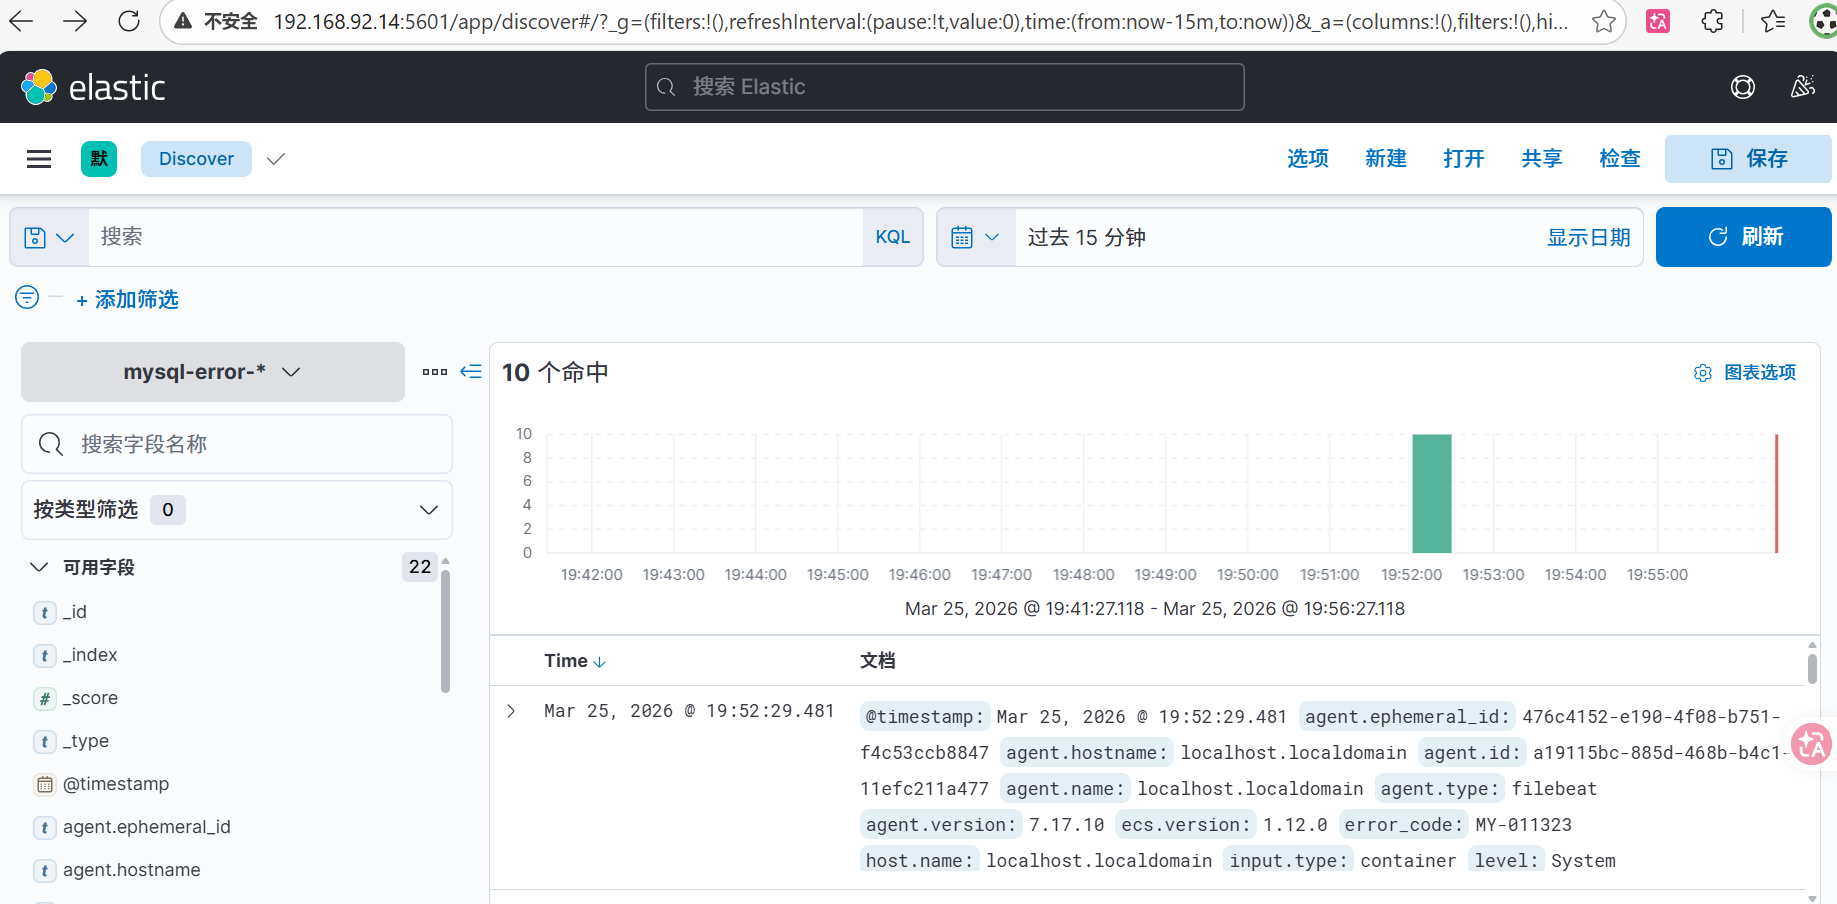
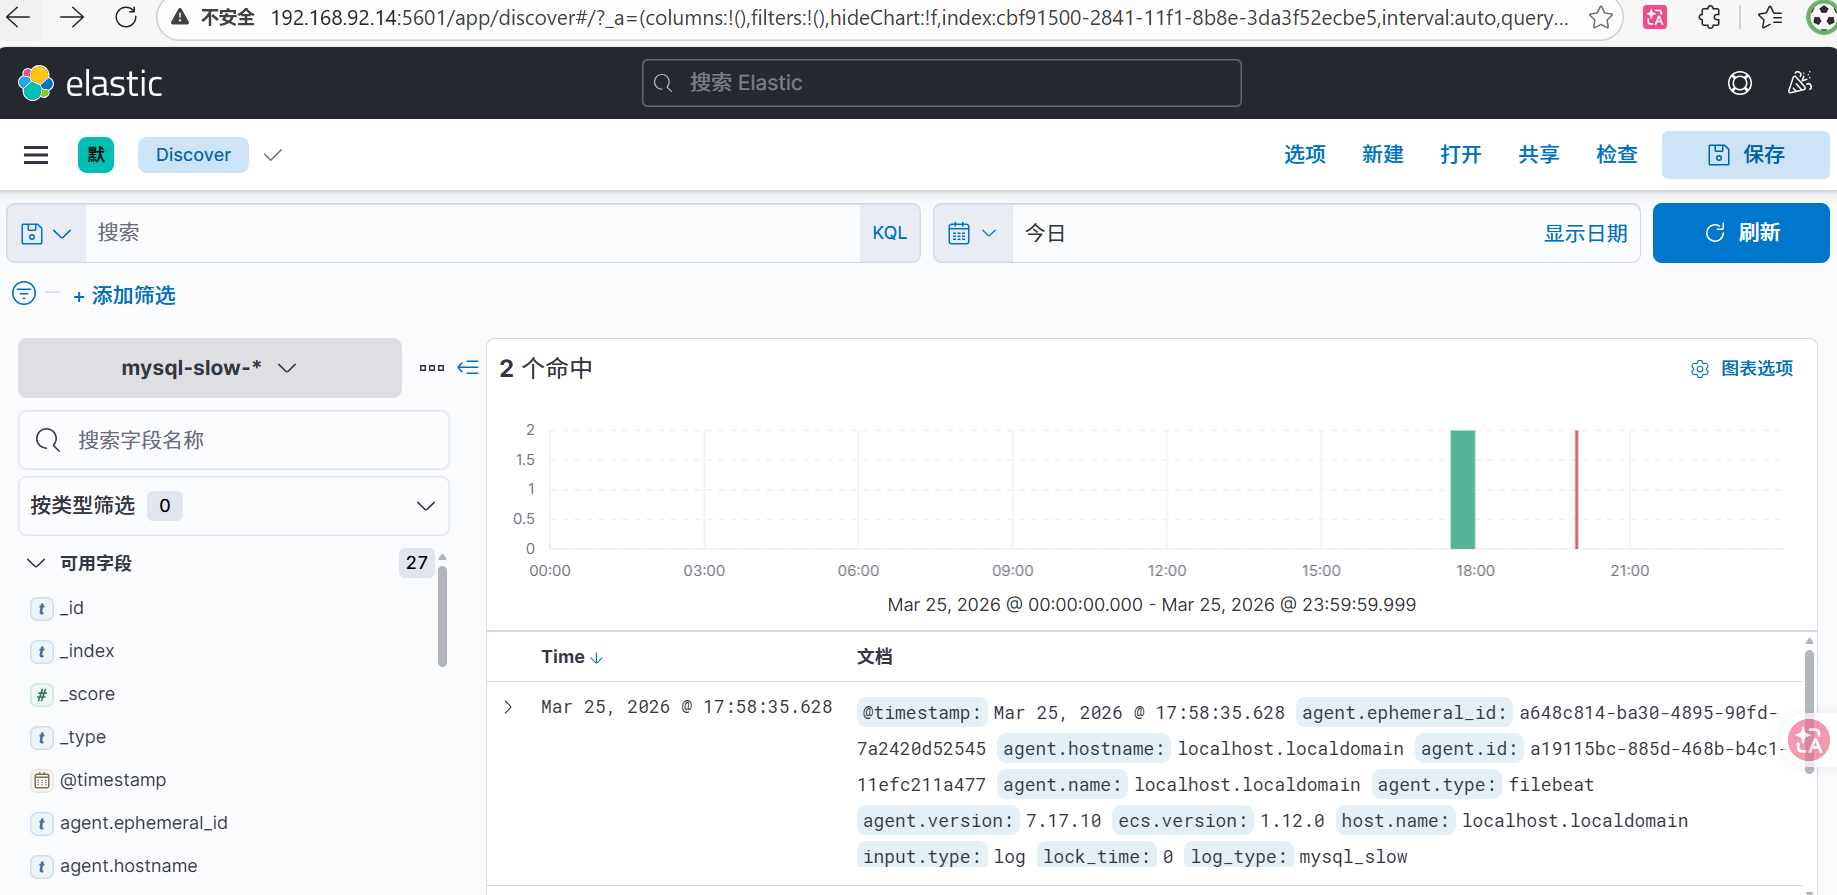
收集mysql错误日志(mysql -* )的和收集mysql慢查询日志(mysql-slow- * )的就一起截图了,都在这里
两个创建分别是mysql -*,@timestamp;mysql-slow- *,@timestamp
elk监控springboot2+vue3+redis中的mysql完毕!
至此,ELK收集Docker Compose部署SpringBoot2+Vue3的日志,实验完毕!