HA+KA+tomcat+Prometheus+Grafana高可用部署
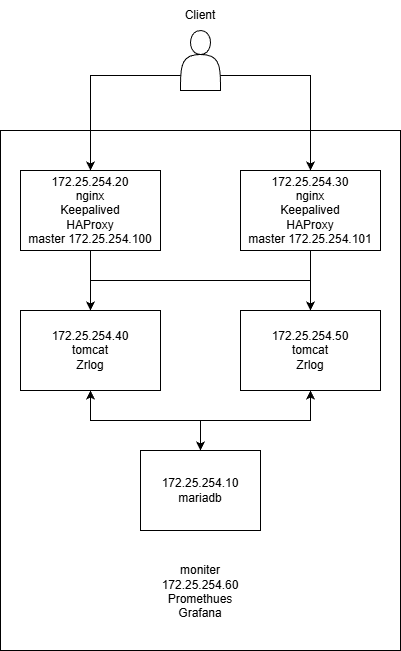
一、整体架构
| 角色 | IP | 部署内容 |
|---|---|---|
| 监控服务器 | 172.25.254.60 | Prometheus + Grafana + node_exporter |
| 数据库服务器 | 172.25.254.10 | MariaDB + node_exporter + mysqld_exporter |
| 应用服务器 1 | 172.25.254.40 | ZrLog + Tomcat + node_exporter |
| 应用服务器 2 | 172.25.254.50 | ZrLog + Tomcat + node_exporter |
| 代理服务器 1 | 172.25.254.20 | HAProxy + Keepalived + node_exporter |
| 代理服务器 2 | 172.25.254.30 | HAProxy + Keepalived + node_exporter |
| VIP1 | 172.25.254.100 | - |
| VIP2 | 172.25.254.101 | - |
二、部署过程
2.1 前置准备(所有服务器)
# 1. 关闭防火墙(永久关闭,生产环境可按需放行端口)
systemctl stop firewalld && systemctl disable firewalld
# 2. 关闭SELinux(永久关闭,需重启生效;临时关闭:setenforce 0)
sed -i 's/^SELINUX=.*/SELINUX=disabled/' /etc/selinux/config
setenforce 0
# 3. 安装基础依赖
dnf install -y wget net-tools tar grep
# 4. 检查关键端口是否占用(9090/3000/9100)
netstat -tulpn | grep -E "9090|3000|9100"
# 若有占用,先停止对应进程(例:kill -9 进程ID)


cat > /etc/hosts << EOF
127.0.0.1   localhost localhost.localdomain localhost4 localhost4.localdomain4
::1         localhost localhost.localdomain localhost6 localhost6.localdomain6
172.25.254.10   db
172.25.254.20   vs1
172.25.254.30   vs2
172.25.254.40   rs1
172.25.254.50   rs2
172.25.254.60   mon
EOF
2.2 部署Mariadb(172.25.254.10)
# 安装MariaDB(阿里云源)
dnf install -y mariadb-server

# 启动并设置开机自启
systemctl start mariadb   && systemctl enable mariadb

# 初始化数据库并配置ZrLog权限
mysql -u root -e "
CREATE DATABASE IF NOT EXISTS zrlog DEFAULT CHARACTER SET utf8mb4 COLLATE utf8mb4_unicode_ci;
CREATE USER IF NOT EXISTS 'zrlog'@'%' IDENTIFIED BY 'zrlog';
GRANT ALL PRIVILEGES ON zrlog.* TO 'zrlog'@'%';
FLUSH PRIVILEGES;
"
#创建 zrlog 数据库(支持表情、中文)
#创建 zrlog 用户(密码 zrlog)
#给该用户授权 zrlog 库的全部权限
#权限立即生效

# 开放数据库端口(可选)
firewall-cmd --add-port=3306/tcp --permanent
firewall-cmd --reload

#因为我这里直接关掉了防火墙所以就没做
2.3 部署tomcat+Zrlog(172.25.254.40和172.25.254.50)
2.3.1 安装JDK + Maven
https://www.oracle.com/cn/java/
# 安装JDK 11
# 1. 上传 jdk-11.tar.gz 到 /root 目录,执行解压
cd /root
tar -zxf jdk-11_linux-x64_bin.tar.gz
mv jdk-11 jdk11
# 2. 配置全局环境变量(永久生效)
cat > /etc/profile.d/jdk.sh << 'EOF'
export JAVA_HOME=/root/jdk11
export PATH=$JAVA_HOME/bin:$PATH
export CLASSPATH=.:$JAVA_HOME/lib
EOF
# 3. 生效并验证
source /etc/profile.d/jdk.sh
java -version # 输出JDK版本即成功
java version "11" 2018-09-25
Java(TM) SE Runtime Environment 18.9 (build 11+28)
Java HotSpot(TM) 64-Bit Server VM 18.9 (build 11+28, mixed mode)
# 1. 下载 Maven 3.9.6(适配JDK 11)
cd /root
wget https://archive.apache.org/dist/maven/maven-3/3.9.6/binaries/apache-maven-3.9.6-bin.tar.gz
# 2. 解压并重命名
tar -zxf apache-maven-3.9.6-bin.tar.gz
mv apache-maven-3.9.6 maven
# 3. 配置全局环境变量
cat > /etc/profile.d/maven.sh << 'EOF'
export MAVEN_HOME=/root/maven
export PATH=$MAVEN_HOME/bin:$PATH
EOF
source /etc/profile.d/maven.sh
mvn -version # 输出Maven版本即成功
Apache Maven 3.9.6 (bc0240f3c744dd6b6ec2920b3cd08dcc295161ae)
Maven home: /root/maven
Java version: 11, vendor: Oracle Corporation, runtime: /root/jdk11
Default locale: en_US, platform encoding: UTF-8
OS name: "linux", version: "5.14.0-611.16.1.el9_7.x86_64", arch: "amd64", family: "unix"
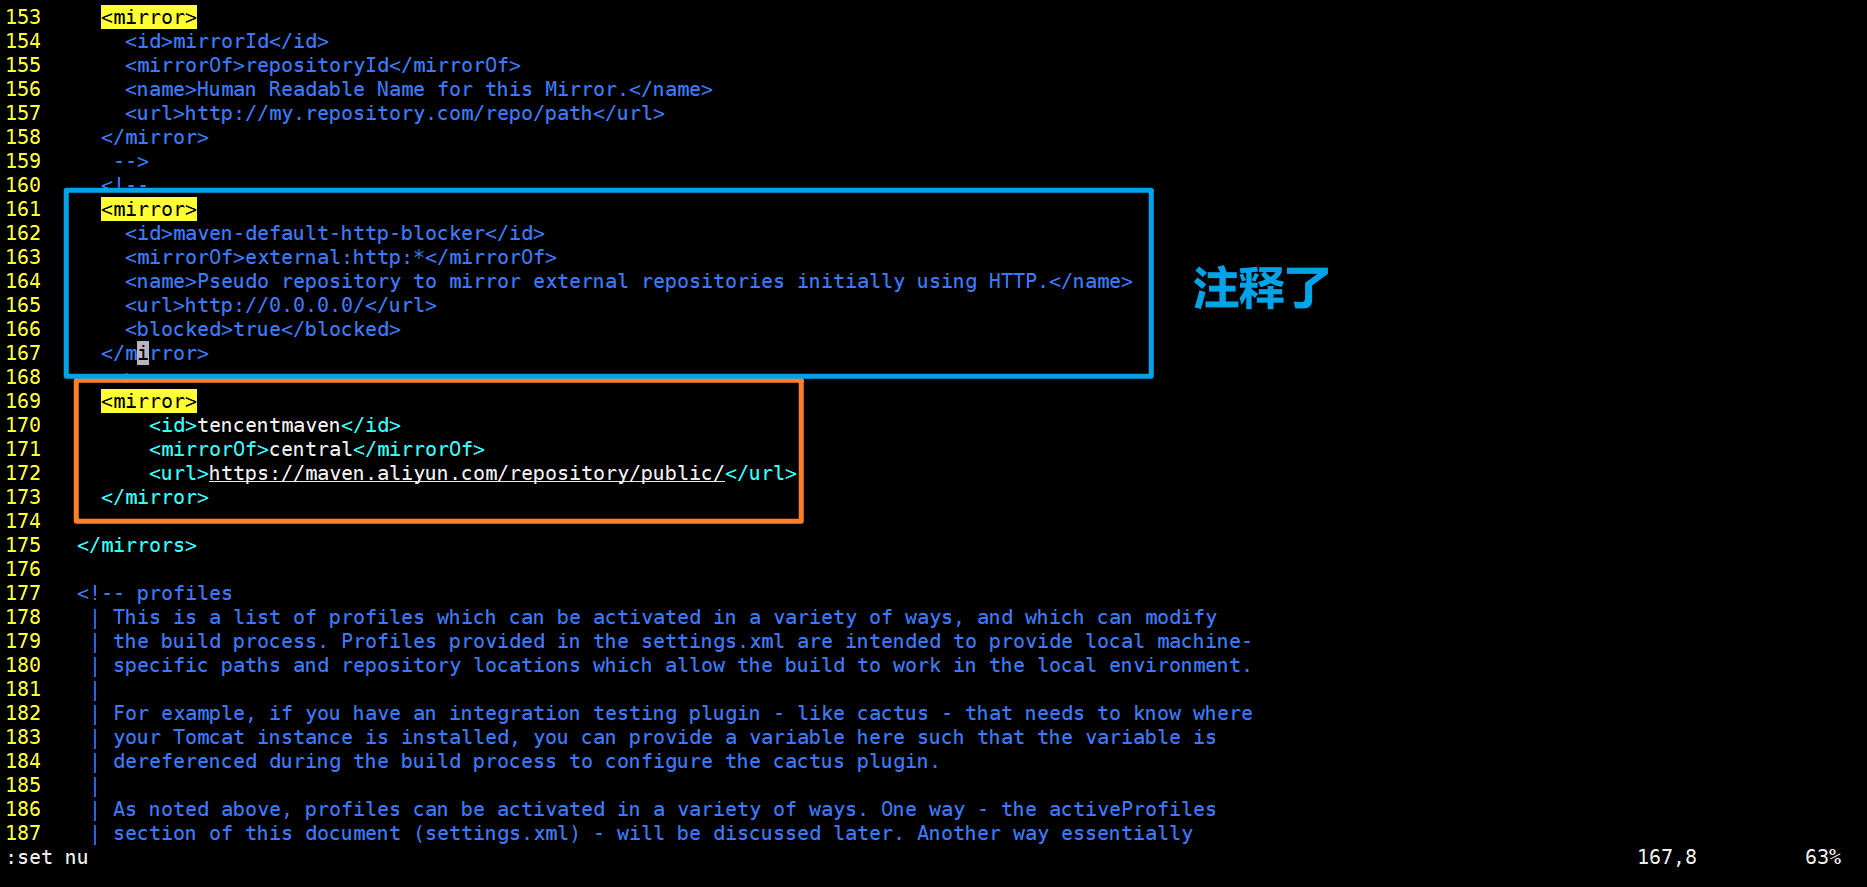
vim /root/maven/conf/settings.xml
.....
<mirror>
<id>tencentmaven</id>
<mirrorOf>central</mirrorOf>
<url>https://maven.aliyun.com/repository/public/</url>
</mirror>
....
bash
# 解压到指定目录,避免文件混乱
unzip -q zrlog-3.3.0-1811fd7-release.zip -d zrlog-src
cd zrlog-src/
# 进入pom.xml所在目录(根据你的压缩包结构)
find   /root/zrlog-src/   -name  pom.xml
# 配置阿里云镜像(解决依赖下载慢/失败)
mv /root/zrlog-src/META-INF/maven/com.hibegin/package/pom.xml /root/zrlog-src/META-INF/maven/com.hibegin/package/pom.xml.bak


# 写入全新的独立pom.xml(无需父POM,直接构建War包)
cat > /root/zrlog-src/META-INF/maven/com.hibegin/package/pom.xml << 'EOF'
<?xml version="1.0" encoding="UTF-8"?>
<project xmlns="http://maven.apache.org/POM/4.0.0"
         xmlns:xsi="http://www.w3.org/2001/XMLSchema-instance"
         xsi:schemaLocation="http://maven.apache.org/POM/4.0.0 http://maven.apache.org/xsd/maven-4.0.0.xsd">
    <modelVersion>4.0.0</modelVersion>
    <!-- 手动定义项目基本信息(替代父POM) -->
    <groupId>com.hibegin</groupId>
    <artifactId>zrlog-web</artifactId>
    <version>3.3.0</version>
    <packaging>war</packaging>
    <name>ZrLog Web</name>
    <description>ZrLog Blog System</description>
    <!-- 核心依赖(覆盖父POM的关键依赖) -->
    <dependencies>
        <!-- Servlet & JSP 核心 -->
        <dependency>
            <groupId>javax.servlet</groupId>
            <artifactId>javax.servlet-api</artifactId>
            <version>4.0.1</version>
            <scope>provided</scope>
        </dependency>
        <dependency>
            <groupId>javax.servlet.jsp</groupId>
            <artifactId>jsp-api</artifactId>
            <version>2.2</version>
            <scope>provided</scope>
        </dependency>
        <!-- Java EE 基础 -->
        <dependency>
            <groupId>javax</groupId>
            <artifactId>javaee-api</artifactId>
            <version>8.0.1</version>
            <scope>provided</scope>
        </dependency>
        <!-- 数据库驱动(ZrLog核心依赖) -->
        <dependency>
            <groupId>mysql</groupId>
            <artifactId>mysql-connector-java</artifactId>
            <version>8.0.33</version>
        </dependency>
        <!-- 日志依赖 -->
        <dependency>
            <groupId>org.slf4j</groupId>
            <artifactId>slf4j-api</artifactId>
            <version>1.7.36</version>
        </dependency>
        <dependency>
            <groupId>ch.qos.logback</groupId>
            <artifactId>logback-classic</artifactId>
            <version>1.2.13</version>
        </dependency>
    </dependencies>
    <!-- 构建配置(确保能打出可运行的War包) -->
    <build>
        <finalName>zrlog</finalName>
        <plugins>
            <!-- 编译插件(适配JDK11) -->
            <plugin>
                <groupId>org.apache.maven.plugins</groupId>
                <artifactId>maven-compiler-plugin</artifactId>
                <version>3.8.1</version>
                <configuration>
                    <source>11</source>
                    <target>11</target>
                    <encoding>UTF-8</encoding>
                </configuration>
            </plugin>
            <!-- War包插件(忽略缺失web.xml) -->
            <plugin>
                <groupId>org.apache.maven.plugins</groupId>
                <artifactId>maven-war-plugin</artifactId>
                <version>3.3.2</version>
                <configuration>
                    <failOnMissingWebXml>false</failOnMissingWebXml>
                    <!-- 指向ZrLog的源码/资源目录(关键) -->
                    <webResources>
                        <resource>
                            <directory>/root/zrlog-src</directory>
                            <includes>
                                <include>WEB-INF/**/*</include>
                                <include>META-INF/**/*</include>
                                <include>**/*.jsp</include>
                                <include>**/*.html</include>
                                <include>**/*.css</include>
                                <include>**/*.js</include>
                            </includes>
                        </resource>
                    </webResources>
                </configuration>
            </plugin>
        </plugins>
    </build>
</project>
EOF

cd  /root/zrlog-src/META-INF/maven/com.hibegin/package/

# 执行Maven打包(-DskipTests跳过测试,加快构建速度)
mvn clean package -DskipTests
2.3.2 复制 War 包并清理旧数据
tar -xaf   apache-tomcat-10.1.52.tar.gz

mv apache-tomcat-10.1.52   tomcat10

# 复制War包到Tomcat webapps目录,重命名为ROOT.war(直接访问根路径)

cd  /root/zrlog-src/META-INF/maven/com.hibegin/package/

cp target/zrlog.war   /root/tomcat10/webapps/ROOT.war


# 清理Tomcat旧解压文件(避免冲突)
rm -rf /root/tomcat10/webapps/ROOT
2.3.3 启动 Tomcat 并验证
# 启动Tomcat
/root/tomcat10/bin/startup.sh

# 查看启动日志(确认War包解压、服务无报错)
tail -f /root/tomcat10/logs/catalina.out
✅ 启动成功标识:
日志中出现 Server startup in XXX ms,且无 ERROR 级日志。
在浏览器输入:
正常来说
在浏览器访问rs1和rs2的ip:8080会出现zrlog的安装引导界面
yum install s-nail -y
chmod 755 /etc/s-nail.rc
# 编辑 mailx 主配置文件
vim /etc/s-nail.rc
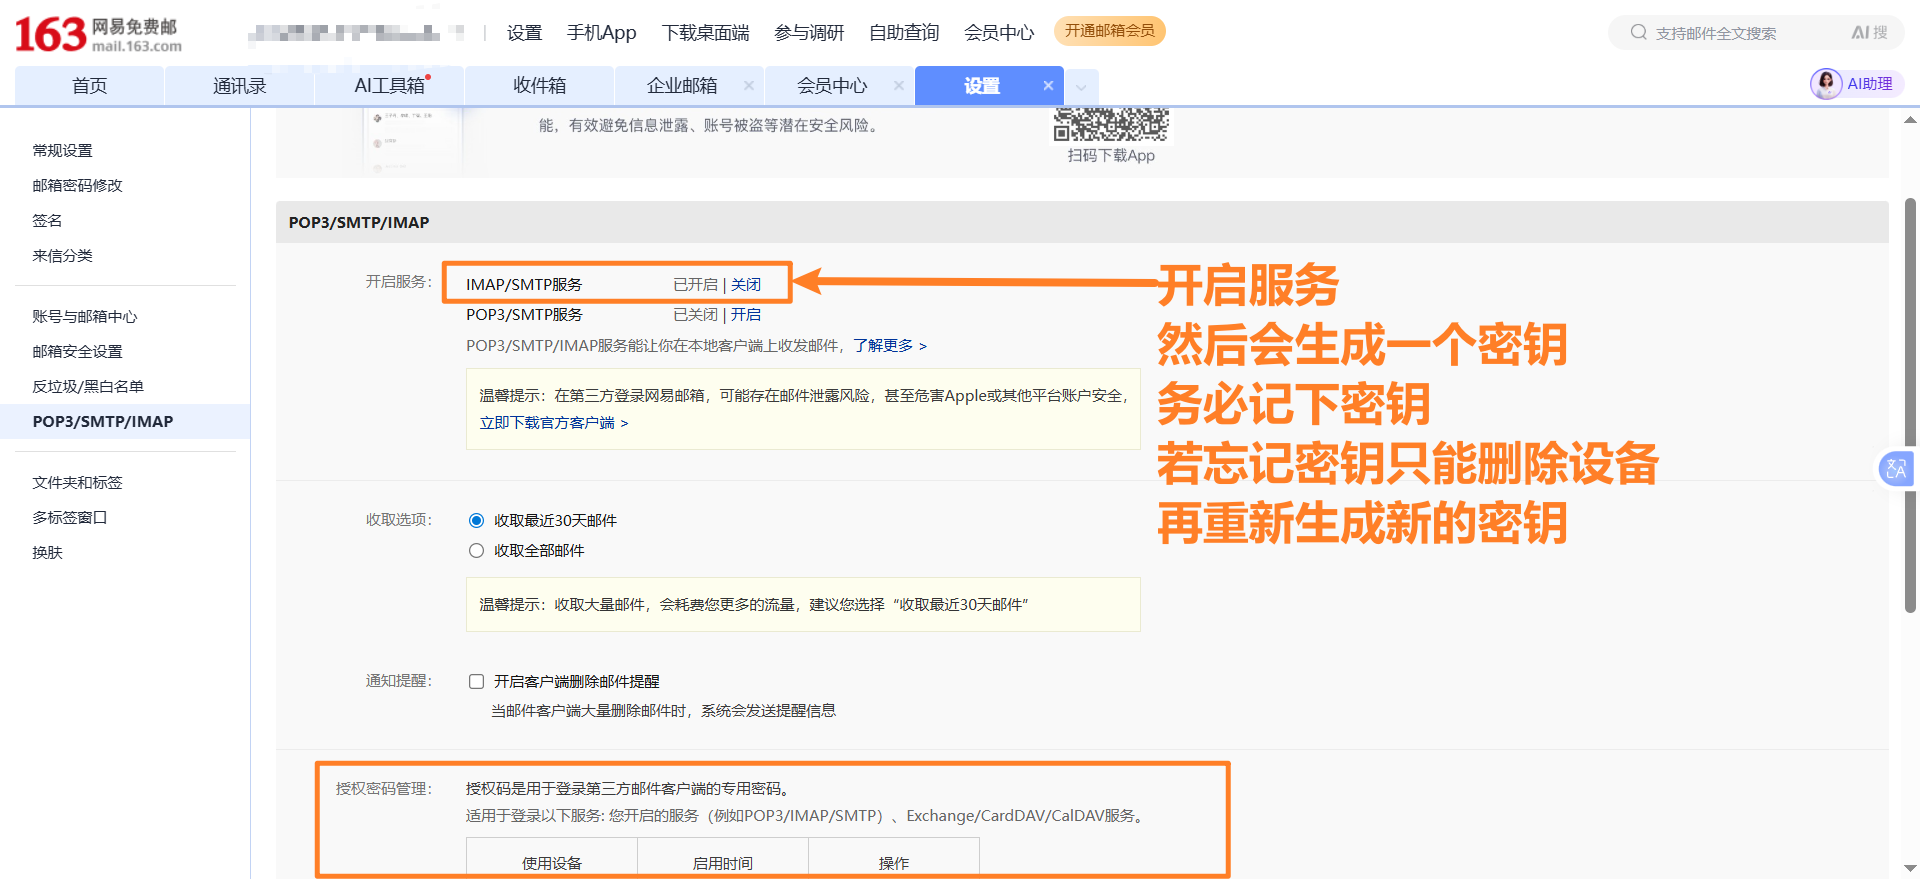
set from="xxxxxxx@xxx.com"
set smtp="smtps://smtp.163.com:465" #如果是qq邮箱就换成smtps://smtp.qq.com:465
set smtp-auth-user="xxxxxxx@xxx.com"
set smtp-auth-password="SJuBEpLF5bYiyRK6"
set smtp-auth=login
set ssl-verify=ignore
set nss-config-dir=/etc/pki/nssdb/
# 执行以下命令,测试基础发送
echo "这是 Keepalived 邮件通知测试内容" | mailx -s "测试邮件" xxxxxxx@xxx.com
2.4 HAProxy + Keepalived 适配调整
2.4.1 调整 HAProxy 配置
bash
# yum install haproxy -y
cat > /etc/haproxy/haproxy.cfg << 'EOF'
# global 段:全局配置(进程级参数)
global
    log         127.0.0.1 local2
    chroot      /var/lib/haproxy
    pidfile     /var/run/haproxy.pid
    maxconn     4000
    user        haproxy
    group       haproxy
    daemon
    stats socket /var/lib/haproxy/stats
# defaults 段:为后续的 frontend/backend 设置默认参数,避免重复配置。
defaults
    mode                    http
    log                     global
    option                  httplog
    option                  dontlognull
    option                  http-server-close
    option                  forwardfor except 127.0.0.0/8
    option                  redispatch
    retries                 3
    timeout http-request    10s
    timeout queue           1m
    timeout connect         10s
    timeout client          1m
    timeout server          1m
    timeout http-keep-alive 10s
    timeout check           10s
    maxconn                 3000

# listen stats 段:监控页面(可选)
# 提供可视化监控界面,查看后端节点健康状态、连接数等。
listen stats
    bind *:8080
    mode http
    stats enable
    stats uri /haproxy-stats
    stats auth admin:admin123
#frontend http-in 段:定义 HAProxy 接收请求的端口和转发规则。
frontend http-in
    bind *:80                      # 监听80端口(客户端访问的入口)
    default_backend zrlog_servers  # 所有请求默认转发到zrlog_servers后端
#backend zrlog_servers 段:定义后端服务器列表、负载均衡算法、健康检查规则。
#check:启用健康检查;inter 2000:每 2 秒检查一次;rise 2:连续 2 次健康则标记为可用;fall 3:连续 3 次失败则标记为不可用。
backend zrlog_servers
    balance roundrobin  # 负载均衡策略
    # 关键1:调整健康检查规则,匹配后端实际响应
    option httpchk GET / HTTP/1.1\r\nHost:\ zrlog.example.com  # 模拟带Host的请求(替换为你的ZrLog域名/IP)
    http-check expect status 200  # 若后端返回302,改为 http-check expect status 302
    # 关键2:放宽健康检查参数,避免误判
    server zrlog1 192.168.223.21:8080 check inter 5s fall 3 rise 2  # 检查间隔5s,3次失败才标记DOWN
    server zrlog2 192.168.223.24:8080 check inter 5s fall 3 rise 2
    # 关键3:转发关键请求头(ZrLog可能依赖)
    http-request set-header X-Real-IP %[src]
    http-request set-header X-Forwarded-For %[src]
EOF


# 重启HAProxy
systemctl restart haproxy && systemctl enable haproxy

#检查配置文件语法
# haproxy -c -f /etc/haproxy/haproxy.cfg
在vs1上配置keepalived
cat > /etc/keepalived/keepalived.conf << 'EOF'
global_defs {
   router_id LVS_20
}

vrrp_script check_nginx {
    script "/usr/local/bin/check_nginx.sh"
    interval 2
    weight -50
    fall 2
    rise 2
}

vrrp_instance VI_1 {
    state MASTER
    interface eth0
    virtual_router_id 51
    priority 100
    advert_int 1
    track_script {
        check_nginx
    }
    authentication {
        auth_type PASS
        auth_pass 1111
    }
    virtual_ipaddress {
        172.25.254.100
    }
    # 状态切换通知脚本:节点角色变化时执行指定脚本,并传递参数(master/backup/failed)
    # notify_master:节点成为主节点时执行
    # notify_backup:节点成为备节点时执行
    # notify_failed:节点故障时执行
    notify_master "/usr/local/bin/keepalived_mail.sh master"
    notify_backup "/usr/local/bin/keepalived_mail.sh backup"
    notify_failed "/usr/local/bin/keepalived_mail.sh failed"
}

vrrp_instance VI_2 {
    state BACKUP
    interface eth0
    virtual_router_id 52
    priority 90
    advert_int 1
    authentication {
        auth_type PASS
        auth_pass 2222
    }
    virtual_ipaddress {
        172.25.254.101
    }
    notify_master "/usr/local/bin/keepalived_mail.sh master"
    notify_backup "/usr/local/bin/keepalived_mail.sh backup"
    notify_failed "/usr/local/bin/keepalived_mail.sh failed"
}
EOF
在vs2上配置keepalived
cat > /etc/keepalived/keepalived.conf << 'EOF'
global_defs {
   router_id LVS_30
}

vrrp_script check_nginx {
    script "/usr/local/bin/check_nginx.sh"
    interval 2
    weight -50
    fall 2
    rise 2
}

vrrp_instance VI_1 {
    state BACKUP
    interface eth0
    virtual_router_id 51
    priority 90
    advert_int 1
    authentication {
        auth_type PASS
        auth_pass 1111
    }
    virtual_ipaddress {
        172.25.254.100
    }
    notify_master "/usr/local/bin/keepalived_mail.sh master"
    notify_backup "/usr/local/bin/keepalived_mail.sh backup"
    notify_failed "/usr/local/bin/keepalived_mail.sh failed"
}

vrrp_instance VI_2 {
    state MASTER
    interface eth0
    virtual_router_id 52
    priority 100
    advert_int 1
    track_script {
        check_nginx
    }
    authentication {
        auth_type PASS
        auth_pass 2222
    }
    virtual_ipaddress {
        172.25.254.101
    }
    notify_master "/usr/local/bin/keepalived_mail.sh master"
    notify_backup "/usr/local/bin/keepalived_mail.sh backup"
    notify_failed "/usr/local/bin/keepalived_mail.sh failed"
}
EOF
check_nginx脚本
在vs1和vs2上配置检查nginx的脚本
cat > /usr/local/bin/check_nginx.sh << EOF
#!/bin/bash
if ss -tulnp | grep -q ':80'; then
    exit 0
else
    exit 1
fi
EOF

chmod +x /usr/local/bin/check_nginx.sh
邮件告警脚本
cat > /usr/local/bin/keepalived_mail.sh << EOF
#!/bin/bash
# Keepalived 状态变更邮件通知脚本
# 参数:$1 = 状态(master/backup/failed)

# 配置参数
VIP="192.168.223.100"  # 你的 VIP 地址
TO_EMAIL="1341101176@qq.com"  # 收件邮箱
SUBJECT="【Keepalived 告警】节点状态变更"

# 拼接邮件内容
MESSAGE="
=====================================
Keepalived 节点状态变更通知
=====================================
节点状态:$1
VIP 地址:${VIP}
发生时间:$(date +'%Y-%m-%d %H:%M:%S')
=====================================
"

# 用 mailx 发送邮件
echo "${MESSAGE}" | mailx -s "${SUBJECT}" ${TO_EMAIL}

# 记录日志(可选,便于排查)
echo "$(date +'%Y-%m-%d %H:%M:%S') - 发送 Keepalived 状态邮件,状态:$1" >> /var/log/keepalived_mail.log
EOF

# 赋予执行权限
chmod +x /usr/local/bin/keepalived_mail.sh
2.5 部署Prometheus和Grafana (172.25.254.60)
2.5.1 安装 Prometheus
# 1. 下载 Prometheus 包(确认架构匹配,ARM 需替换为arm64包)
wget https://github.com/prometheus/prometheus/releases/download/v3.10.0/prometheus-3.10.0.linux-amd64.tar.gz
# 校验包完整性(可选,需提前下载校验文件)
wget https://github.com/prometheus/prometheus/releases/download/v3.10.0/sha256sums.txt
sha256sum -c sha256sums.txt --ignore-missing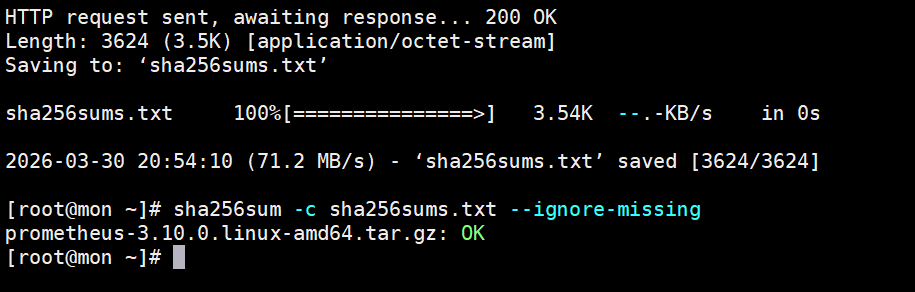
# 2. 解压
tar -xzf prometheus-3.10.0.linux-amd64.tar.gz

# 3. 创建配置目录并赋权
mkdir -p /root/prometheus/data
chmod 755 /root/prometheus -R

# 4. 配置 Prometheus(严格保证YAML缩进/语法)
cat > /root/prometheus/prometheus.yml << 'EOF'
global:
  scrape_interval: 15s
  evaluation_interval: 15s

scrape_configs:
  - job_name: 'prometheus'
    static_configs:
      - targets: ['localhost:9090']

  - job_name: '172.25.254.20'
    static_configs:
      - targets: ['172.25.254.20:9100']
        labels:
          instance: 'HAProxy1'

  - job_name: '172.25.254.40'
    static_configs:
      - targets: ['172.25.254.40:9100']
        labels:
          instance: 'ZrLog1'

  - job_name: '172.25.254.10'
    static_configs:
      - targets: ['172.25.254.10:9100']
        labels:
          instance: 'MariaDB'

  - job_name: 'mysql-172.25.254.10'
    static_configs:
      - targets: ['172.25.254.10:9104']
        labels:
          instance: 'MariaDB-MySQL'

  - job_name: '172.25.254.30'
    static_configs:
      - targets: ['172.25.254.30:9100']
        labels:
          instance: 'HAProxy2'

  - job_name: '172.25.254.50'
    static_configs:
      - targets: ['172.25.254.50:9100']
        labels:
          instance: 'ZrLog2'
EOF

# 5. 验证配置文件语法
/root/prometheus-3.10.0.linux-amd64/promtool check config /root/prometheus/prometheus.yml
# 6. 启动 Prometheus(后台运行,绑定所有网卡)
cd /root/prometheus-3.10.0.linux-amd64
nohup ./prometheus \
  --config.file=/root/prometheus/prometheus.yml \
  --storage.tsdb.path=/root/prometheus/data \
  --web.enable-admin-api \
  --web.enable-lifecycle \
  --web.listen-address=0.0.0.0:9090 > /root/prometheus.log 2>&1 &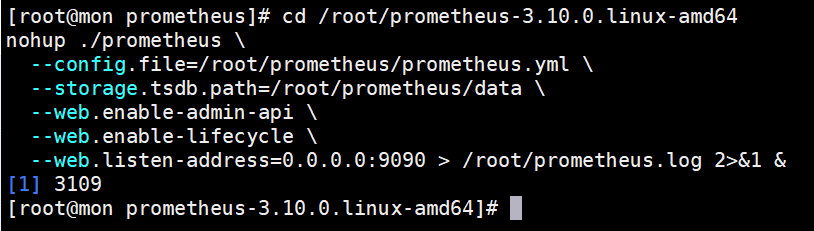
#6.1(可选)创建Prometheus的systemd 服务文件,从而方便设置开机启动
vim /etc/systemd/system/prometheus.service
[Unit]
# 服务描述
Description=Prometheus Server
# 网络启动后再运行
After=network-online.target

[Service]
# 运行用户(root 直接用 root)
User=root
# 工作目录(和你手动启动的目录一致)
WorkingDirectory=/root/prometheus-3.10.0.linux-amd64
# 启动命令(完全沿用你的命令,去掉 nohup 和后台 &)
ExecStart=/root/prometheus-3.10.0.linux-amd64/prometheus \
  --config.file=/root/prometheus/prometheus.yml \
  --storage.tsdb.path=/root/prometheus/data \
  --web.enable-admin-api \
  --web.enable-lifecycle \
  --web.listen-address=0.0.0.0:9090
# 日志输出(和你原来的日志文件一致)
StandardOutput=append:/root/prometheus.log
StandardError=append:/root/prometheus.log
# 进程意外退出自动重启
Restart=on-failure
# 重启间隔
RestartSec=5

[Install]
# 开机自启
WantedBy=multi-user.target

# 7. 验证启动状态
sleep 5
ps -ef | grep prometheus | grep -v grep
# 检查端口监听
netstat -tulpn | grep 9090
# 查看日志(无报错则正常)
tail -10 /root/prometheus.log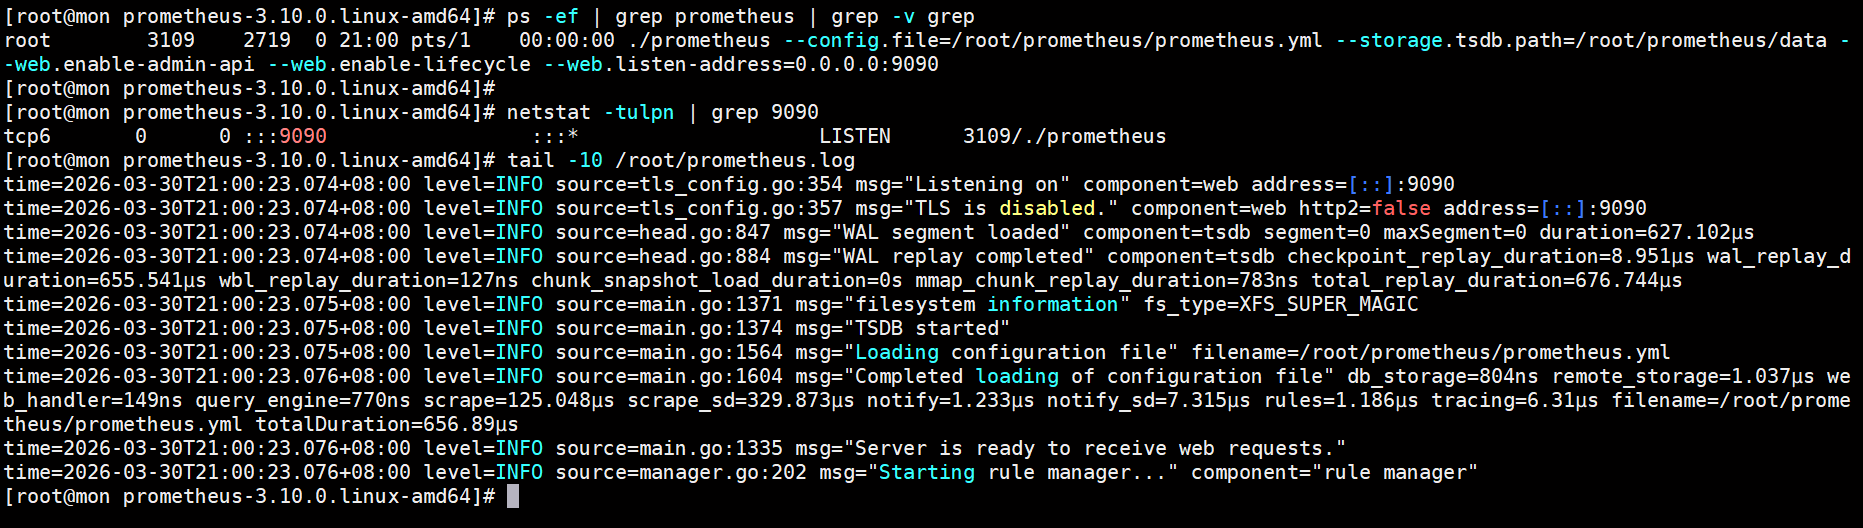
2.5.2 安装Grafana
# 1. 添加 Grafana 官方源(解决包不存在问题)
cat > /etc/yum.repos.d/grafana.repo << 'EOF'
[grafana]
name=grafana
baseurl=https://mirrors.tuna.tsinghua.edu.cn/grafana/yum/rpm/
enabled=1
gpgcheck=0
EOF

# 2. 安装 Grafana 及依赖
dnf install -y grafana
# 3. 启动并设置开机自启
systemctl start grafana-server
systemctl enable grafana-server

# 4. 验证启动状态
systemctl status grafana-server
# 检查端口监听
netstat -tulpn | grep 3000
# 查看 Grafana 日志(排查启动故障)
journalctl -u grafana-server -f
2.6 安装 node_exporter(所有被监控节点)
# 1. 下载 node_exporter 包(监控服务器可先下载后scp,目标节点也可直接下载)
cd /root
wget https://github.com/prometheus/node_exporter/releases/download/v1.8.0/node_exporter-1.8.0.linux-amd64.tar.gz

# 2. 解压
tar -xzf node_exporter-1.8.0.linux-amd64.tar.gz

# 3. 启动 node_exporter(后台运行,绑定所有网卡)
nohup ./node_exporter-1.8.0.linux-amd64/node_exporter \
  --web.listen-address=0.0.0.0:9100 > /root/node_exporter.log 2>&1 &

# 4. 验证启动状态
sleep 3
ps -ef | grep node_exporter | grep -v grep
netstat -tulpn | grep 9100
tail -5 /root/node_exporter.log

vim /etc/systemd/system/node_exporter.service
[Unit]
Description=Node Exporter
After=network.target

[Service]
User=root
WorkingDirectory=/root/node_exporter-1.8.0.linux-amd64
ExecStart=/root/node_exporter-1.8.0.linux-amd64/node_exporter --web.listen-address=0.0.0.0:9100
StandardOutput=append:/root/node_exporter.log
StandardError=append:/root/node_exporter.log
Restart=on-failure
RestartSec=5

[Install]
WantedBy=multi-user.target
2.7 安装 mysqld_exporter(仅数据库服务器 172.25.254.10)
wget https://github.com/prometheus/mysqld_exporter/releases/download/v0.19.0/mysqld_exporter-0.19.0.linux-amd64.tar.gz

# 1. 解压安装包
cd /root
tar -xzf mysqld_exporter-0.19.0.linux-amd64.tar.gz

# 2. 创建认证配置文件(存放MySQL账号)
cat > /root/.my.cnf << 'EOF'
[client]
user=zrlog
password=zrlog123456
host=localhost
EOF

# 3. 后台启动 mysqld_exporter(默认端口9104)
nohup ./mysqld_exporter-0.19.0.linux-amd64/mysqld_exporter \
  --config.my-cnf="/root/.my.cnf" \
  --web.listen-address=0.0.0.0:9104 > /root/mysqld_exporter.log 2>&1 &

# 4. 验证启动
ps -ef | grep mysqld_exporter | grep -v grep
netstat -tulpn | grep 9100

vim /etc/systemd/system/mysqld_exporter.service
[Unit]
Description=MySQL Exporter
After=network.target

[Service]
User=root
WorkingDirectory=/root/mysqld_exporter-0.19.0.linux-amd64
ExecStart=/root/mysqld_exporter-0.19.0.linux-amd64/mysqld_exporter \
  --config.my-cnf=/root/.my.cnf \
  --web.listen-address=0.0.0.0:9104

StandardOutput=append:/root/mysqld_exporter.log
StandardError=append:/root/mysqld_exporter.log
Restart=on-failure
RestartSec=5

[Install]
WantedBy=multi-user.target
三、Web页面配置
3.1 访问地址
| 服务 | 地址 | 默认账号 | 注意事项 |
|---|---|---|---|
| Prometheus | http://172.25.254.60:9090 | 无需登录 | 确保服务器防火墙 / SELinux 已关闭 |
| Grafana | http://172.25.254.60:3000 | admin / admin | 首次登录强制修改密码 |
3.2 Grafana 配置步骤
步骤 1:登录 Grafana
- 浏览器访问
http://172.25.254.60:3000 - 输入默认账号:
admin,密码:admin - 按提示修改新密码(建议记录)
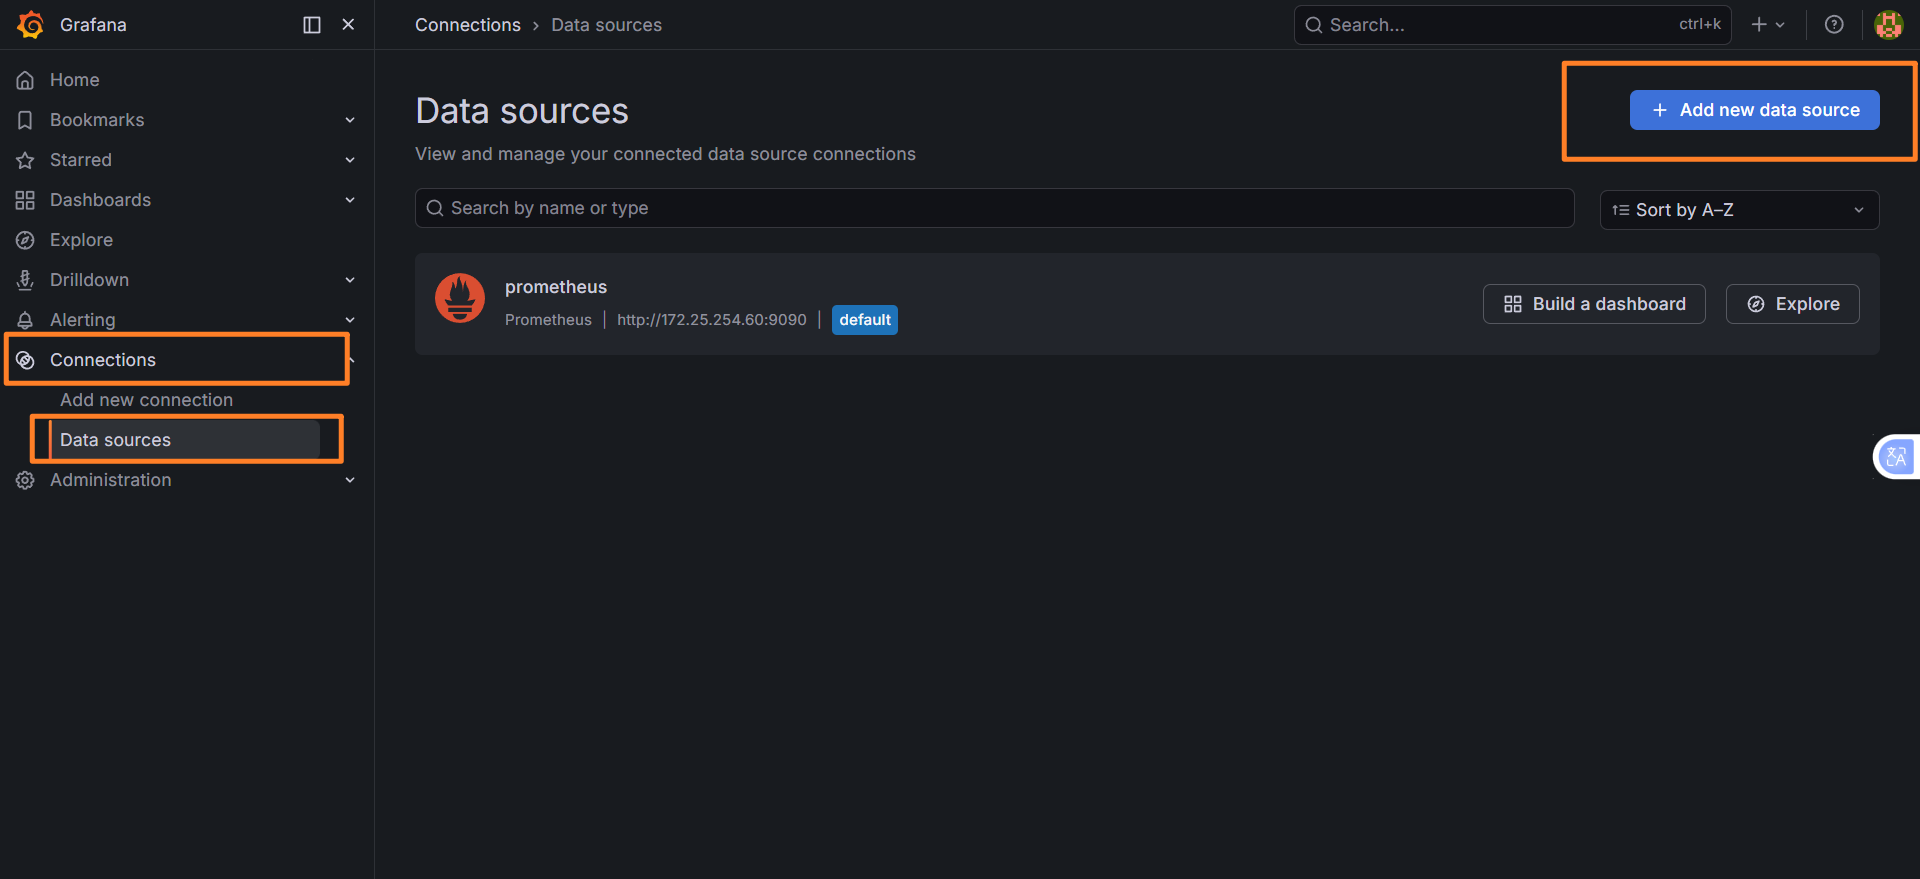
步骤 2:添加 Prometheus 数据源
-
左侧菜单 → Configuration → Data Sources
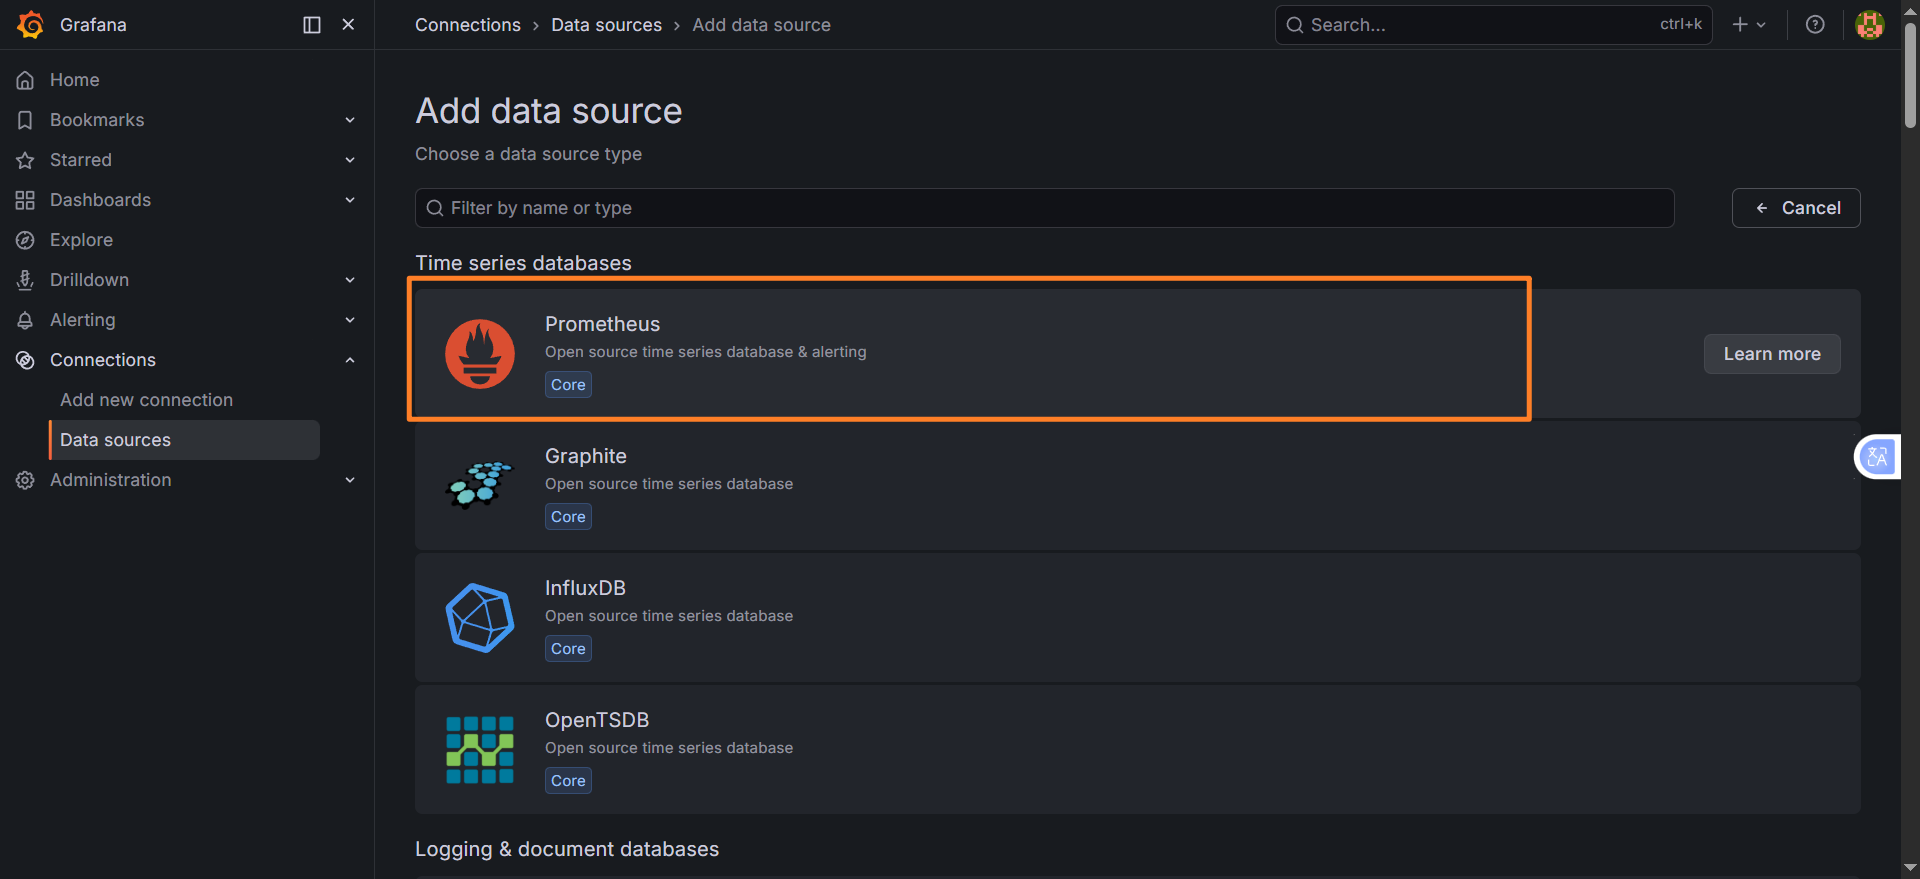
-
点击 Add data source ,选择 Prometheus
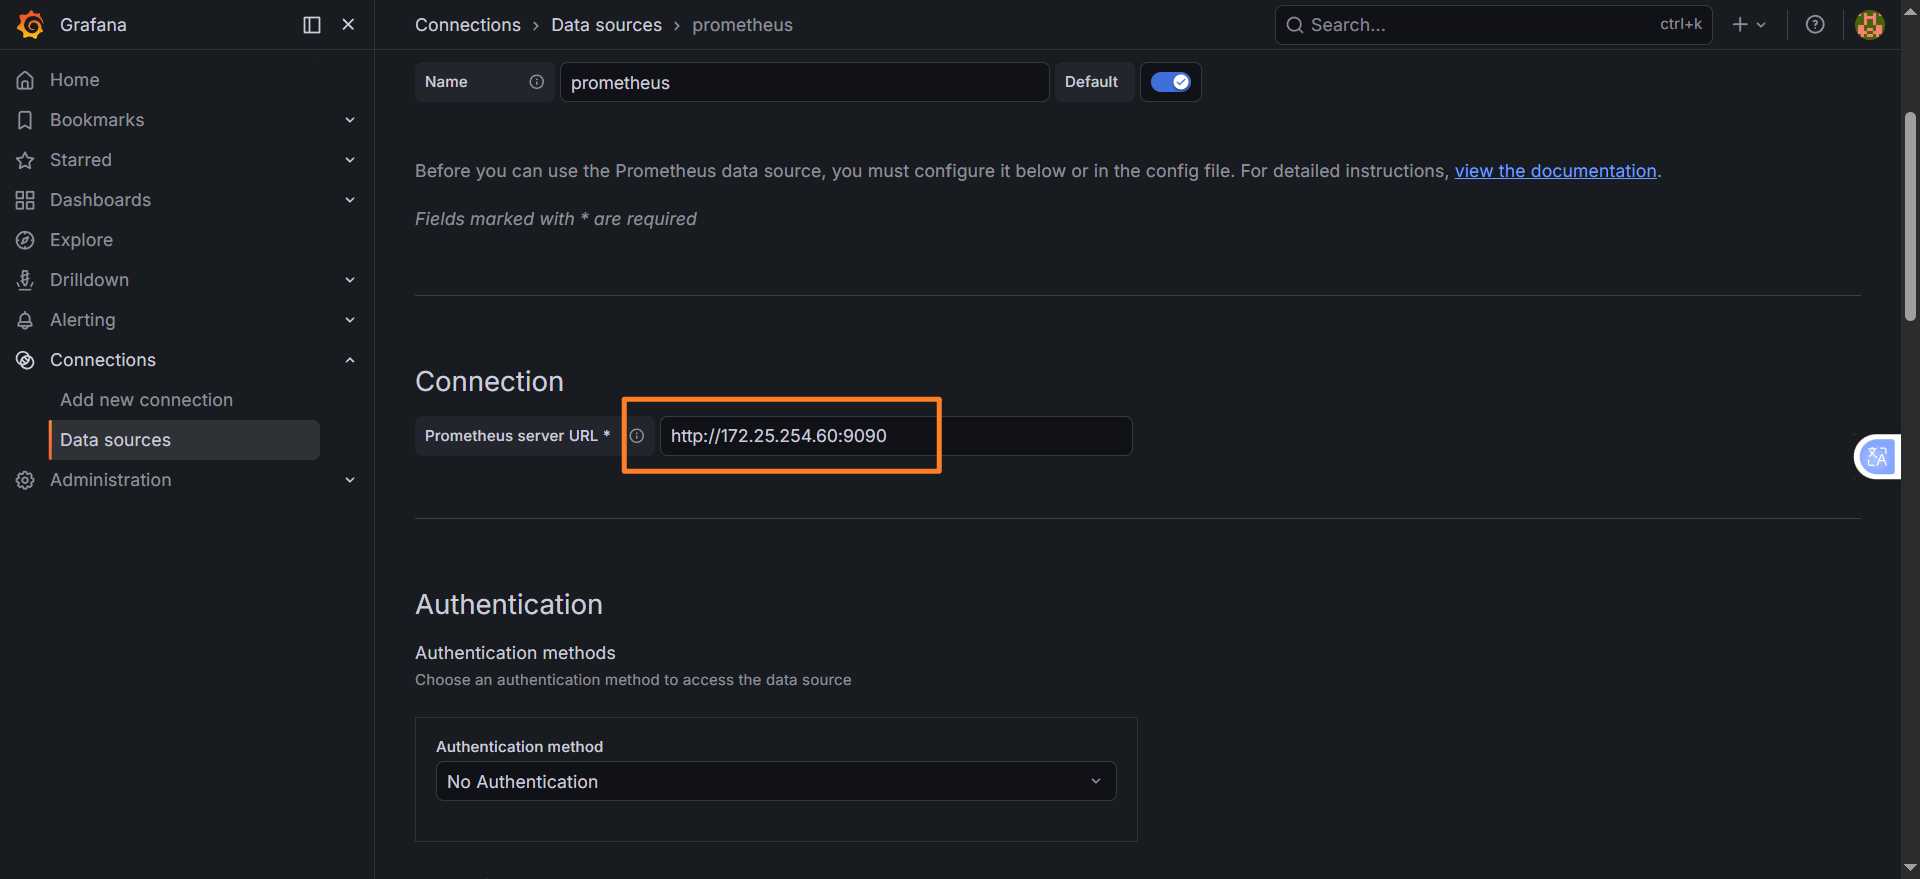
-
核心配置:
- URL :
http://172.25.254.60:9090(必须填写监控服务器 IP,避免localhost) - Scrape Interval: 15s(与 Prometheus 配置一致)
- URL :
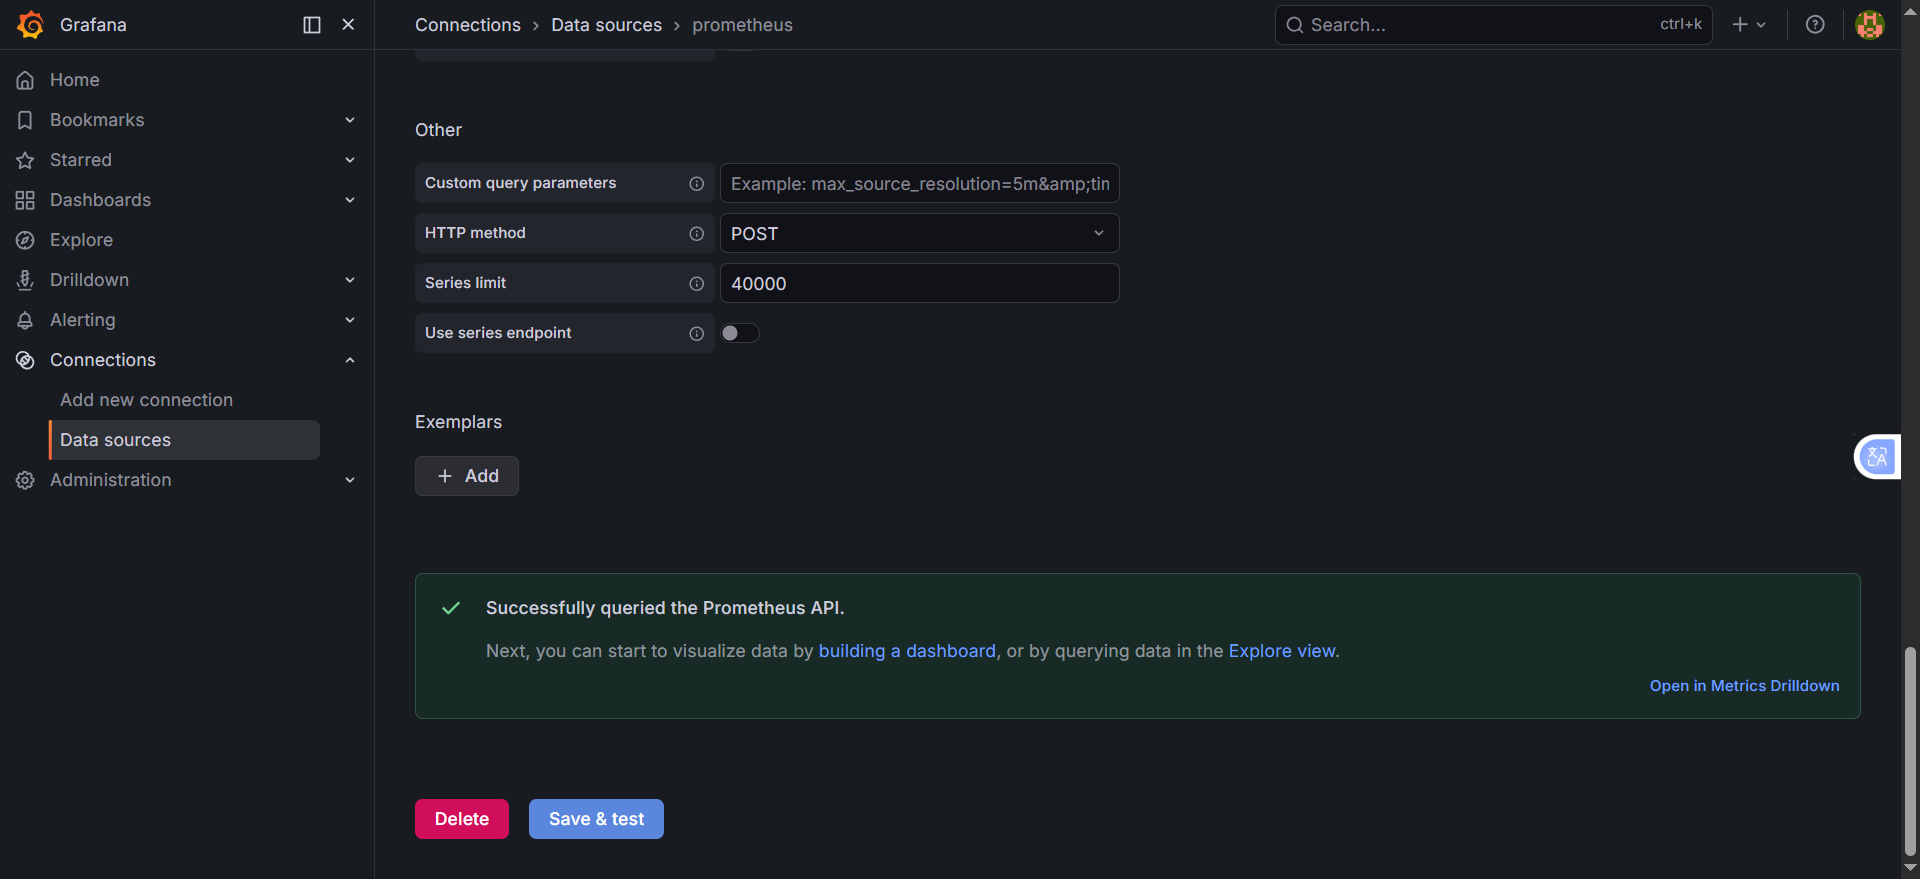
-
点击 Save & Test
✅ 提示
Data source is working表示成功;❌ 失败排查:检查 Prometheus 是否启动、9090 端口是否监听、网络是否互通。
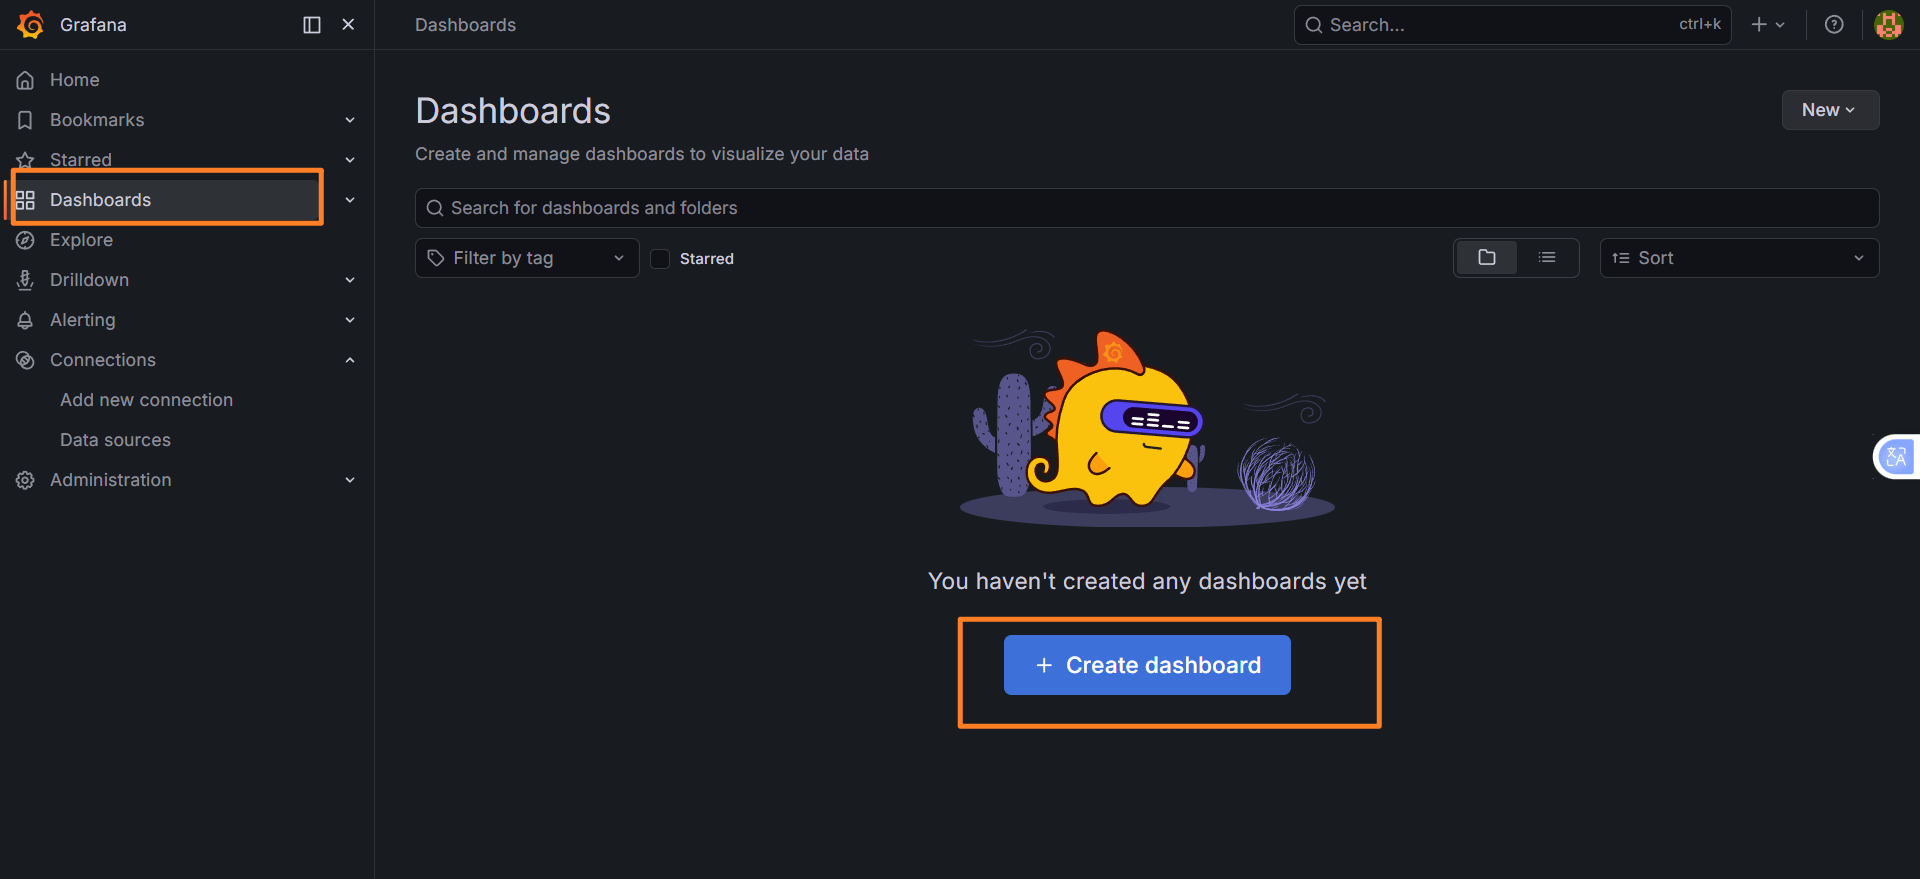
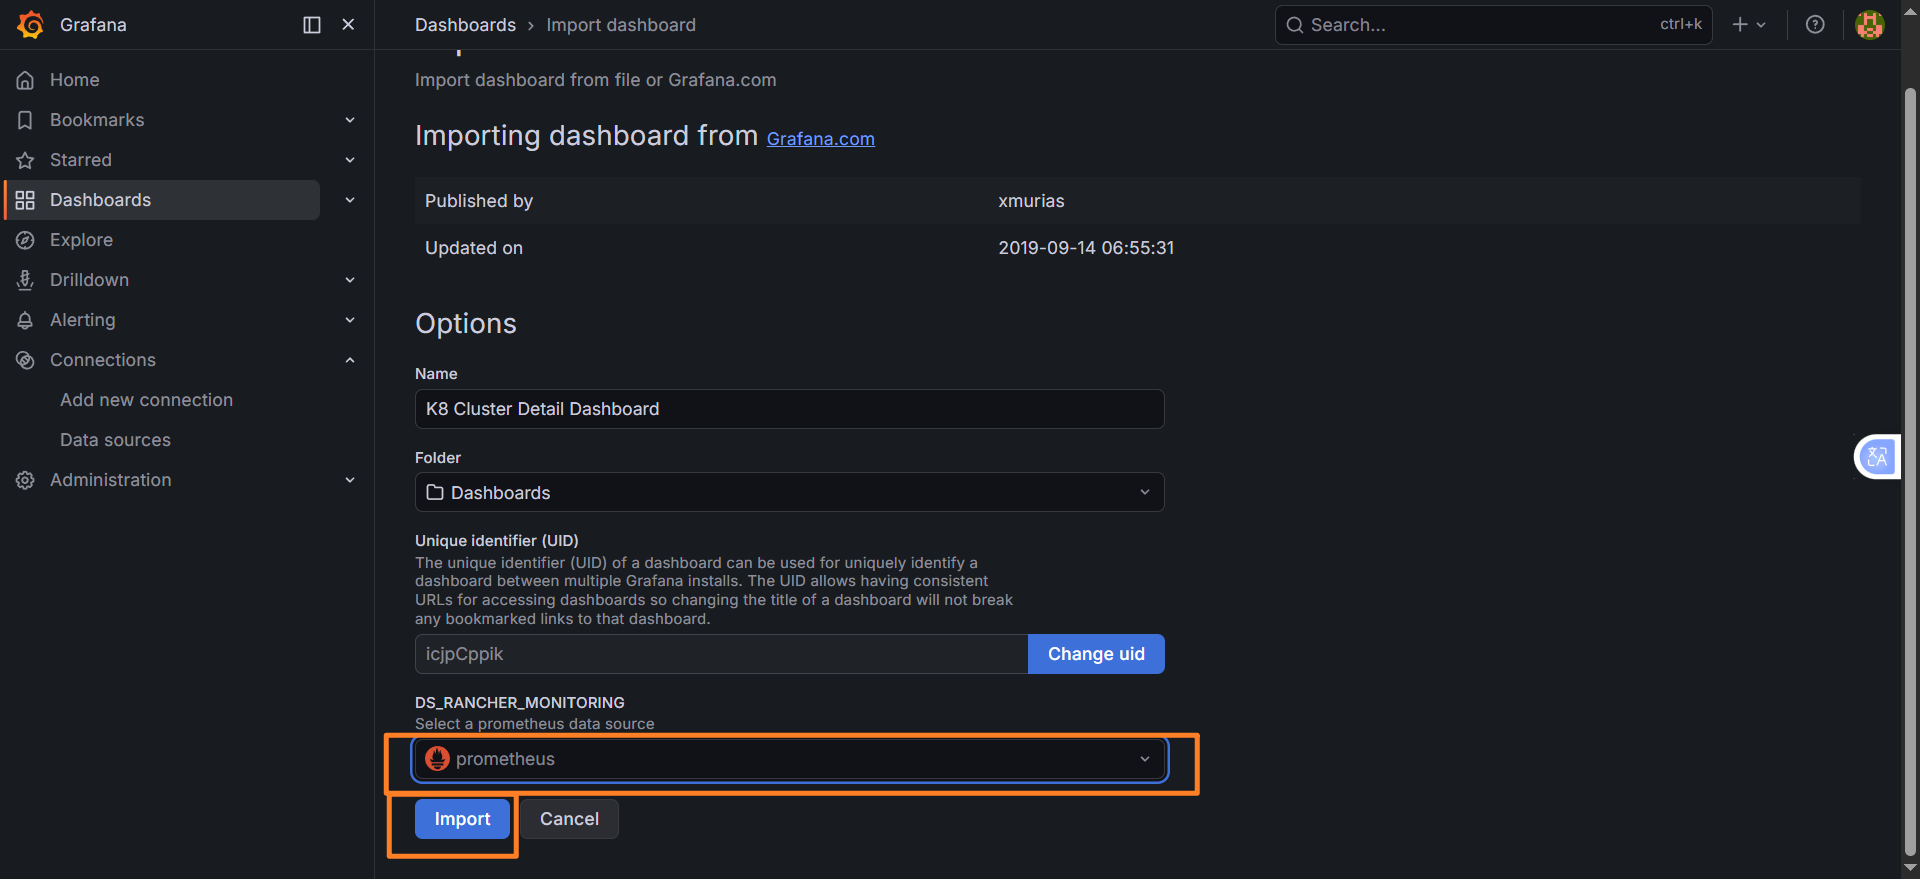
步骤 3:导入监控面板
方式 1:在线导入(服务器需联网)
-
左侧菜单 → Dashboards → Import
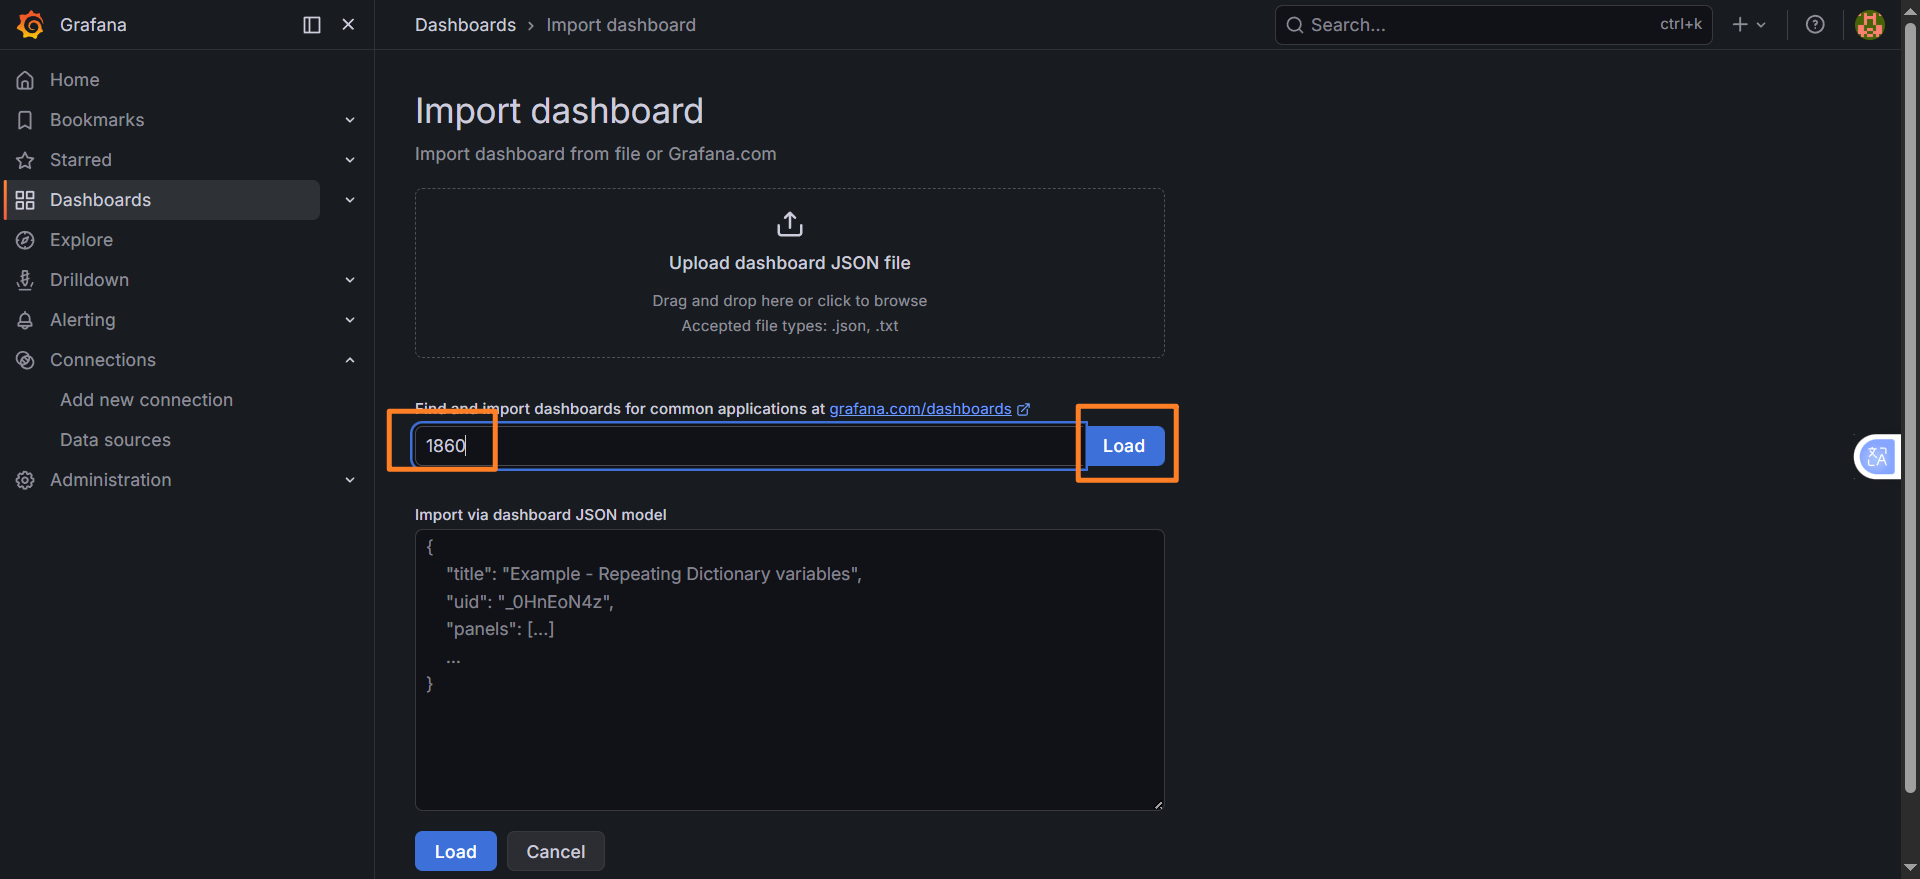
-
输入推荐面板 ID,点击
Load:
1860- Node Exporter Full(系统全维度监控,推荐)15869- Prometheus Blackbox Exporter(网络探测)10856- HAProxy Metrics(HAProxy 专属监控)
-
选择已添加的 Prometheus 数据源,点击 Import。
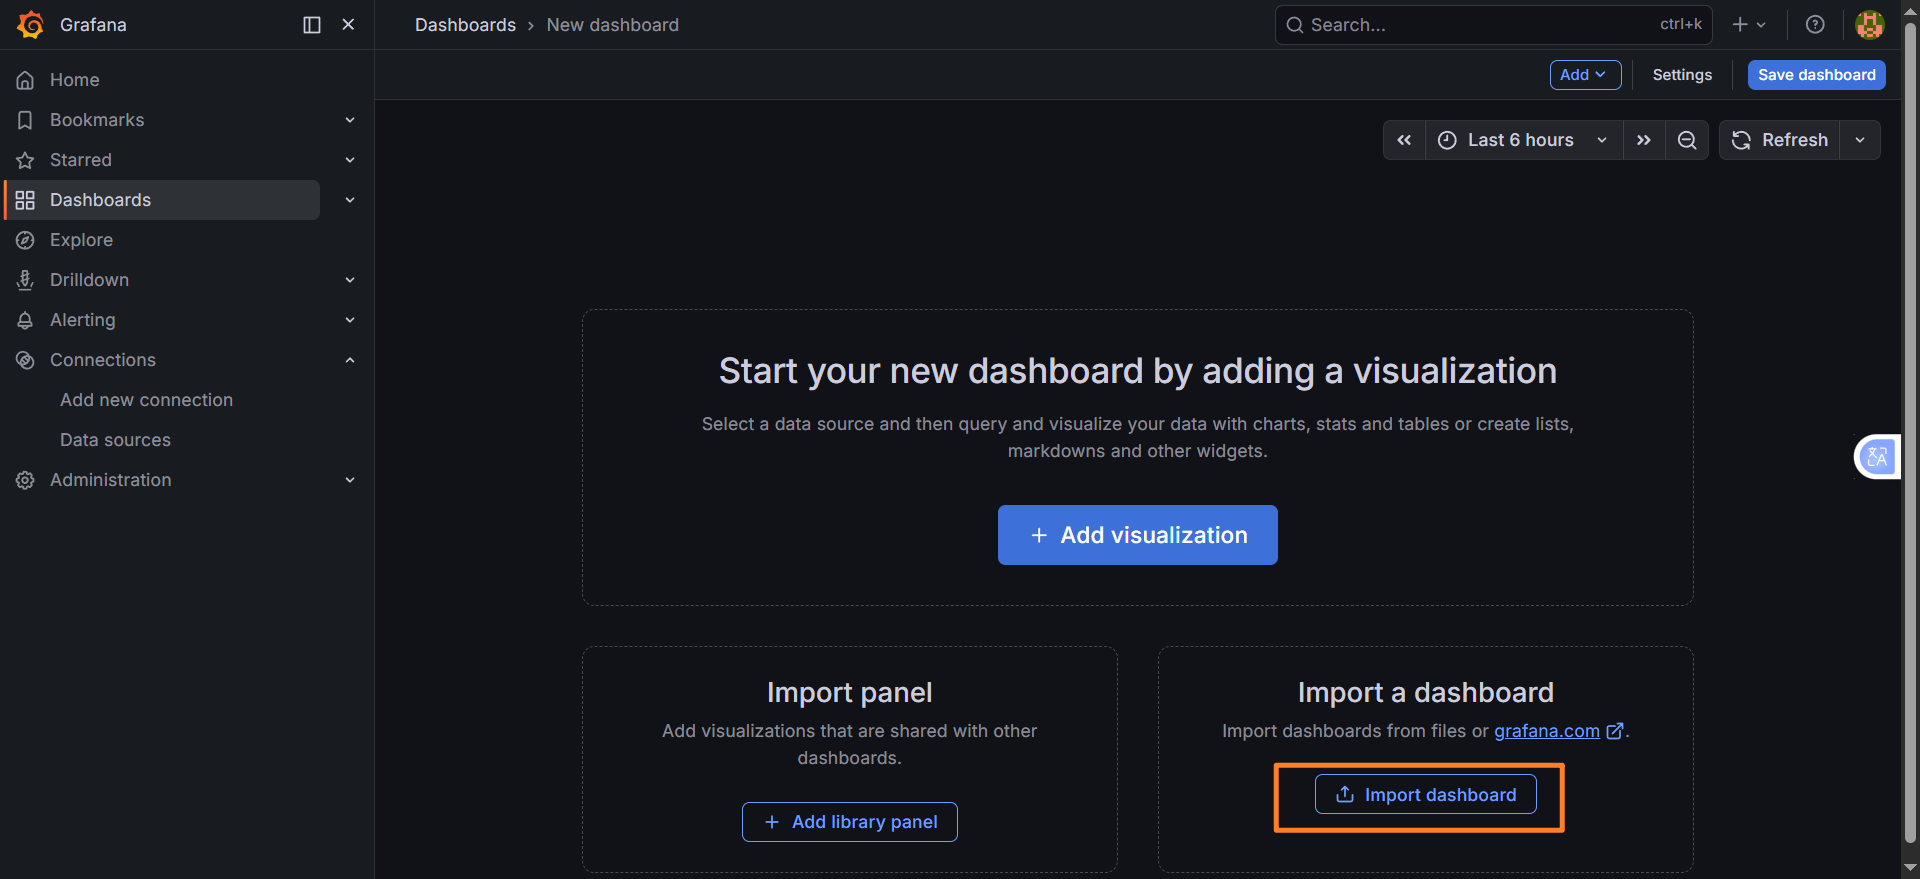
方式 2:离线导入(服务器无外网)
- 本地浏览器访问 Grafana Dashboards,搜索对应 ID 下载 JSON 文件;
- Grafana 页面点击 Upload JSON file,选择下载的文件,关联数据源后导入。
方式 3:手动创建面板(示例)
标准监控大盘布局
| 位置 | 面板标题 | PromQL | 可视化类型 |
|---|---|---|---|
| 左上 | 服务器 CPU 使用率 | 100 - (avg by (instance) (rate(node_cpu_seconds_total{mode="idle"}[1m])) * 100) |
Time series |
| 右上 | 服务器内存使用率 | 100 - (node_memory_MemAvailable_bytes / node_memory_MemTotal_bytes * 100) |
Time series |
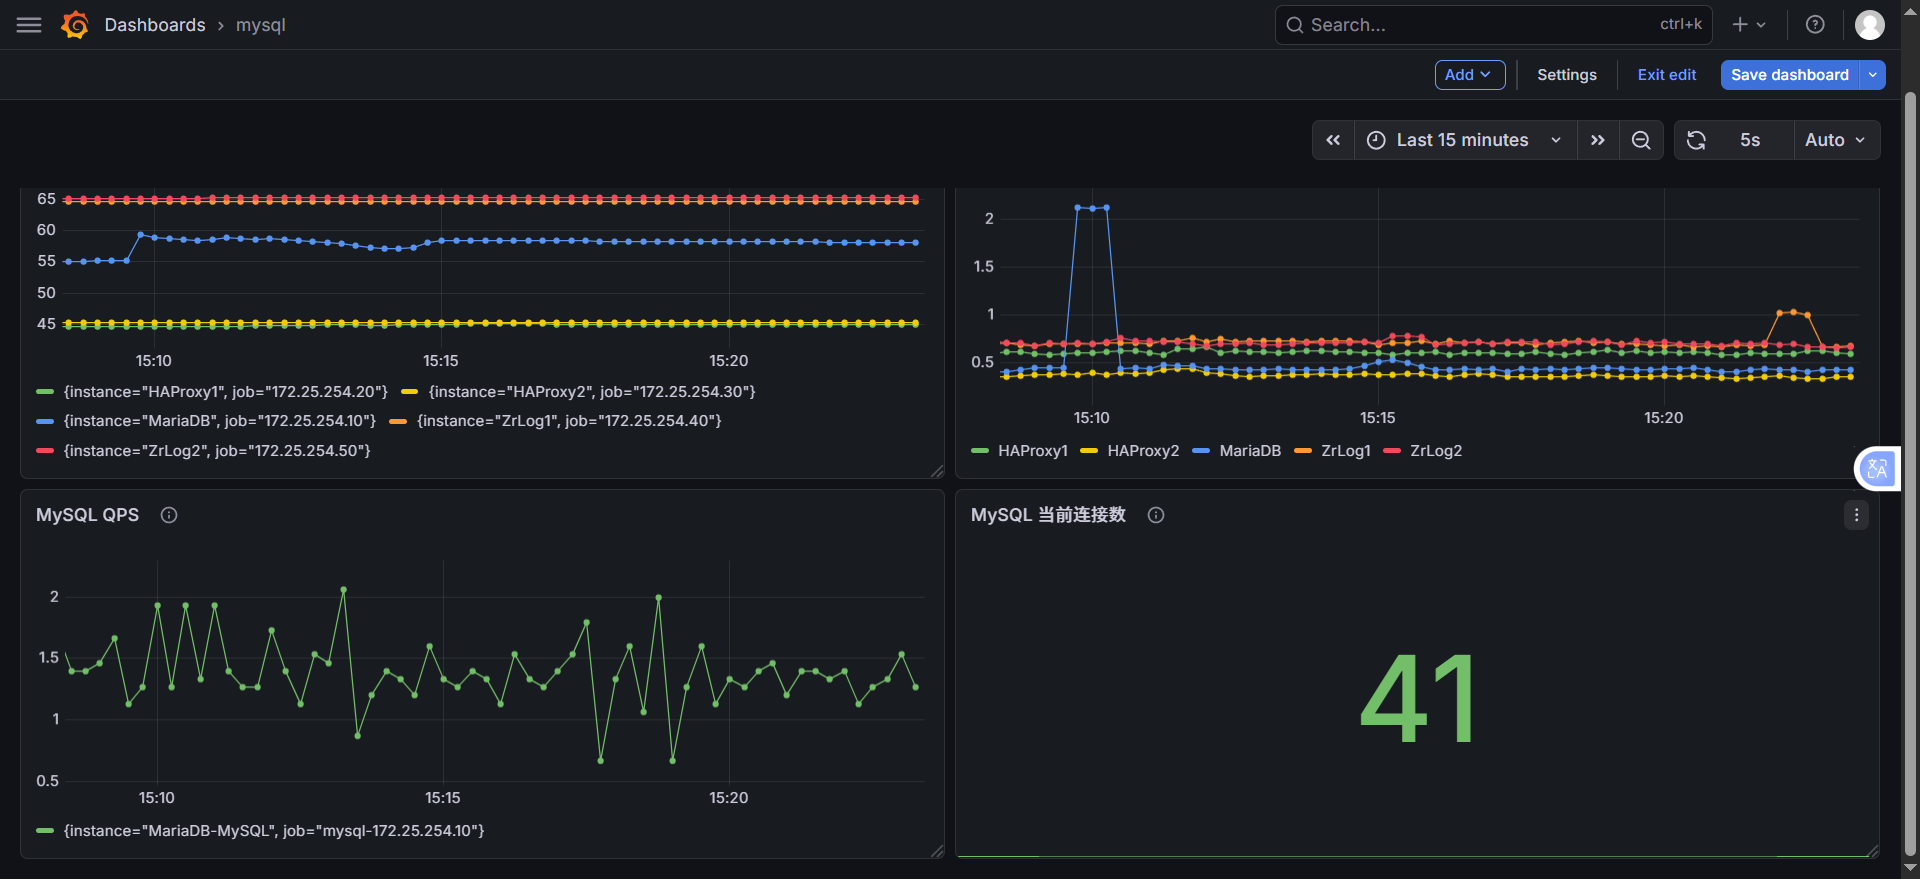
| 左下 | MySQL 当前连接数 | mysql_global_status_threads_connected |
Stat(大数字) |
| 右下 | MySQL QPS | irate(mysql_global_status_queries[5m]) |
Time series |
操作步骤:
-
左侧菜单 → Dashboards → New Dashboard
-
点击 Add → Visualization ,选择 Prometheus
-
在查询框输入对应 PromQL 语句,点击 Apply 生成图表。
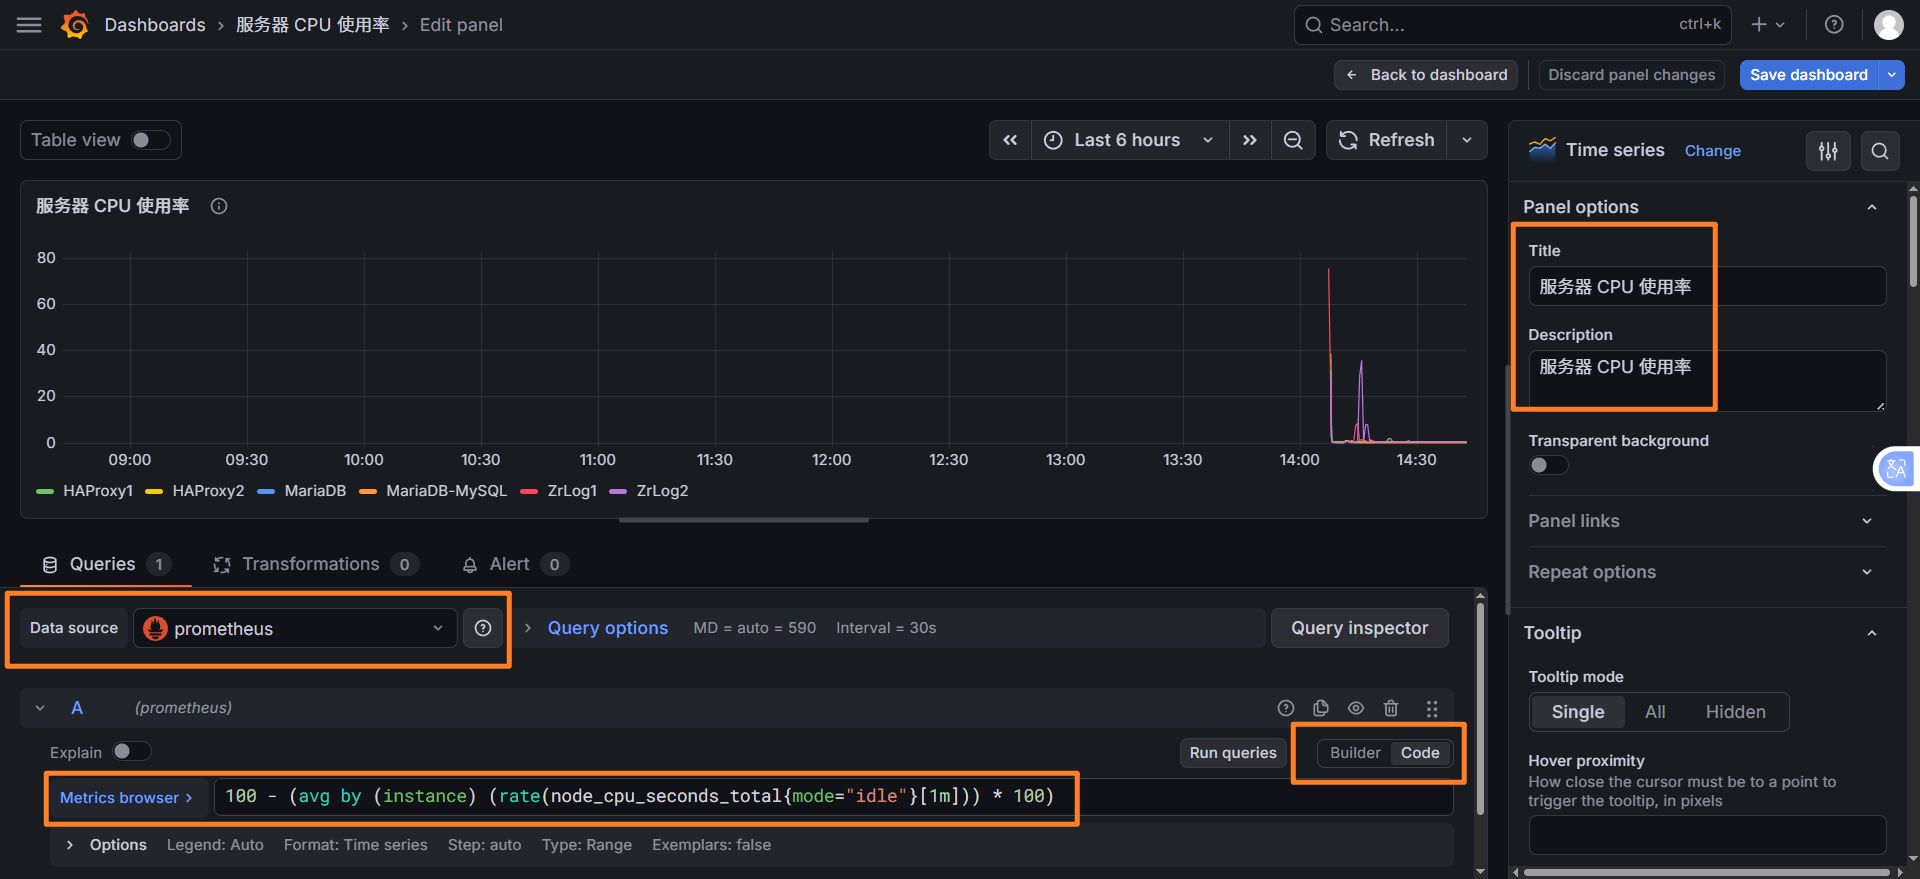
进入新建面板 :你已经在
New dashboard > Edit panel页面,数据源也已经选了prometheus,这一步没问题切换到 Code 模式 :点击
Code按钮,切换为手动输入模式输入 PromQL 语句:在文本框中输入你要的 PromQL,比如:
- 服务器 CPU 使用率:
100 - (avg by (instance) (irate(node_cpu_seconds_total{mode="idle"}[5m])) * 100) - MySQL 连接数:
mysql_global_status_threads_connected - 内存使用率:
100 - (node_memory_MemAvailable_bytes / node_memory_MemTotal_bytes * 100)
执行查询 :点击
Run queries,就能看到数据,图表自动生成保存面板 :点击右上角
Save dashboard保存即可 - 服务器 CPU 使用率:
步骤 4:查看监控数据
- 左侧菜单 → Dashboards → Browse
- 选择导入 / 创建的面板,即可查看所有被监控节点的实时数据。
- 关键避坑
- 绝对不要把不同维度的指标放在同一个面板(比如 CPU% 和连接数个),会导致图表尺度混乱,完全没法看
- 每个面板只做一件事:一个面板只监控一个维度(CPU / 内存 / 磁盘 / MySQL),是专业监控的标准做法
- 拆分后,每个面板可以单独设置时间范围、单位、告警,灵活性更高
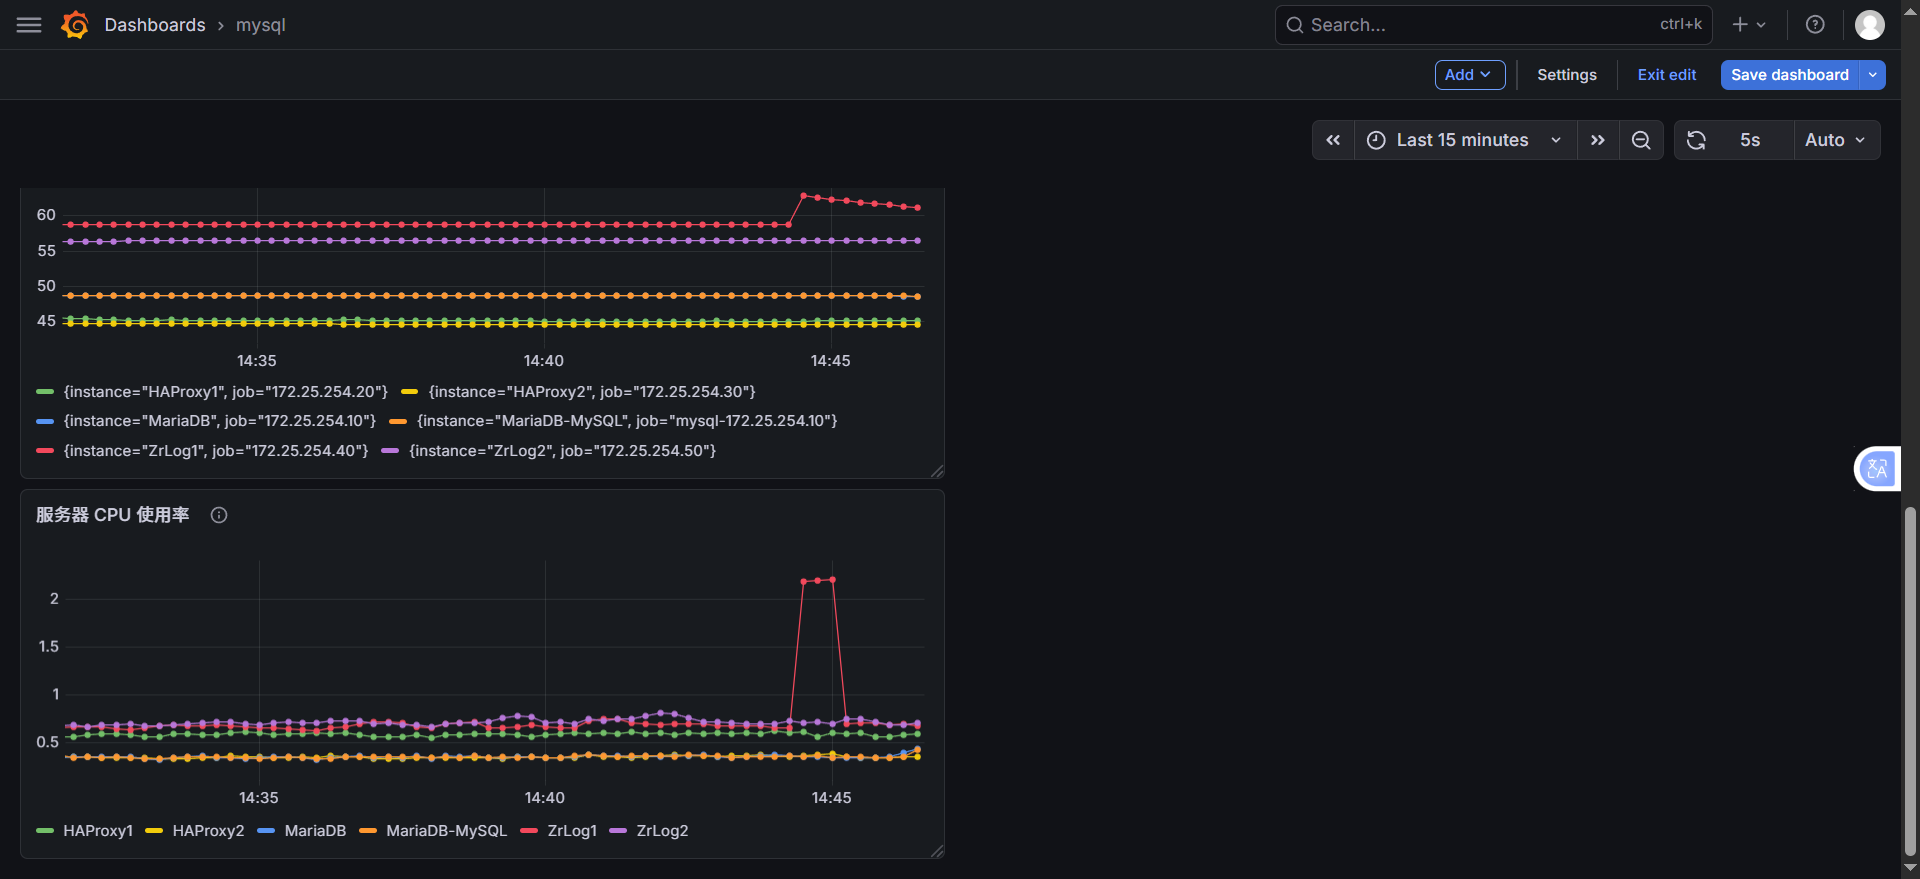
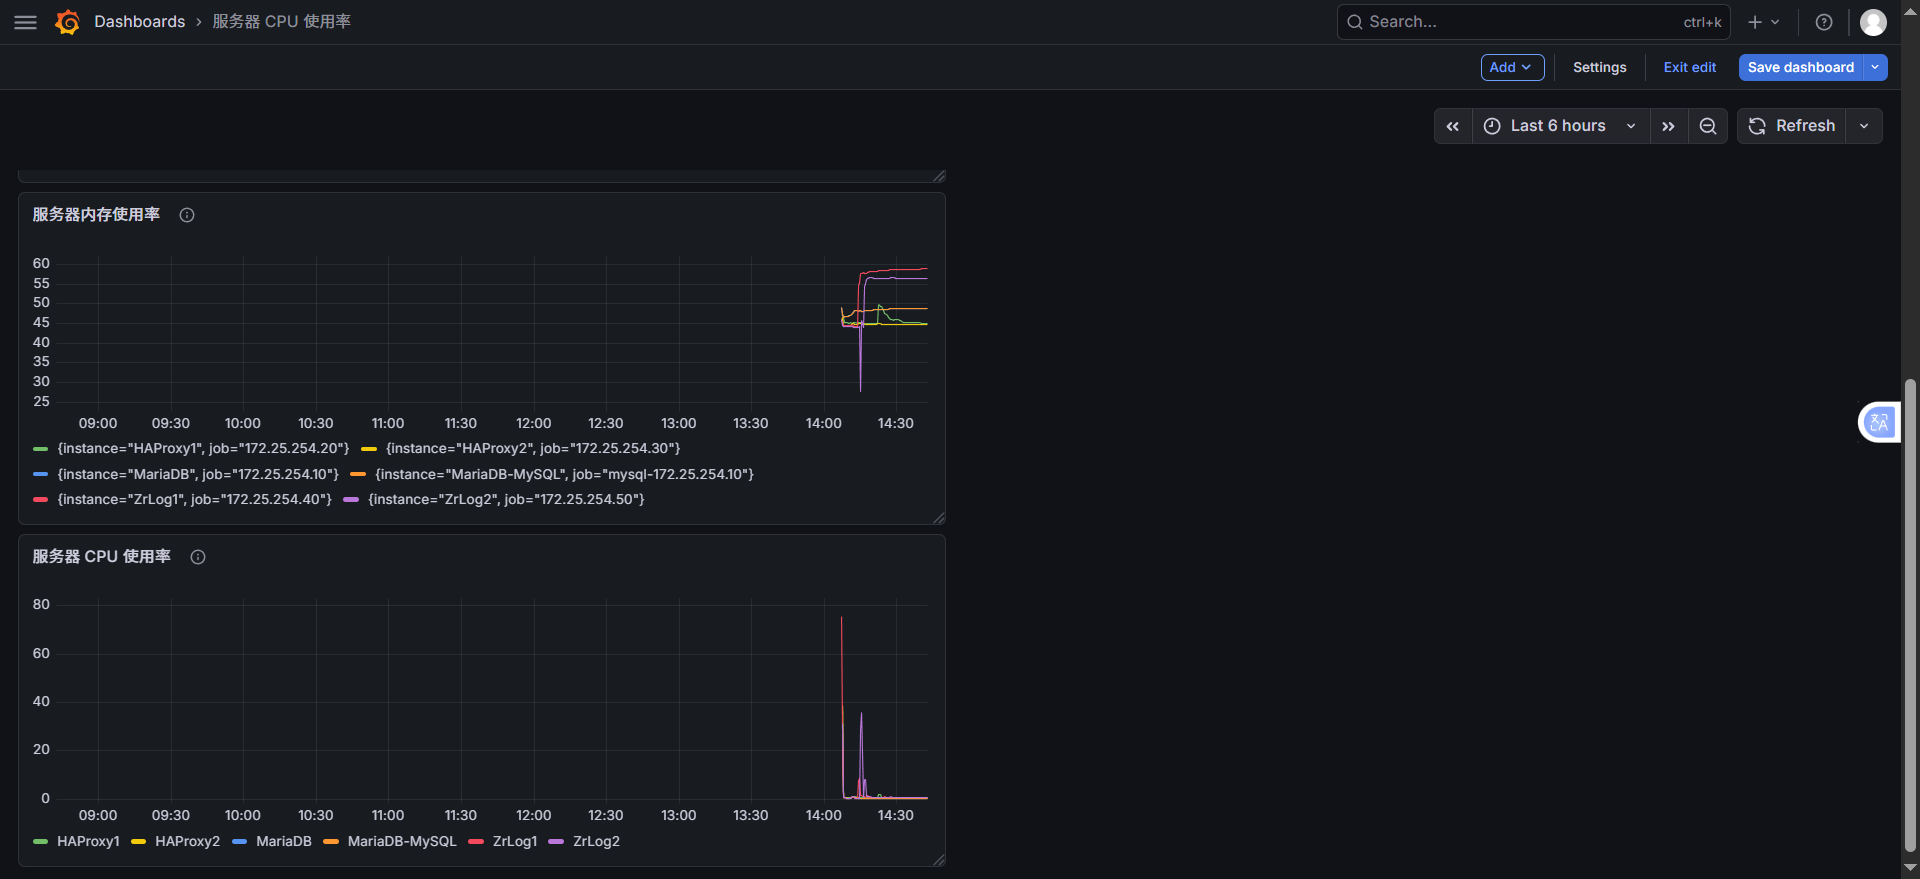
拆分后,你的仪表盘会变成两个独立面板,清晰不混乱:
| 面板位置 | 面板标题 | 监控内容 | 指标类型 |
|---|---|---|---|
| 上半部分 | 服务器 CPU 使用率 | 5 台服务器的 CPU 使用率 | 系统指标 |
| 下半部分 | MySQL 当前连接数 | MariaDB 数据库的实时连接数 | 数据库指标 |
# 安装ab工具(若没有)
dnf install -y httpd-tools

# 压测ZrLog,100并发,10000请求
ab -n 10000 -c 100 http://172.25.254.100/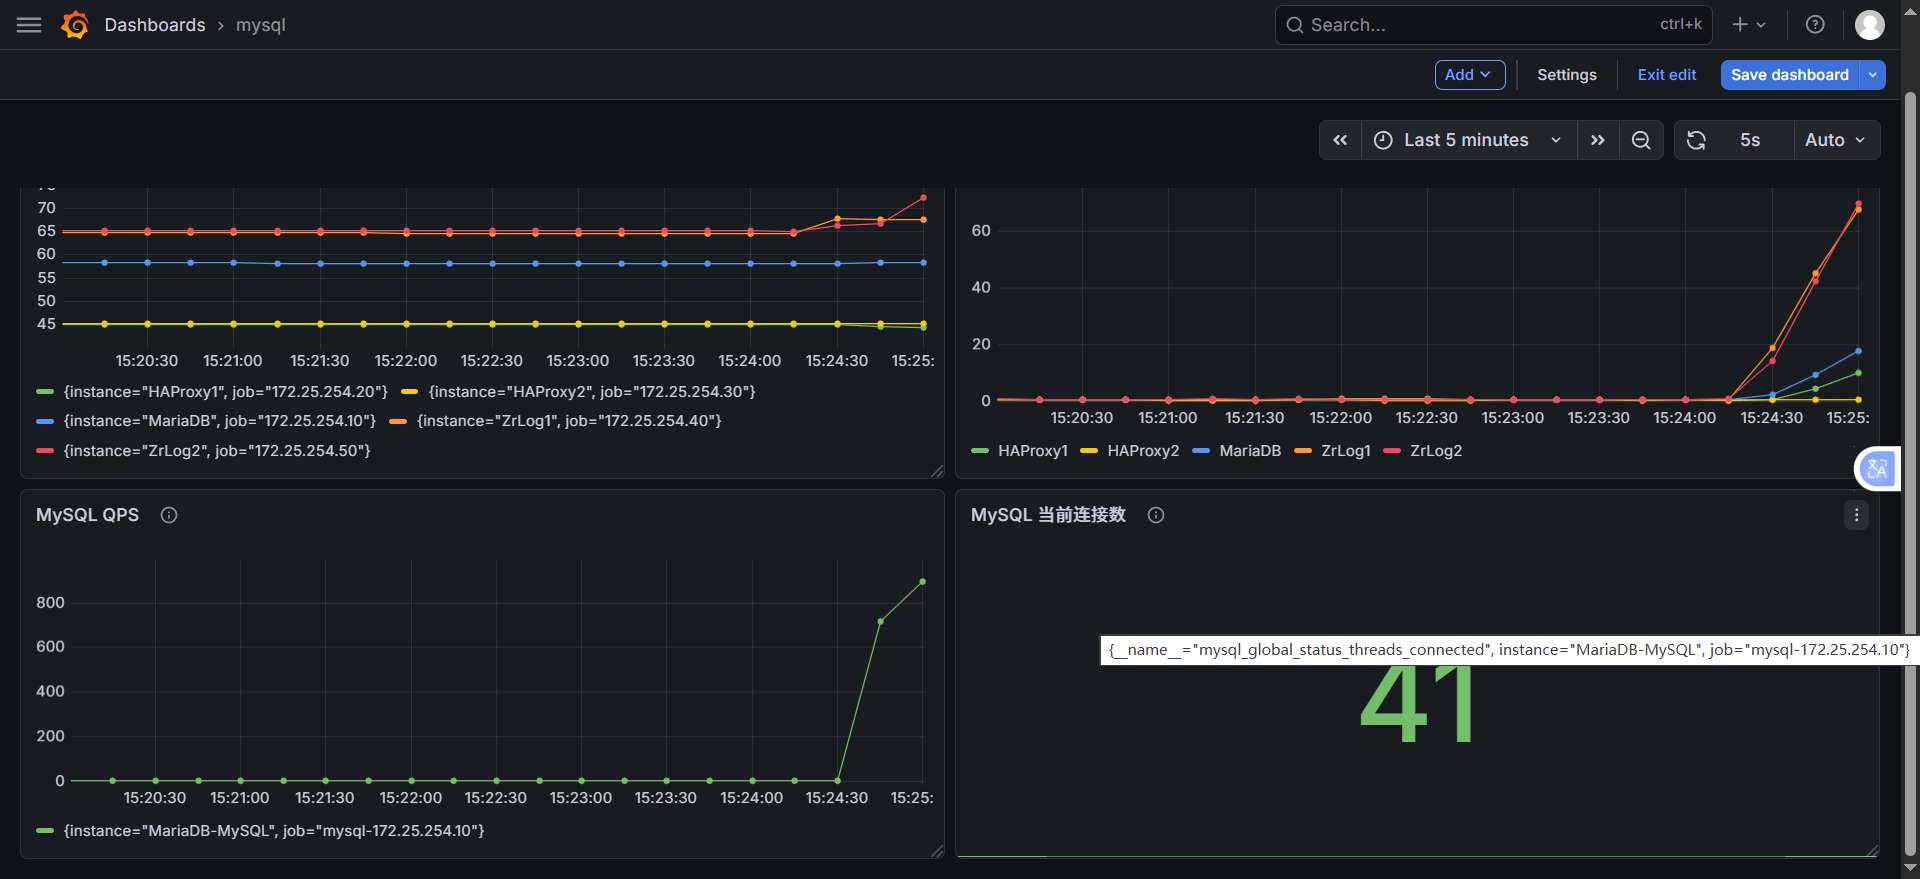
3.3 Grafana面板优化(让它专业、易读)
1. 拆分面板(核心优化,必须做)
一个面板只放一个维度的指标,不要混放:
面板 1:服务器 CPU 使用率(保留你当前的 PromQL)
100 - (avg by (instance) (rate(node_cpu_seconds_total{mode="idle"}[1m])) * 100)
- 可视化:
Time series(折线图)- 标题:
服务器CPU使用率- 单位:
Percent (0-100)- 图例:改为
{``{instance}},只显示服务器 IP / 别名面板 2:服务器内存使用率(新增)
100 - (node_memory_MemAvailable_bytes / node_memory_MemTotal_bytes * 100)
- 可视化:
Time series- 标题:
服务器内存使用率- 单位:
Percent (0-100)面板 3:MySQL 连接数(单独面板)
mysql_global_status_threads_connected{instance="172.25.254.10:9104"}
- 可视化:
Stat(大数字面板)或Time series- 标题:
MySQL当前连接数- 单位:
Short(显示数字)面板 4:MySQL QPS(新增,监控数据库性能)
irate(mysql_global_status_queries[5m])
- 可视化:
Time series- 标题:
MySQL QPS
2. 优化图表样式(让它更专业)
(1)修改时间范围
- 右上角
Last 6 hours→ 改为Last 30 minutes,只看最近有数据的时间段,图表更紧凑- 等监控运行 24 小时后,再改回
Last 24 hours看长期趋势(2)优化图例
- 在
Options→Legend中,输入{``{instance}},只显示服务器 IP / 别名,去掉冗余的job标签- 比如:
HAProxy1、HAProxy2、ZrLog1、ZrLog2、MariaDB,一目了然(3)添加单位
- 在
Options→Unit中,选择Percent (0-100),让图表显示%,不用自己算- MySQL 面板选择
Short,显示数字(4)修改面板标题
- 右侧
Panel options→Title,把New panel改成服务器CPU使用率,保存后看板更清晰
四、看板的正确使用姿势(运维视角)
1. 日常巡检(看什么)
- CPU 使用率:正常服务器空载在 10%-30%,持续超过 80% 说明 CPU 负载过高,需要排查进程
- 内存使用率:正常在 30%-60%,持续超过 90% 说明内存不足,会导致 OOM
- MySQL 连接数:正常在 10-50 之间,突然飙升说明有连接泄漏 / 异常请求
- MySQL QPS:正常业务平稳,突然飙升说明有流量攻击 / 异常查询
2. 故障排查(怎么用)
- 服务器卡顿:看 CPU / 内存使用率,定位是哪台服务器负载高
- 网站打不开:看 HAProxy 节点的 CPU / 网络,确认负载均衡是否正常
- 数据库慢:看 MySQL 连接数、QPS、慢查询指标,定位数据库性能问题
五、给你一份「标准服务器监控大盘」布局
面板位置 指标 PromQL 可视化类型 左上 CPU 使用率 100 - (avg by (instance) (irate(node_cpu_seconds_total{mode="idle"}[5m])) * 100)Time series 右上 内存使用率 100 - (node_memory_MemAvailable_bytes / node_memory_MemTotal_bytes * 100)Time series 左中 磁盘使用率 100 - (node_filesystem_avail_bytes{mountpoint="/"} / node_filesystem_size_bytes{mountpoint="/"} * 100)Time series 右中 网络流量 irate(node_network_receive_bytes_total[5m])/1024/1024Time series 左下 MySQL 连接数 mysql_global_status_threads_connectedStat 右下 MySQL QPS irate(mysql_global_status_queries[5m])Time series
四、验证监控
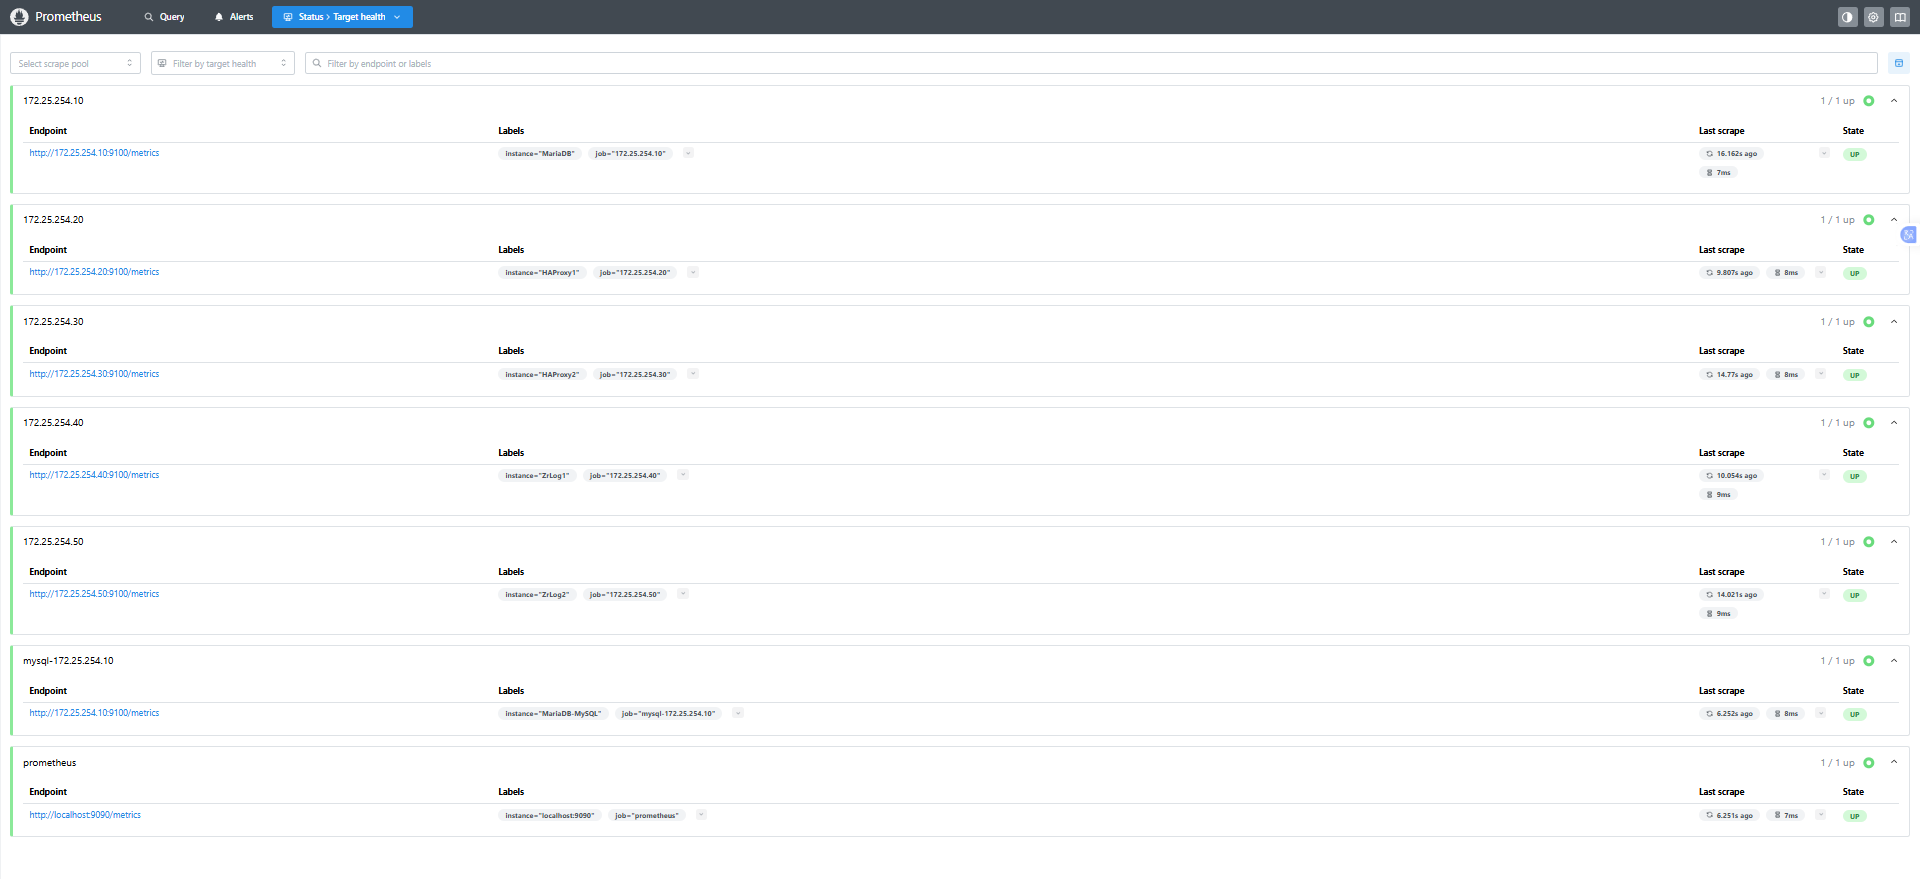
4.1 检查 Prometheus Targets
-
浏览器访问:
http://172.25.254.60:9090/targets -
所有 Target 状态需为 UP:
- prometheus-server
- HAProxy1 (172.25.254.20)
- ZrLog1 (172.25.254.40)
- MariaDB (172.25.254.10)
- HAProxy2 (172.25.254.30)
- ZrLog2 (172.25.254.60)
-
若 Target 为 DOWN:
- 检查目标节点 node_exporter 是否启动;
- 检查目标节点 9100 端口是否监听;
- 检查监控服务器与目标节点网络是否互通(ping + telnet 目标 IP 9100)。
4.1 补充:验证 MySQL 监控状态
访问 Prometheus Targets:
http://172.25.254.60:9090/targets
检查:
mysql-172.25.254.10 (172.25.254.10:9104) → 状态 UP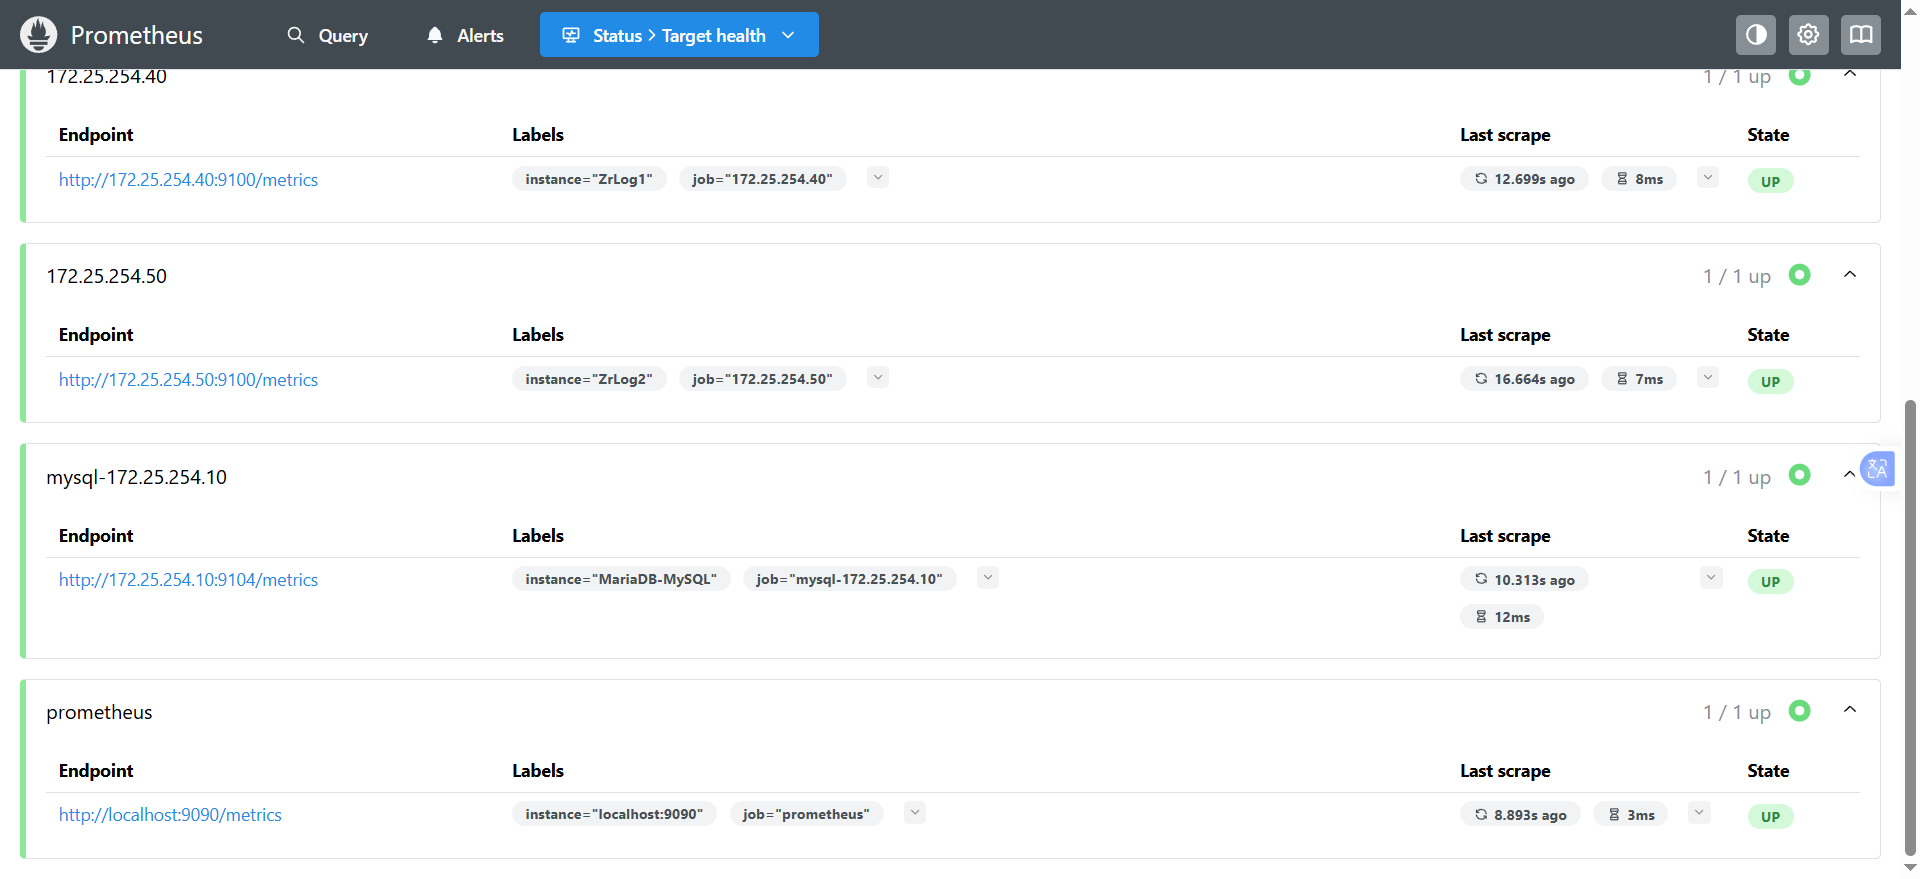
4.2 验证监控指标
-
Prometheus 页面点击 Graph,输入以下指标验证数据是否存在:
node_cpu_seconds_total(CPU 使用时间)node_memory_MemTotal_bytes(内存总量)node_disk_read_bytes_total(磁盘读取)node_network_receive_bytes_total(网络接收)
-
若无数据:
- 检查 Prometheus 配置文件中 targets IP 是否正确;
- 检查 scrape_interval 是否过短(等待 15s 后重试);
- 查看 Prometheus 日志是否有抓取错误。
五、常用查询
5.1 系统指标
# CPU 使用率(按实例分组,5分钟均值)
100 - (avg by (instance) (rate(node_cpu_seconds_total{mode="idle"}[5m])) * 100)

# 内存使用率(按实例分组)
(node_memory_MemTotal_bytes - node_memory_MemAvailable_bytes) / node_memory_MemTotal_bytes * 100

# 磁盘使用率(根目录,按实例分组)
100 - (node_filesystem_avail_bytes{mountpoint="/"} / node_filesystem_size_bytes{mountpoint="/"} * 100)

# 系统负载(按实例分组)
node_load1 / count(node_cpu_seconds_total{mode="idle"}) by (instance)
5.2 网络指标
# 网络接收速率 (MB/s,按实例+网卡分组)
rate(node_network_receive_bytes_total[1m]) / 1024 / 1024

# 网络发送速率 (MB/s,按实例+网卡分组)
rate(node_network_transmit_bytes_total[1m]) / 1024 / 1024
5.3 进程指标
# 系统运行时间(秒)
time() - node_time_seconds{} + node_boot_time_seconds{}

# 进程打开文件数(按实例分组)
process_open_fds{}
六、端口说明
| 服务 | 端口 | 用途 | 放行规则(若开启防火墙) |
|---|---|---|---|
| Prometheus | 9090 | 监控数据查询 | firewall-cmd --add-port=9090/tcp --permanent |
| Grafana | 3000 | 可视化界面 | firewall-cmd --add-port=3000/tcp --permanent |
| node_exporter | 9100 | 系统指标导出 | firewall-cmd --add-port=9100/tcp --permanent |
| mysqld_exporter | 9104 | MySQL 数据库指标导出 | firewall-cmd --add-port=9104/tcp --permanent |
七、监控架构图
八、常见故障排查
8.1 Prometheus 启动失败
| 现象 | 排查步骤 |
|---|---|
| 端口占用 | `netstat -antlupe |
| 配置语法错误 | promtool check config /root/prometheus/prometheus.yml → 修正 YAML 缩进 / 语法 |
| 目录权限不足 | chmod 755 /root/prometheus -R → 重新启动 |
| 日志报错 | tail -20 /root/prometheus.log → 定位具体错误 |
8.2 Grafana 无法访问
| 现象 | 排查步骤 |
|---|---|
| 3000 端口未监听 | systemctl status grafana-server → 修复启动故障(如安装 libfontconfig 依赖) |
| 数据源连接失败 | 检查 Prometheus 是否启动、9090 端口是否互通、URL 是否填写正确 |
| 导入面板失败(离线) | 改用离线导入方式,上传 JSON 文件 |
8.3 node_exporter Target 显示 DOWN
| 现象 | 排查步骤 |
|---|---|
| 9100 端口未监听 | 目标节点执行 `ps -ef |
| 网络不通 | 监控服务器 ping 目标 IP + telnet 目标IP 9100 → 检查防火墙 / SELinux |
| 启动命令错误 | 确认启动命令绑定 0.0.0.0(而非 127.0.0.1) |
| 现象 | 排查步骤 |
|---|---|
| 端口占用 | `netstat -antlupe |
| 配置语法错误 | promtool check config /root/prometheus/prometheus.yml → 修正 YAML 缩进 / 语法 |
| 目录权限不足 | chmod 755 /root/prometheus -R → 重新启动 |
| 日志报错 | tail -20 /root/prometheus.log → 定位具体错误 |
8.2 Grafana 无法访问
| 现象 | 排查步骤 |
|---|---|
| 3000 端口未监听 | systemctl status grafana-server → 修复启动故障(如安装 libfontconfig 依赖) |
| 数据源连接失败 | 检查 Prometheus 是否启动、9090 端口是否互通、URL 是否填写正确 |
| 导入面板失败(离线) | 改用离线导入方式,上传 JSON 文件 |
8.3 node_exporter Target 显示 DOWN
| 现象 | 排查步骤 |
|---|---|
| 9100 端口未监听 | 目标节点执行 `ps -ef |
| 网络不通 | 监控服务器 ping 目标 IP + telnet 目标IP 9100 → 检查防火墙 / SELinux |
| 启动命令错误 | 确认启动命令绑定 0.0.0.0(而非 127.0.0.1) |