前言
Prometheus 默认的拉取模式难以监控批量、离线等短生命周期任务,而 Pushgateway 作为 Prometheus 的配套组件,可接收这类瞬时任务主动推送的指标,再由 Prometheus 统一拉取,形成完整监控闭环。
本文详解 Pushgateway 的安装配置(二进制包、Docker 两种方式)、Prometheus 对接方法,以及 Shell 和 Python 脚本推送自定义指标的实操案例,还介绍了通过 cpolar 实现内网 Pushgateway 公网访问的方案,帮助解决临时任务监控难题,提升系统可观测性。
1.安装条件
本次演示环境,我是在虚拟机上安装Linux系统来执行操作,以下是安装的软件及版本:
Oracle VirtualBox: 5.1.20 r114628 (Qt5.6.2)
System: entOS Linux release 7.9.2009 (Core)
Docker: 26.1.4
Prometheus: v3.5.0
PushGateway: 1.0.0
没有prometheus的小伙伴可以去cpolar官网参考这篇文章哦~:监控不再局域网!Cpolar 让 Prometheus 走出内网限制! - cpolar 极点云官网
2.PushGateway安装配置
2.1 二进制包安装
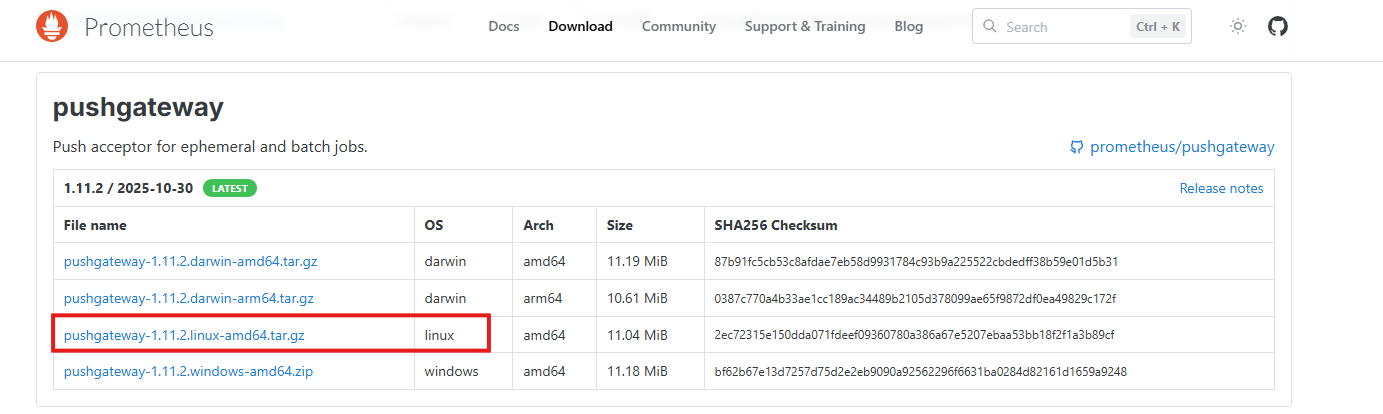
访问PushGateway官网,下载二进制包:
下载linux版本的:
下载完成后,上传到/app目录下:

上传成功后,我们为它解压:
shell
tar -zxvf pushgateway-1.11.2.linux-amd64.tar.gz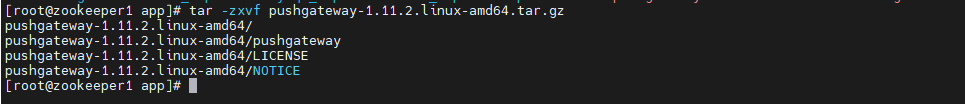
我这里为它重命名并删除压缩文件:
shell
mv pushgateway-1.11.2.linux-amd64 pushgateway
rm -rf pushgateway-1.11.2.linux-amd64.tar.gz
创建systemd服务文件:
shell
sudo vim /etc/systemd/system/pushgateway.service
shell
[Unit]
Description=Pushgateway for Prometheus
Documentation=https://github.com/prometheus/pushgateway
After=network-online.target

[Service]
Type=simple
User=prometheus
Group=prometheus
ExecStart=/app/pushgateway/pushgateway \
  --web.listen-address=:9091 \
  --web.enable-admin-api \
  --log.level=info
WorkingDirectory=/app/pushgateway
Restart=on-failure
RestartSec=5
StandardOutput=journal
StandardError=journal
SyslogIdentifier=pushgateway

[Install]
WantedBy=multi-user.target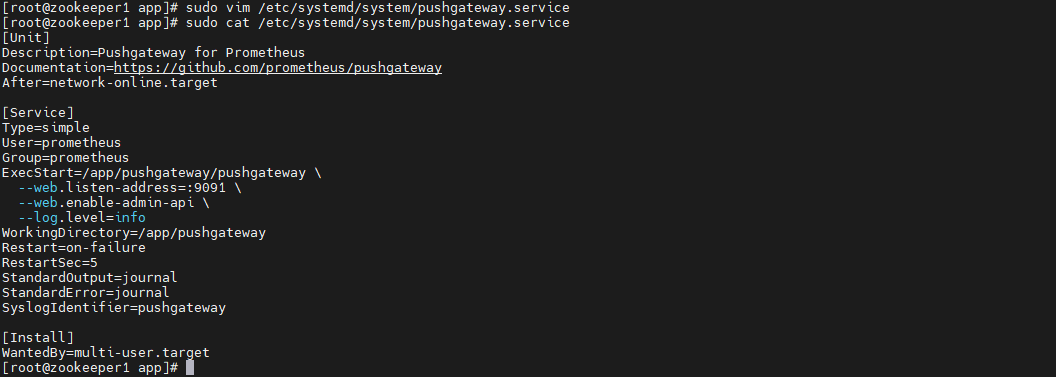
设置文件权限(确保二进制文件可执行,且属主正确):
shell
sudo chown -R prometheus:prometheus /app/pushgateway
sudo chmod +x /app/pushgateway/pushgateway
重载systemd并启动服务:
shell
# 重载配置
sudo systemctl daemon-reexec
sudo systemctl daemon-reload

# 启动并设置开机自启
sudo systemctl start pushgateway
sudo systemctl enable pushgateway

# 查看状态
sudo systemctl status pushgateway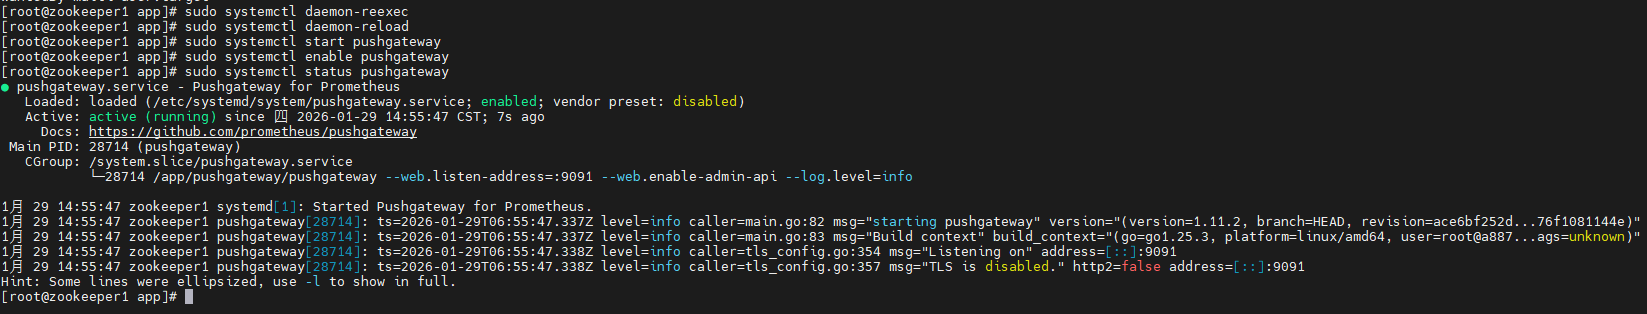
验证服务是否正常:
shell
# 检查进程
ps aux | grep pushgateway

# 访问指标端点(本地)
curl http://localhost:9091/metrics

# 查看日志
journalctl -u pushgateway -f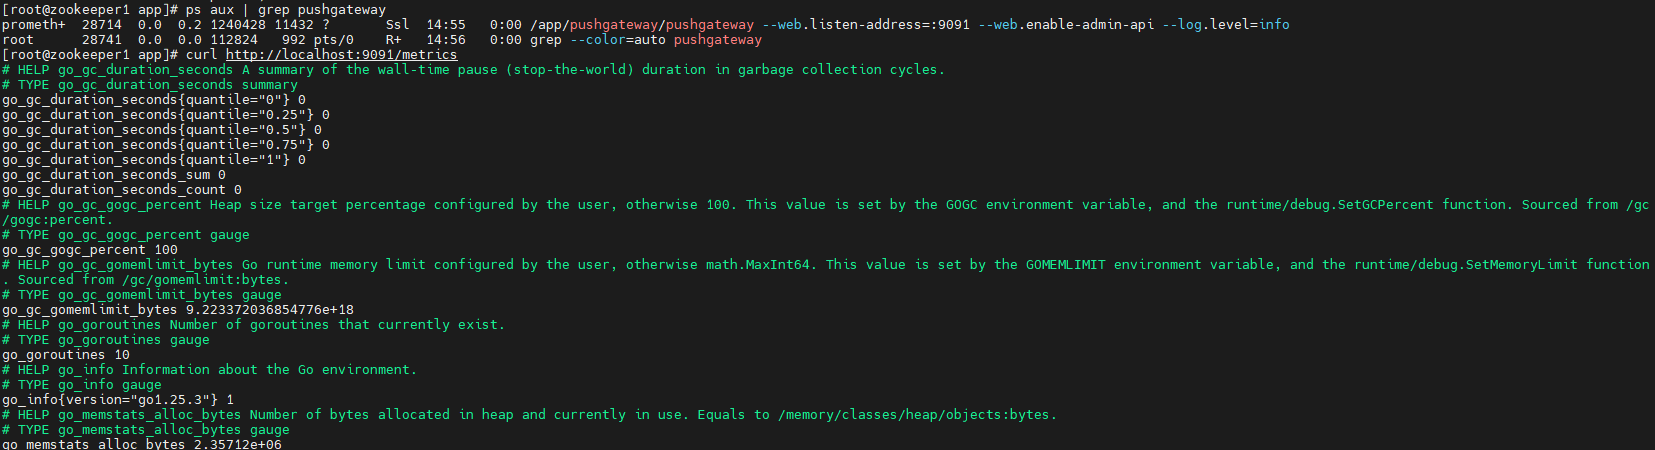
(可选)配置防火墙放行端口(如需外部访问):
shell
# CentOS 7 使用 firewalld
sudo firewall-cmd --permanent --add-port=9091/tcp
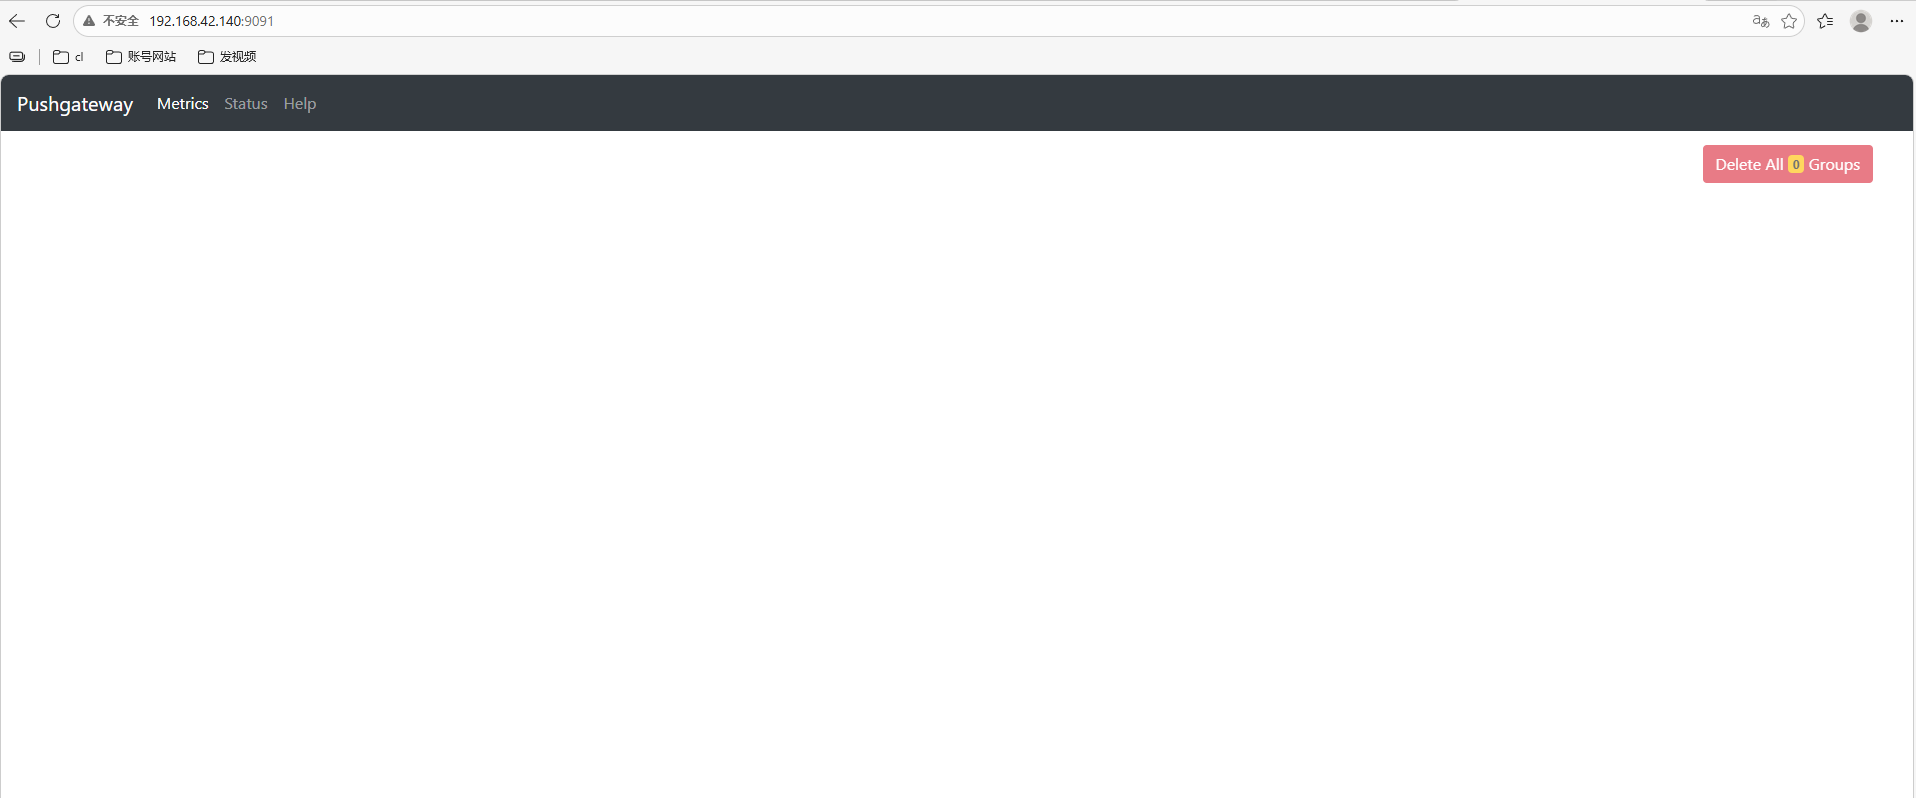
sudo firewall-cmd --reload此时浏览器访问 http://<ip>:9091 即可访问 UI 页面,只不过默认Metrics上没有任何数据展示,那是因为我们还没有往 PushGateway 上推送任何数据。
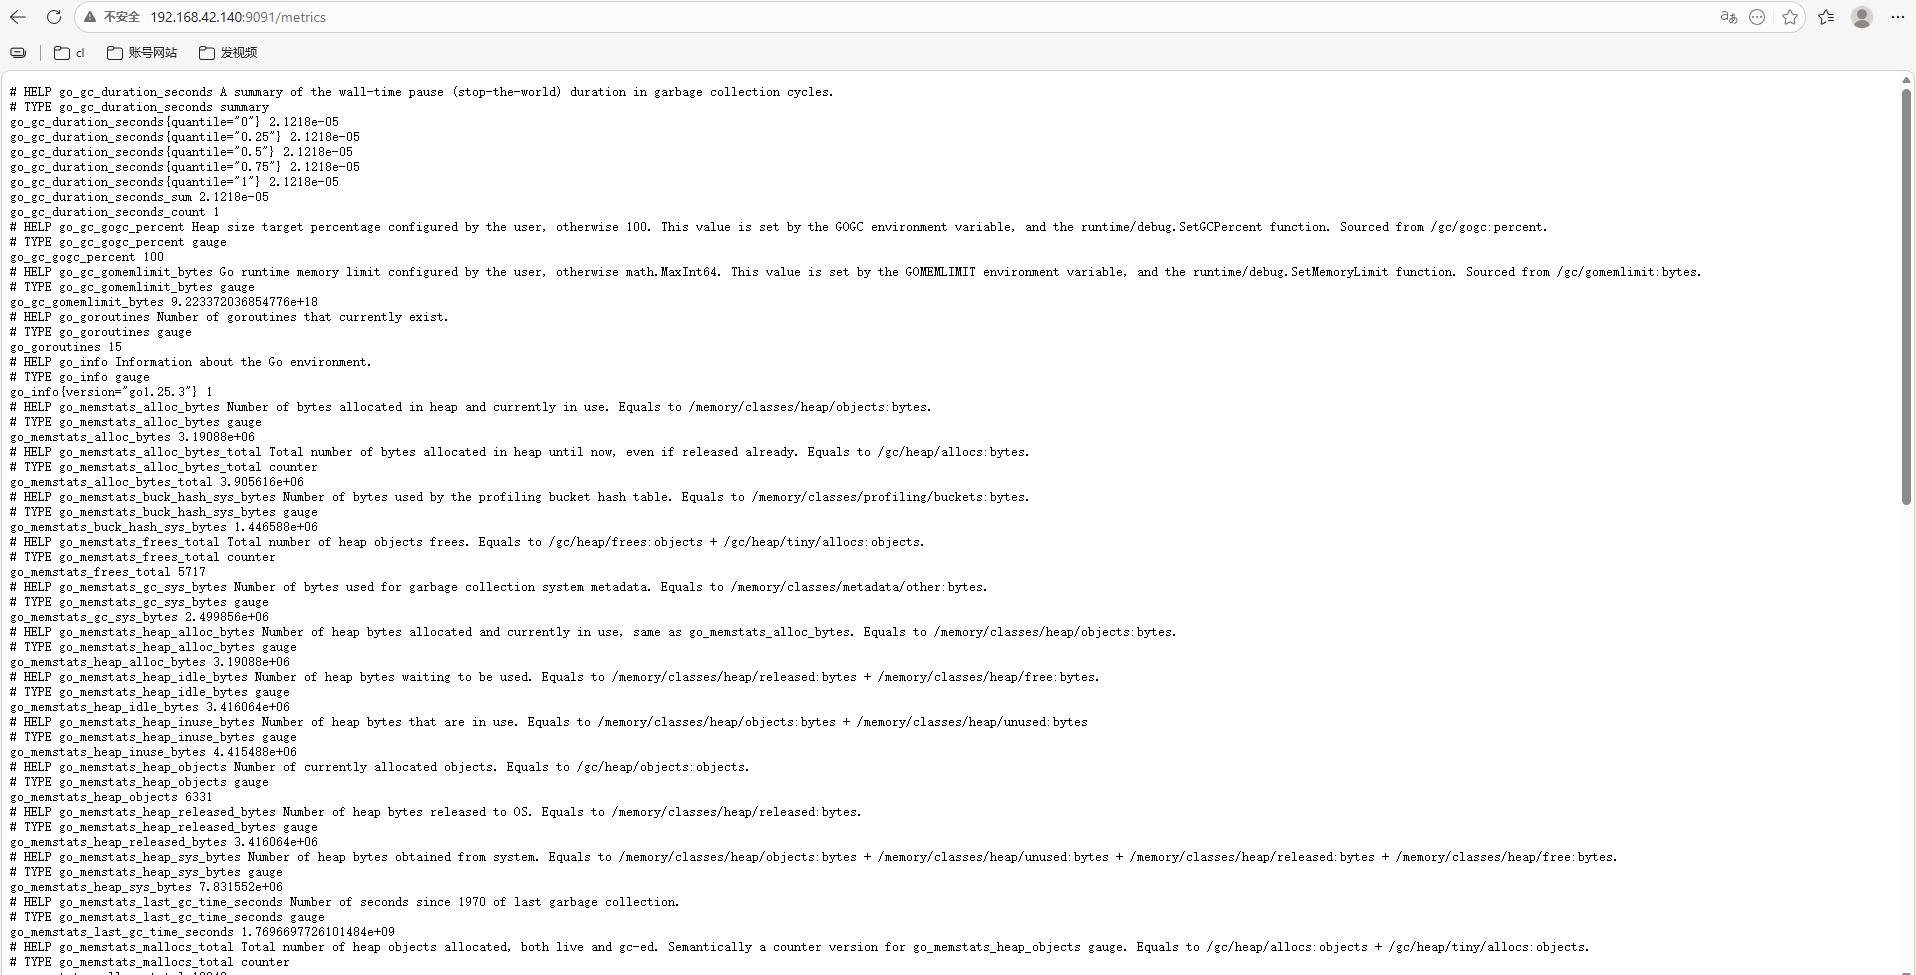
不过,PushGateway服务本身是带了一些Metrics的,可以通过访问 http://<ip>:9091/metrics 地址来获取,可以看到里边包含了go、process等相关的一些监控指标。
2.2 docker安装
使用prom/pushgateway的Docker镜像:
shell
docker pull prom/pushgateway接下来启动Push Gateway:
shell
docker run -d \
  --name=pg \
  -p 9091:9091 \
  prom/pushgateway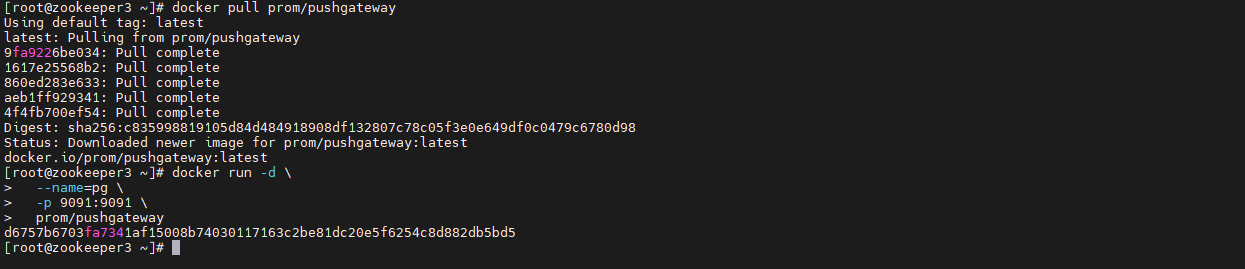
访问url:
shell
http://ip:9091/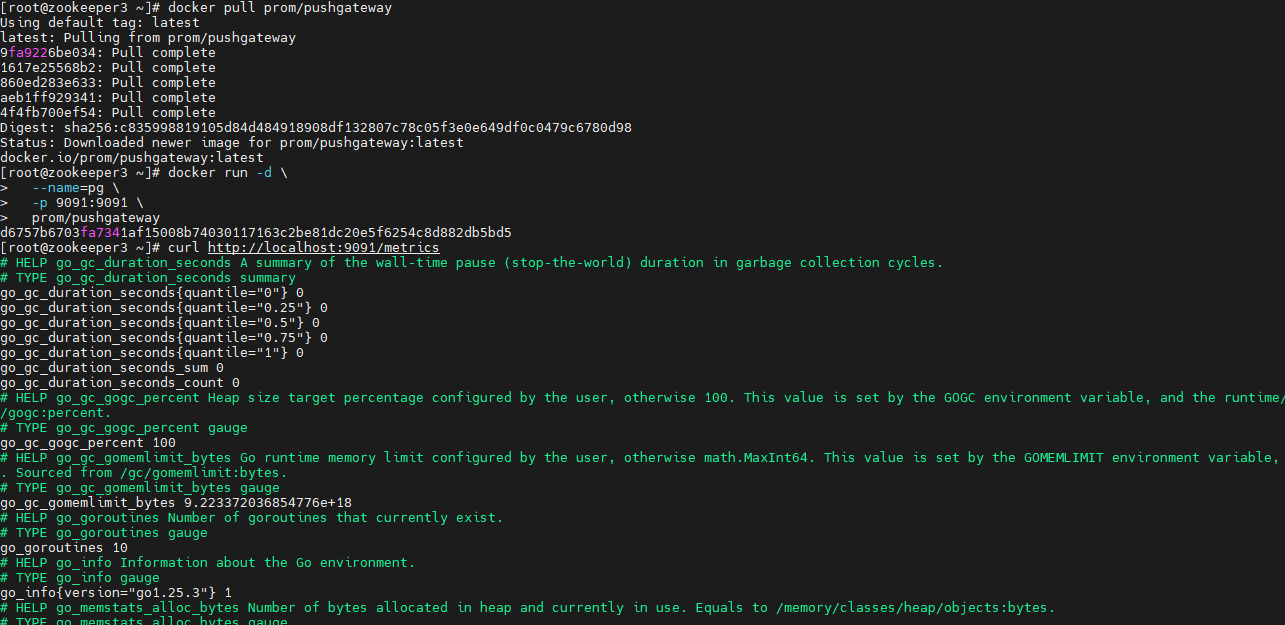
3.prometheus中配置pushgateway
要使Push Gateway正常工作,必须要在prometheus中配置对应的job才行。
找到prometheus配置文件:
shell
vi /app/prometheus/prometheus.yml
shell
      - targets: ['localhost:9091']
        labels:
          app: "pushgateway"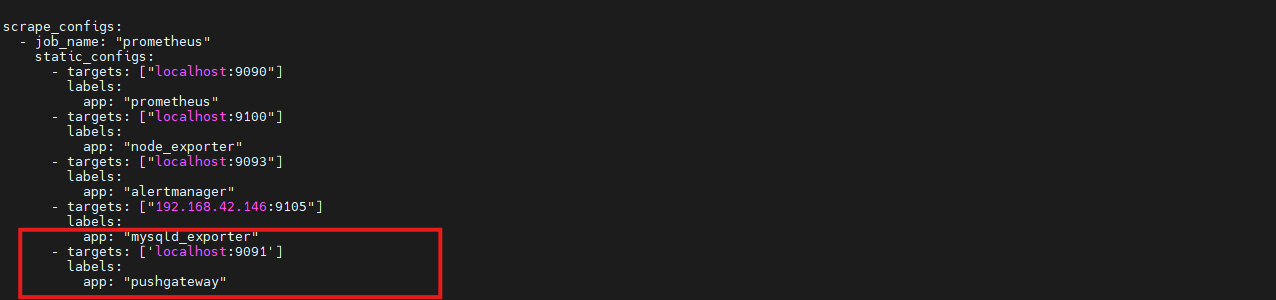
重新启动prometheus服务:
shell
systemctl restart prometheus
systemctl status prometheus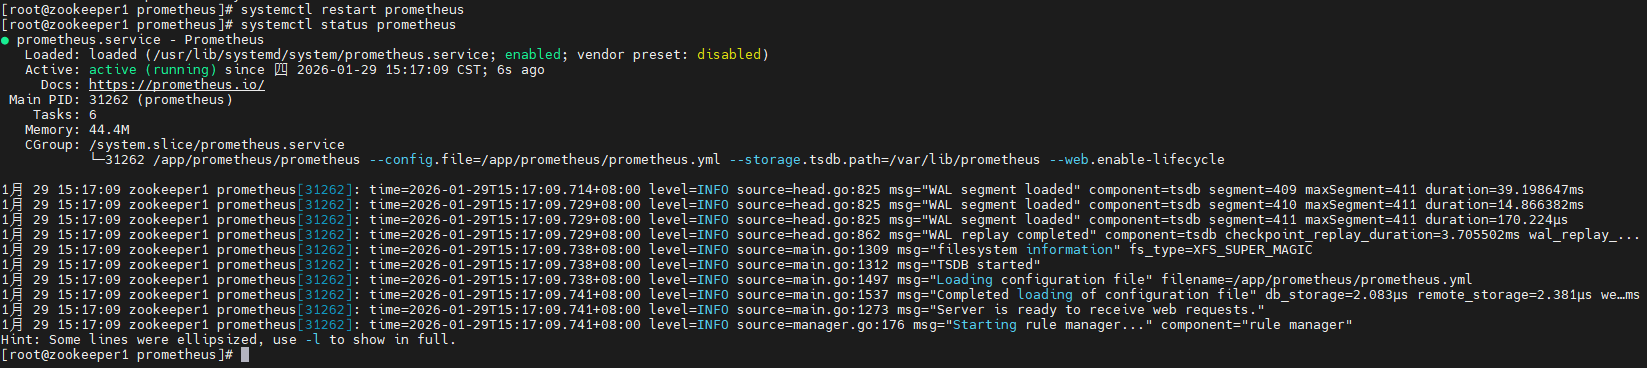
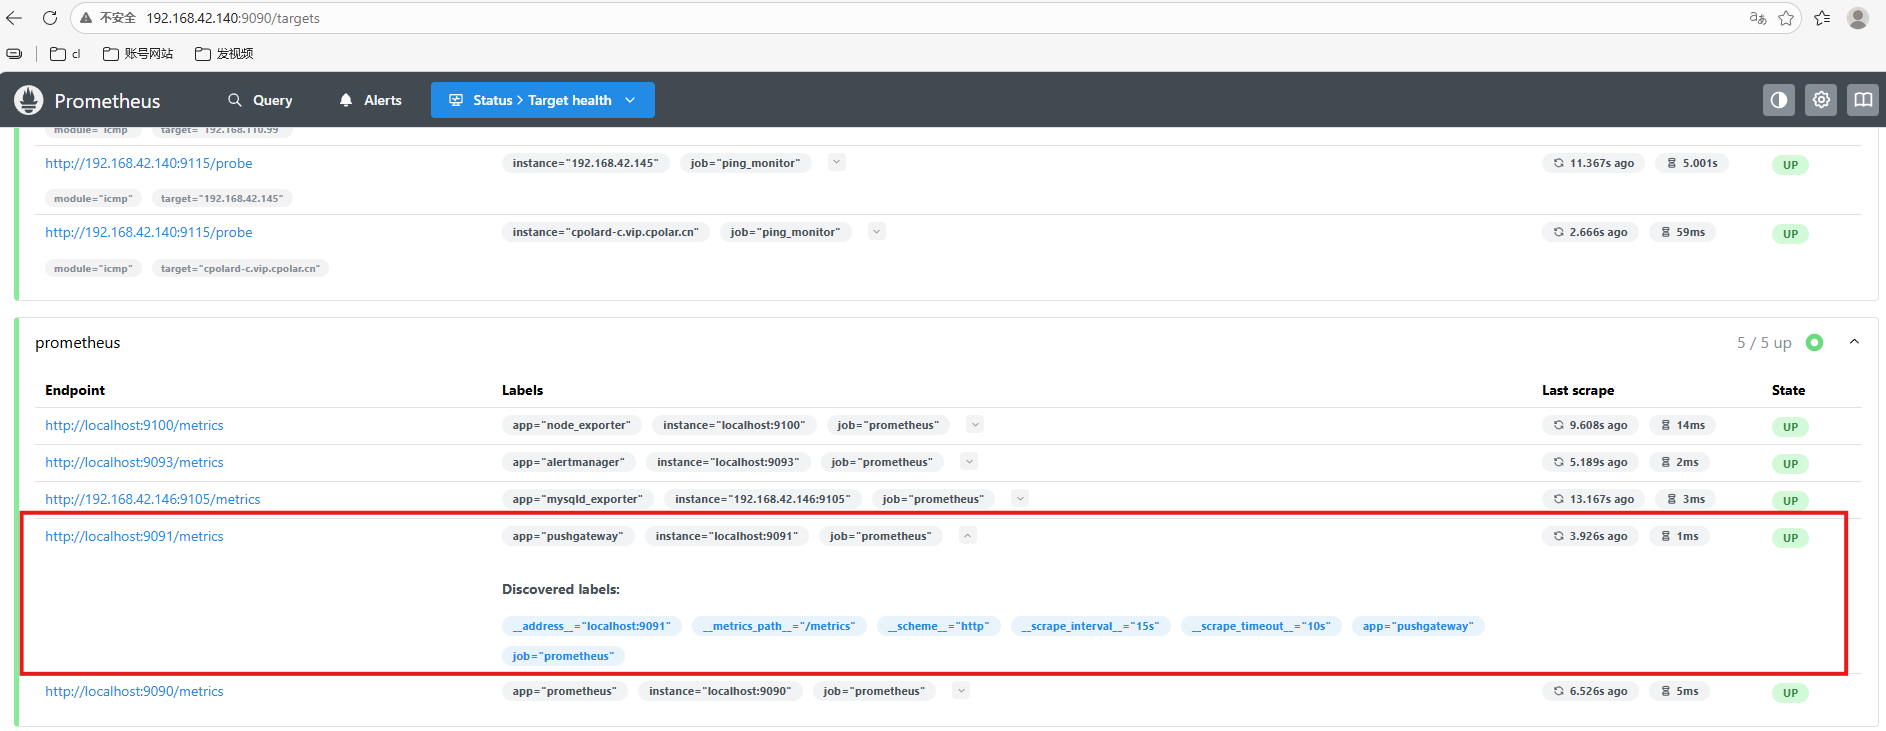
通过浏览器访问"ip:9090"就可以看见pushgateway服务已经添加监控成功:
4.推送数据到pushgateway
我们要Push数据到PushGateway中,可以通过其提供的API标准接口来添加。
默认URL地址为:http://:9091/metrics/job/{/<LABEL_NAME>/<LABEL_VALUE>}。
其中 是必填项,为job标签值,后边可以跟任意数量的标签对,一般我们会添加一个instance/<INSTANCE_NAME> 实例名称标签,来方便区分各个指标。
接下来,可以Push一个简单的指标数据到PushGateway中测试一下。
shell
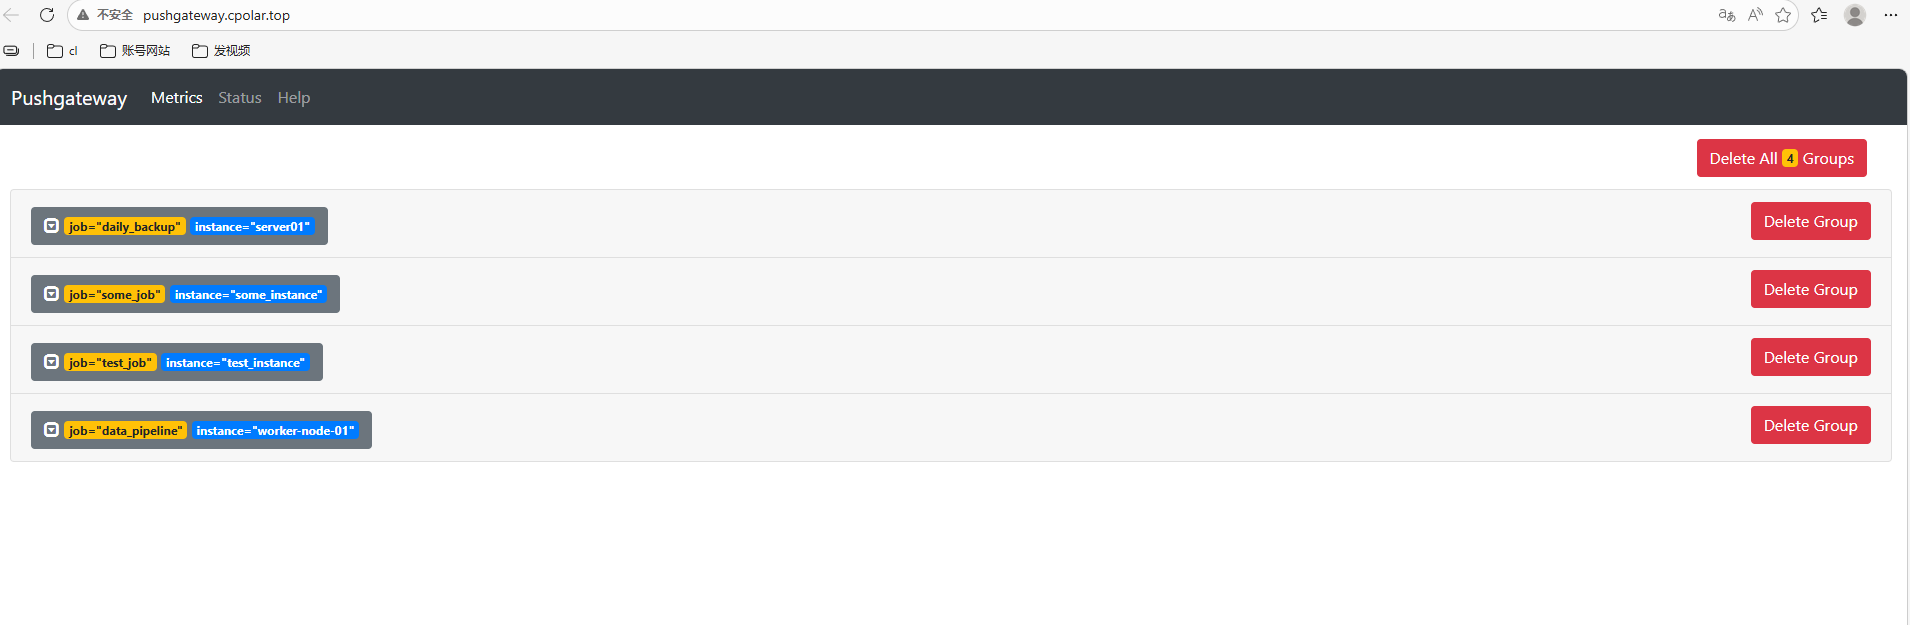
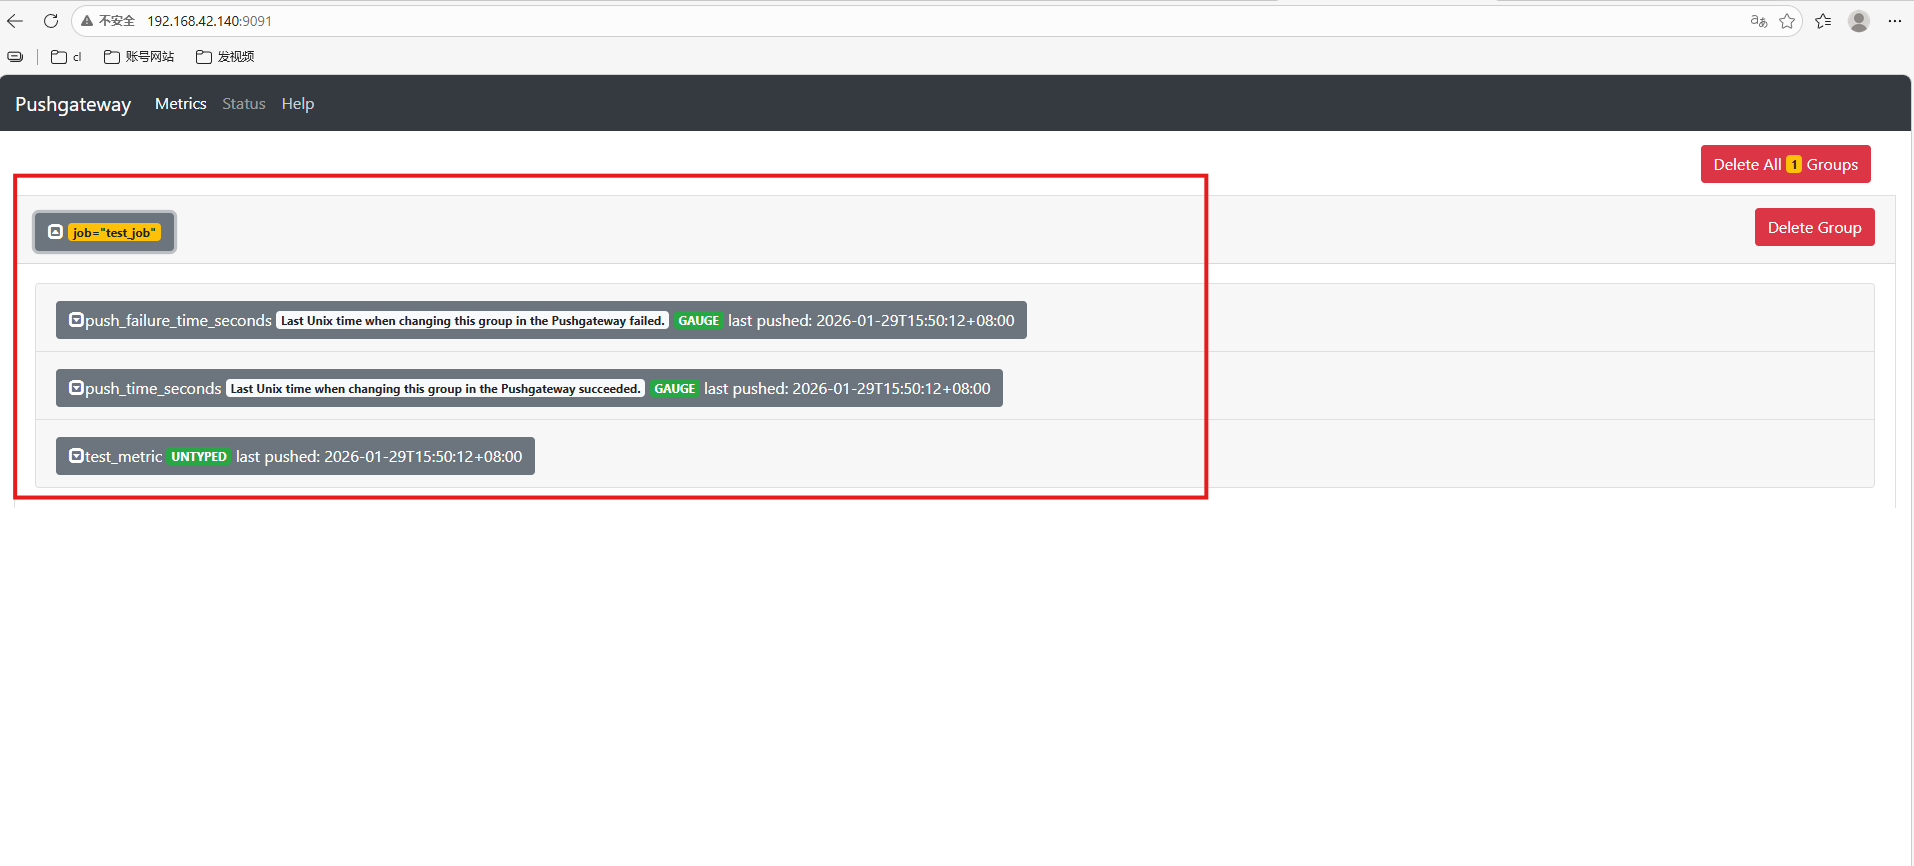
echo "test_metric 123456" | curl --data-binary @- http://192.168.42.140:9091/metrics/job/test_job回到pushgateway页面就可以看见test_job啦!
除了test_metric外,同时还新增了push_time_seconds和push_failure_time_seconds两个指标,这两个是PushGateway系统自动生成的相关指标。
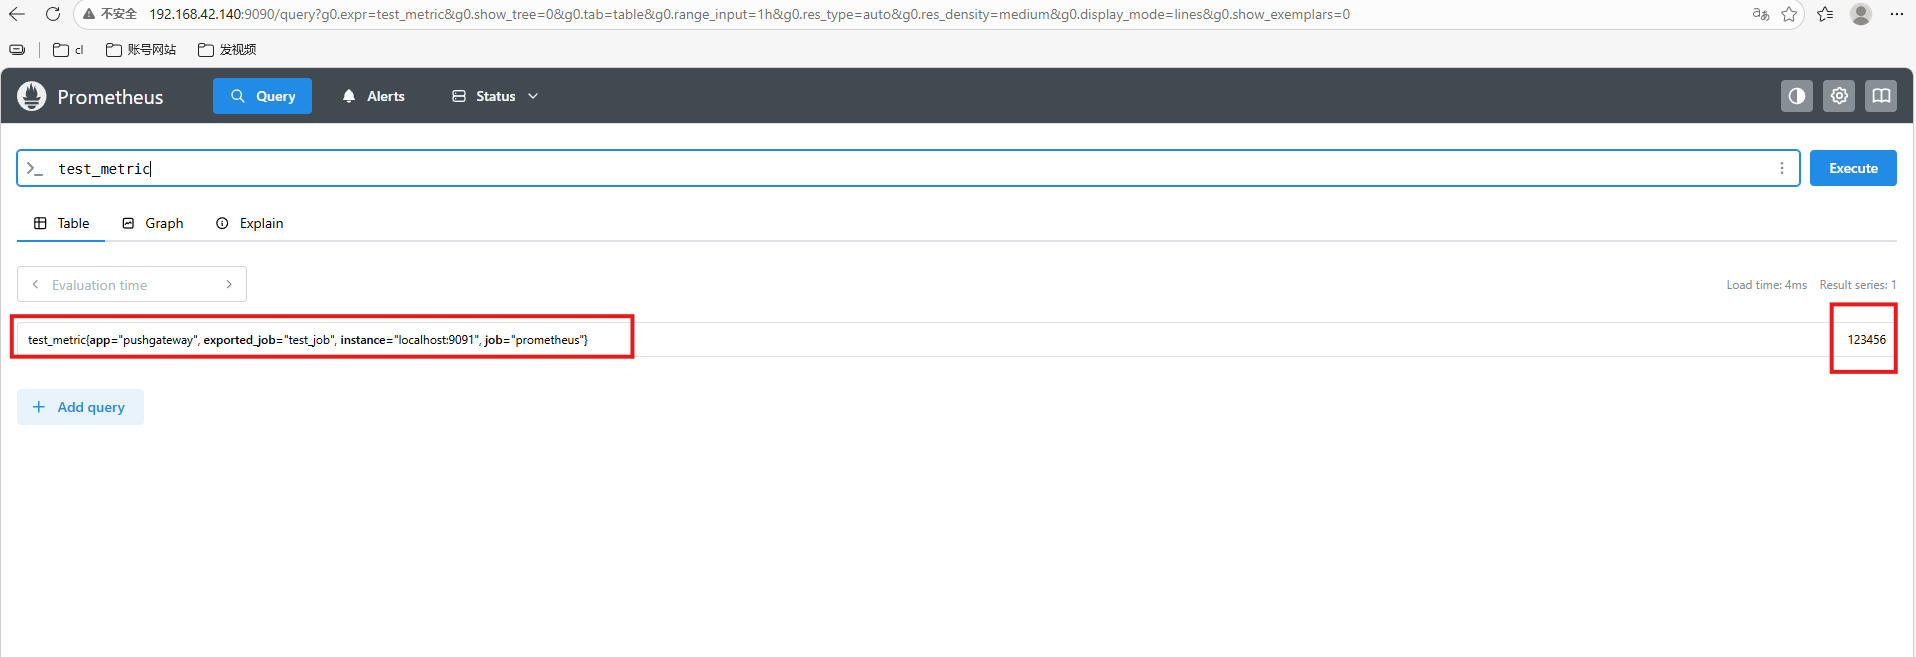
此时,我们在Prometheus UI页面上Graph页面可以查询的到该指标了。
添加更多更复杂数据,通常数据会带上instance, 表示来源位置:
shell
cat <<EOF | curl --data-binary @- http://192.168.42.140:9091/metrics/job/some_job/instance/some_instance
# TYPE some_metric counter
some_metric{label="val1"} 42
# TYPE another_metric gauge
# HELP another_metric Just an example.
another_metric 2398.283
EOF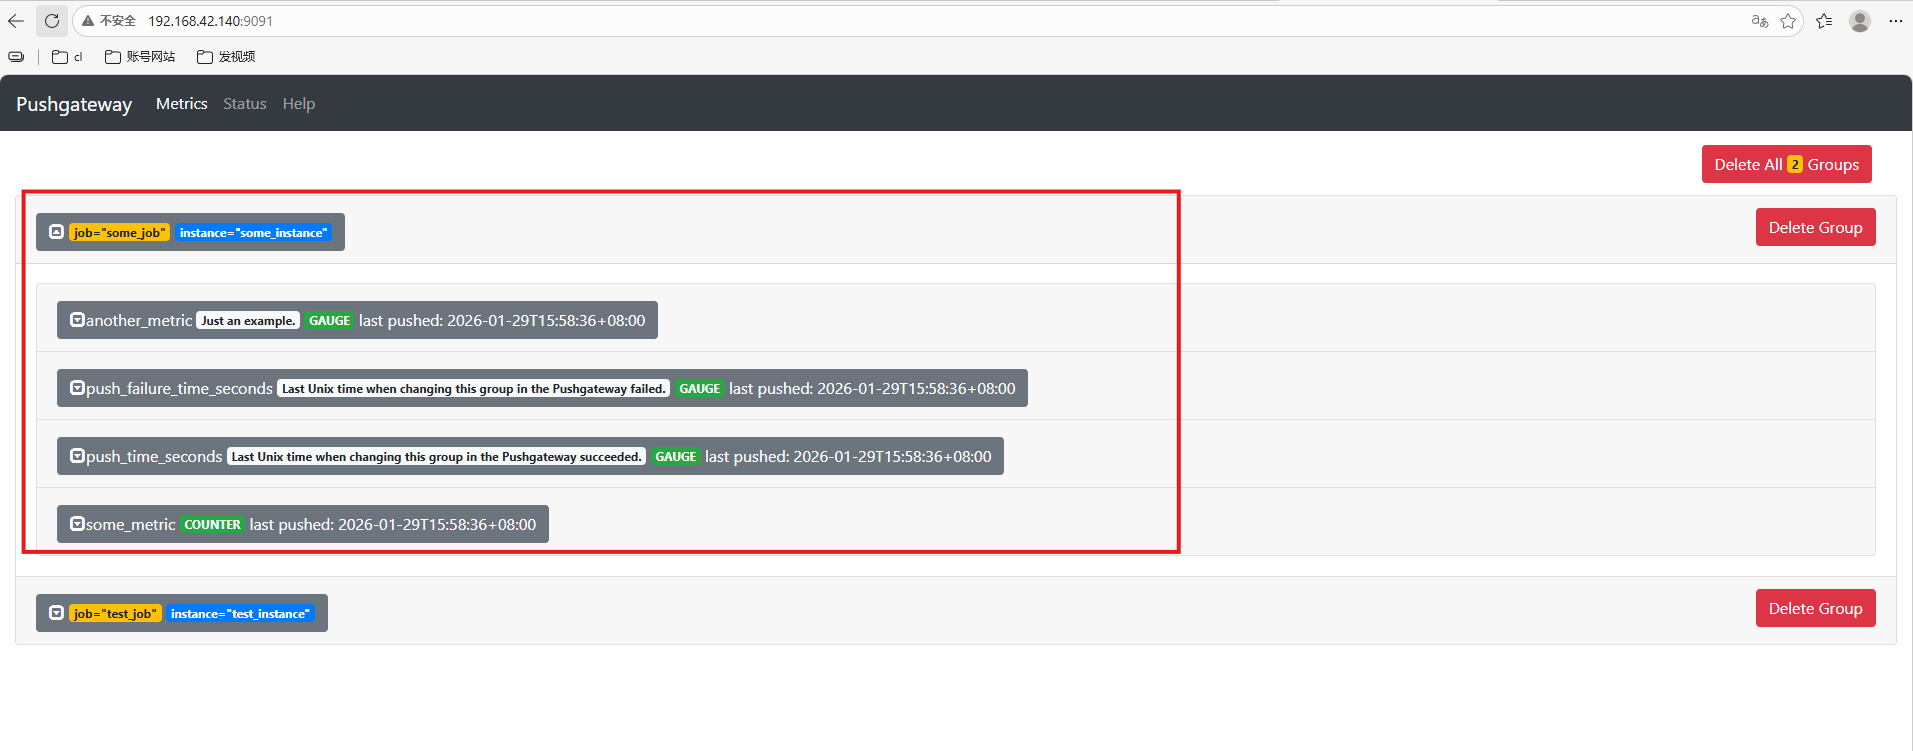
删除某个组下的某实例的所有数据:
curl -X DELETE http://192.168.42.140:9091/metrics/job/some_job/instance/some_instance删除某个组下的所有数据:
curl -X DELETE http://192.168.42.140:9091/metrics/job/some_job5.真实场景上演推送指标
5.1 shell脚本
模拟一个备份任务的执行过程,并将任务的关键指标(耗时和成功状态)主动推送到Prometheus的Pushgateway,以便被Prometheus采集和监控。
shell
#!/bin/bash

JOB_NAME="daily_backup"
INSTANCE="server01"
PUSHGATEWAY_URL="http://localhost:9091"

start_time=$(date +%s)

# 模拟备份操作
echo "Starting backup..."
sleep 3
backup_success=1  # 1 表示成功,0 表示失败(实际可由命令返回值决定)

end_time=$(date +%s)
duration=$((end_time - start_time))

# 构建指标
cat <<EOF | curl --data-binary @- http://localhost:9091/metrics/job/$JOB_NAME/instance/$INSTANCE
# HELP backup_duration_seconds Duration of the backup job in seconds
# TYPE backup_duration_seconds gauge
backup_duration_seconds $duration

# HELP backup_success Whether the backup succeeded (1) or failed (0)
# TYPE backup_success gauge
backup_success $backup_success
EOF

echo "Metrics pushed to Pushgateway."
执行后,访问 http://ip:9091 可看到:
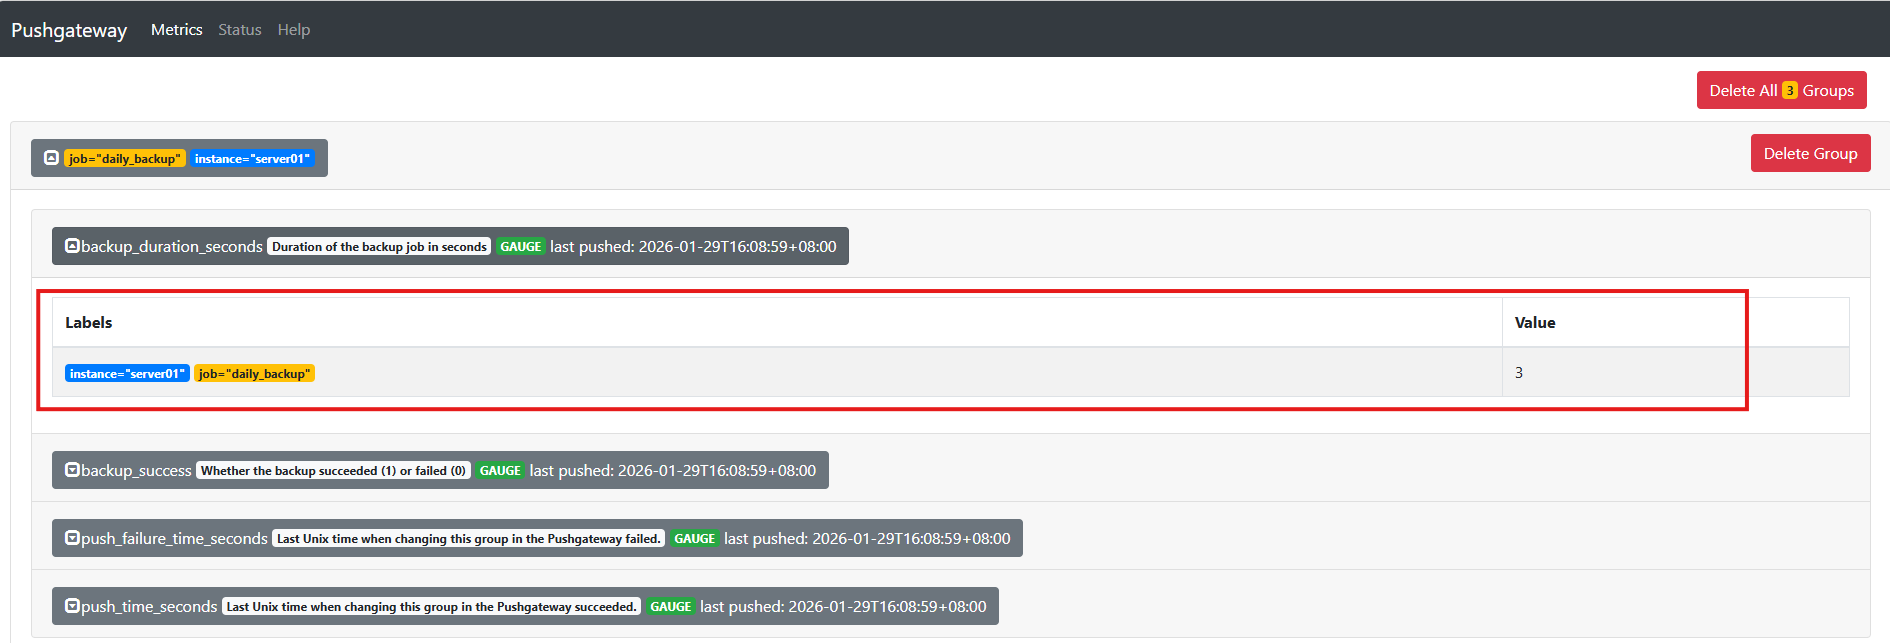
最终在Prometheus中看到的指标形如:
shell
backup_duration_seconds{job="daily_backup", instance="server01"} 3
backup_success{job="daily_backup", instance="server01"} 1
5.2 Python脚本
数据处理任务完成后,将关键指标主动推送到Prometheus的Pushgateway,从而实现对短生命周期批处理任务的监控。(让一次性的Python批处理任务,在结束后主动告诉监控系统:我干了多少活,成没成功。)
shell
import requests
import time

def push_metrics(job, instance, records_processed, success):
    metrics = f"""
    # HELP data_records_processed Number of records processed
    # TYPE data_records_processed gauge
    data_records_processed {records_processed}

    # HELP data_job_success Job success status (1 = success, 0 = failure)
    # TYPE data_job_success gauge
    data_job_success {int(success)}
    """
    url = f"http://localhost:9091/metrics/job/{job}/instance/{instance}"
    response = requests.post(url, data=metrics.encode('utf-8'))
    if response.status_code == 202:
        print("Metrics pushed successfully.")
    else:
        print(f"Failed to push metrics: {response.status_code}")

# 模拟任务
start = time.time()
try:
    # 模拟处理 1500 条数据
    records = 1500
    time.sleep(2)
    success = True
except Exception as e:
    records = 0
    success = False

push_metrics(
    job="data_pipeline",
    instance="worker-node-01",
    records_processed=records,
    success=success
)
执行该脚本:
shell
python3 1.py执行后,访问 http://ip:9091 可看到:
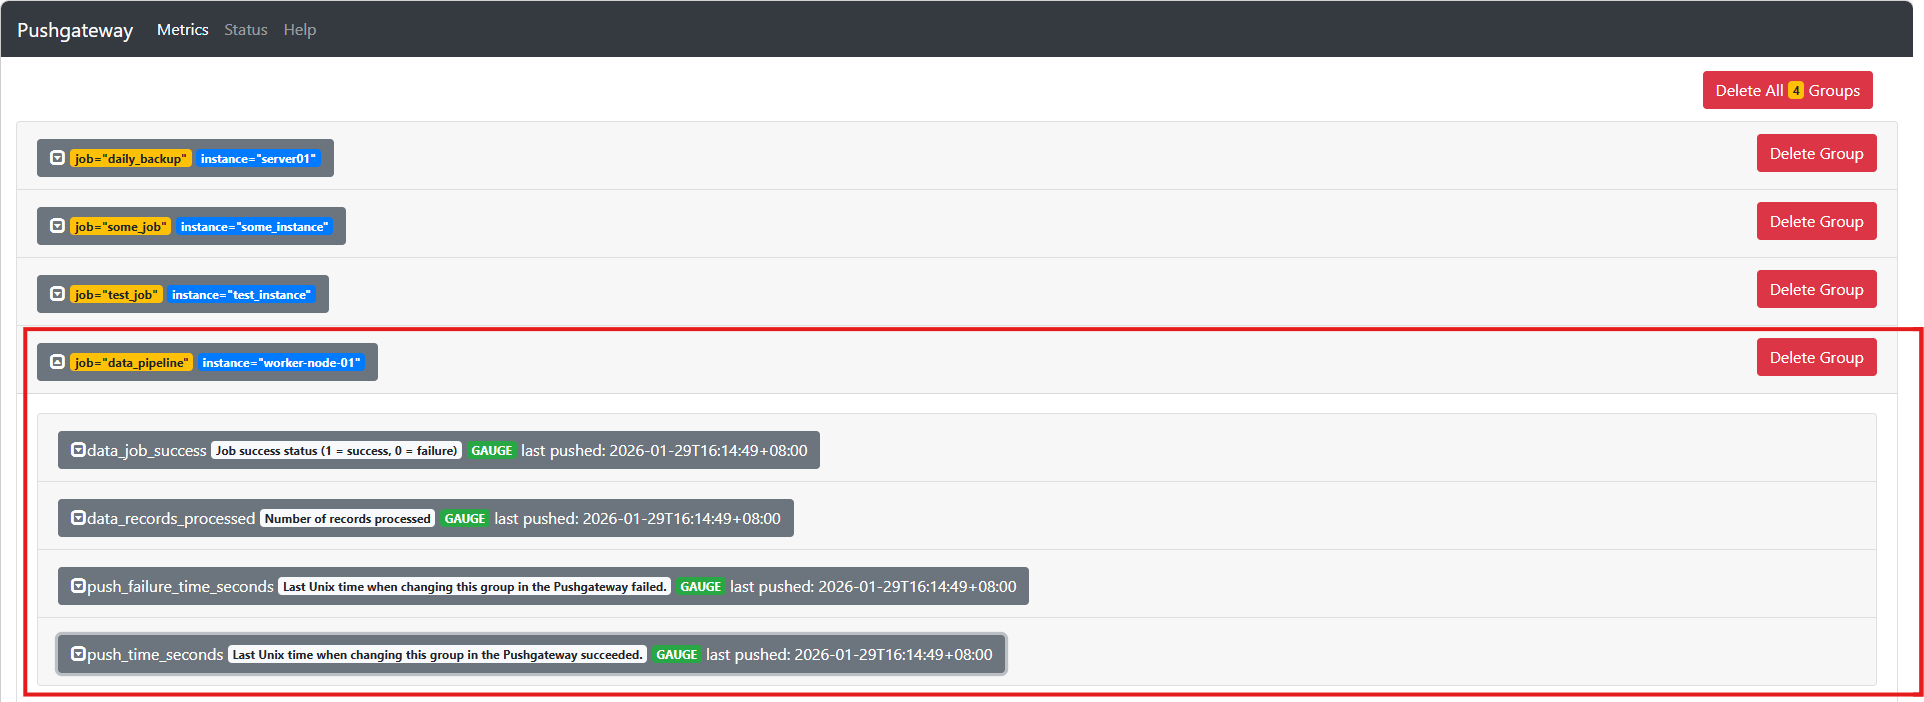
推送后,Prometheus采集Pushgateway数据,你会看到如下指标:
shell
data_records_processed{job="data_pipeline", instance="worker-node-01"} 1500
data_job_success{job="data_pipeline", instance="worker-node-01"} 1
在实际运维中,我们常常遇到这样的困境:监控系统(如Prometheus + Pushgateway)部署在公司内网或私有云环境中,没有公网IP,也无法随意开放防火墙端口。但与此同时,部署在公有云上的CI/CD流水线、边缘设备或临时脚本却需要将执行结果(如备份状态、任务耗时)上报到这套内网监控体系中------传统网络架构下,这几乎无法实现。Cpolar正是为解决这类"内网穿透"问题而生。它通过一条加密隧道,将内网的Pushgateway服务安全地映射到一个公网可访问的HTTPS地址,无需改动现有网络策略,也无需暴露服务器真实IP。无论是远程调试、跨环境指标上报,还是临时打通监控链路,Cpolar都能以极低的成本和极高的安全性,让内网服务"走出去",真正实现监控无边界。
6.安装cpolar实现随时随地开发
6.1 什么是cpolar?
cpolar是一款安全高效的内网穿透工具,无需公网IP或复杂配置,只需一条命令,即可将本地服务器、Web服务或任意端口映射到公网,让你随时随地远程访问内网应用,特别适合开发调试、远程运维和应急部署等场景。
6.2 部署cpolar
cpolar 可以将你本地电脑中的服务(如 SSH、Web、数据库)映射到公网。即使你在家里或外出时,也可以通过公网地址连接回本地运行的开发环境。
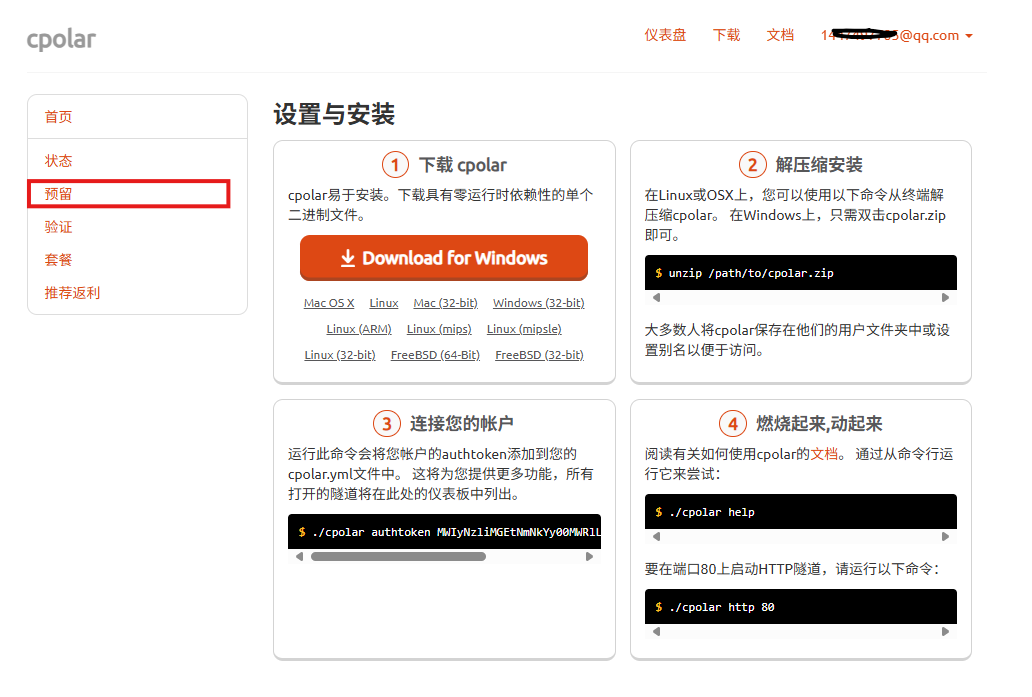
❤️以下是安装cpolar步骤:
使用一键脚本安装命令:
shell
sudo curl https://get.cpolar.sh | sh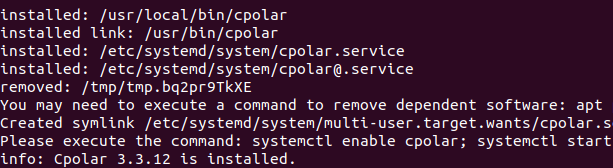
安装完成后,执行下方命令查看cpolar服务状态:(如图所示即为正常启动)
shell
sudo systemctl status cpolar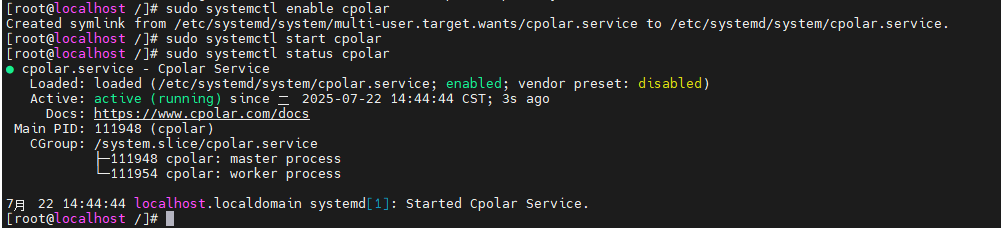
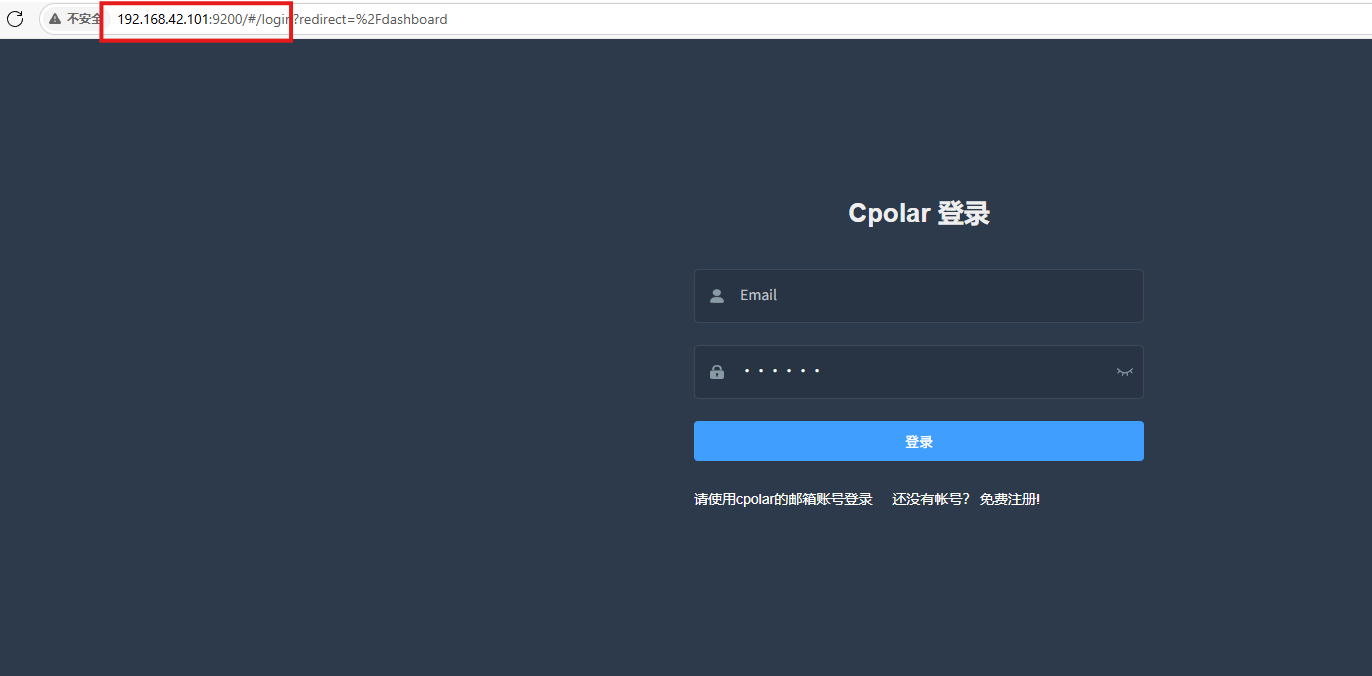
Cpolar安装和成功启动服务后,在浏览器上输入虚拟机主机IP加9200端口即:【http://ip:9200】访问Cpolar管理界面,使用Cpolar官网注册的账号登录,登录后即可看到cpolar web 配置界面,接下来在web 界面配置即可:
打开浏览器访问本地9200端口,使用cpolar账户密码登录即可,登录后即可对隧道进行管理。
7.配置公网地址
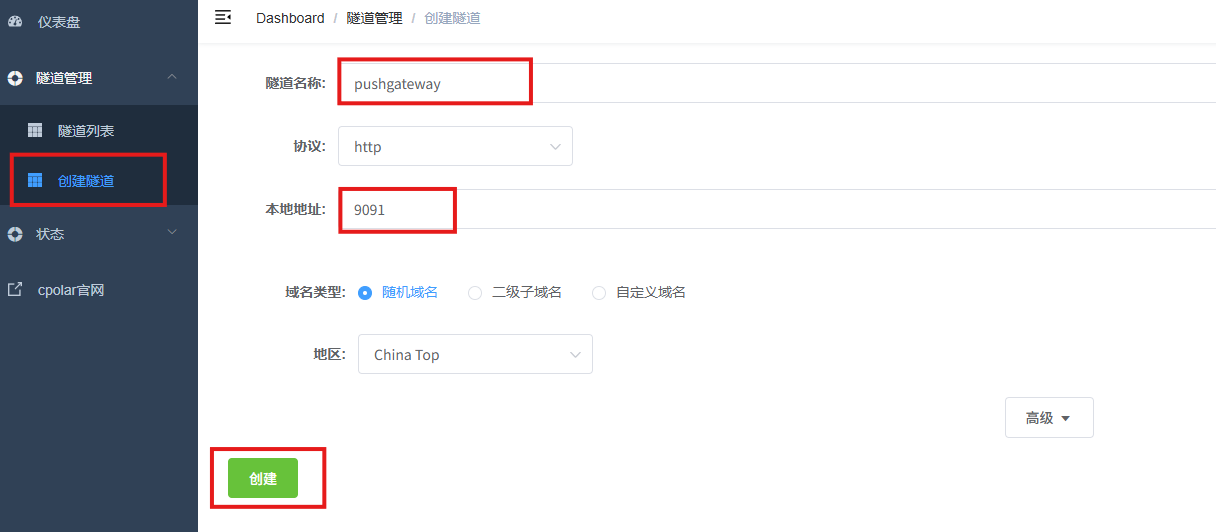
登录cpolar web UI管理界面后,点击左侧仪表盘的隧道管理------创建隧道:
- 隧道名称:可自定义,本例使用了:pushgateway,注意不要与已有的隧道名称重复
- 协议:http
- 本地地址:9091
- 域名类型:随机域名
- 地区:选择China Top
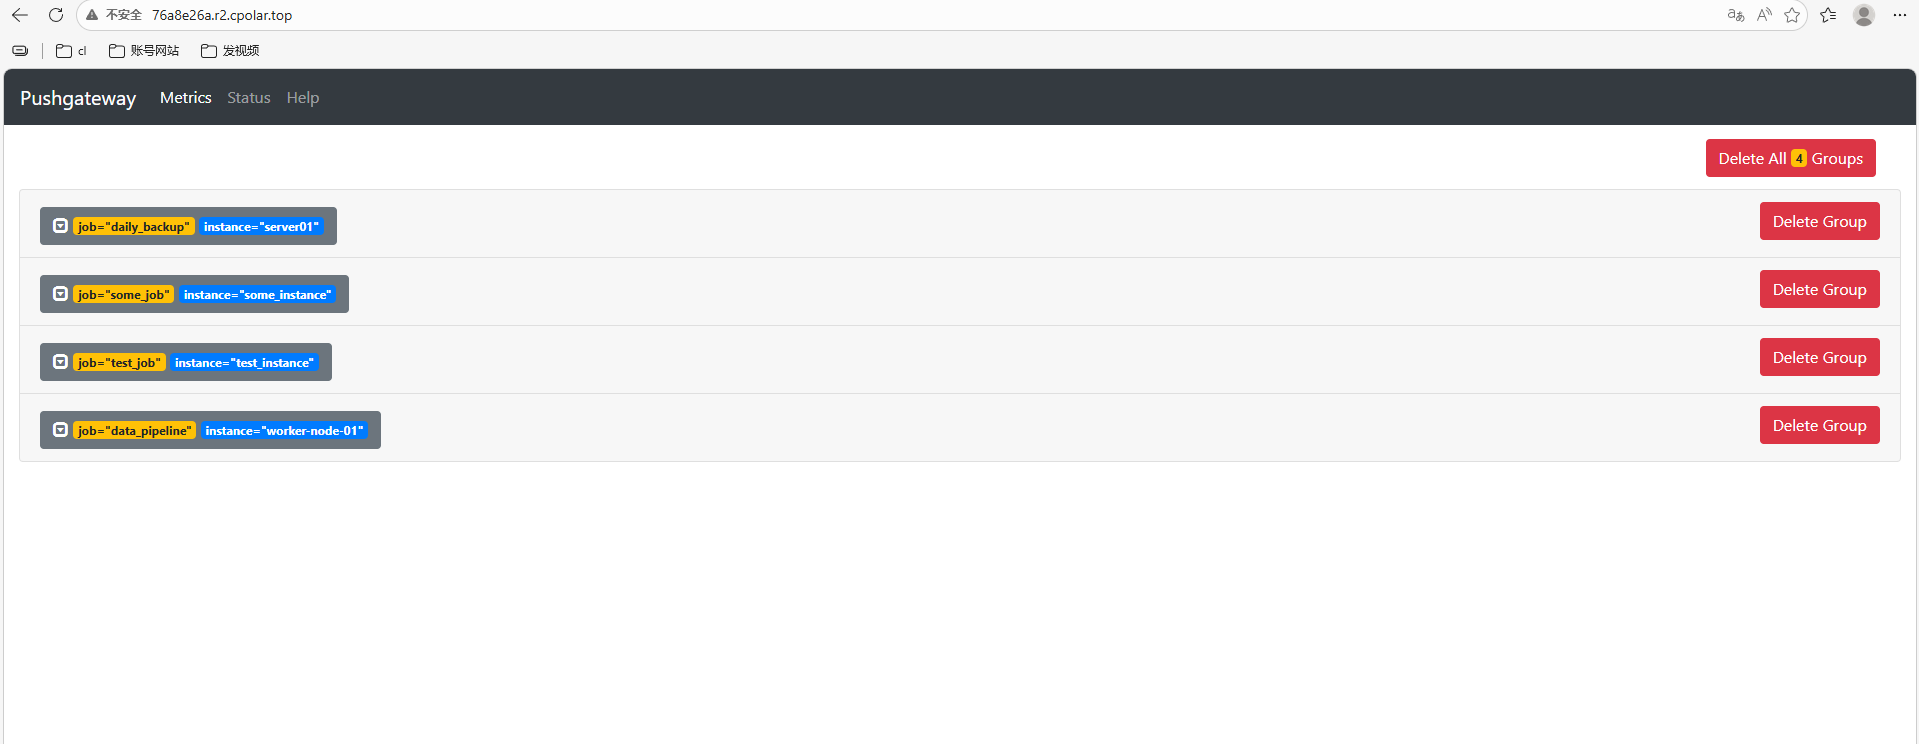
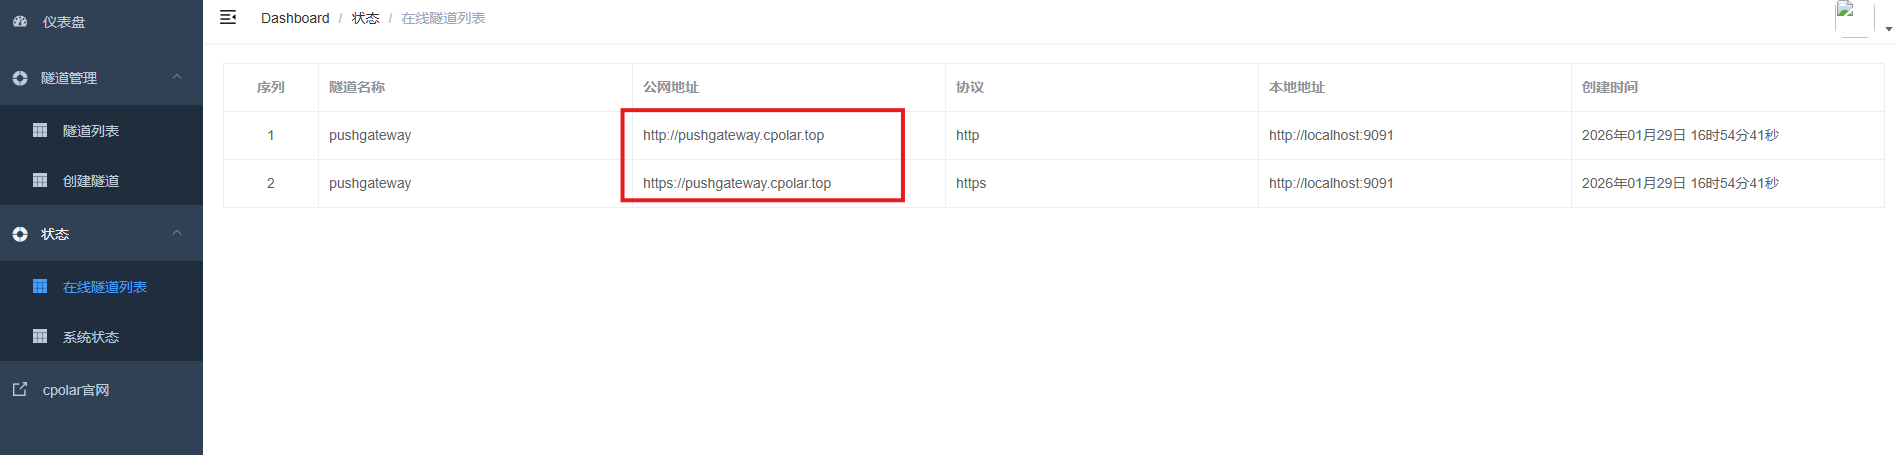
创建成功后,打开左侧在线隧道列表,可以看到刚刚通过创建隧道生成了公网地址,接下来就可以在其他电脑或者移动端设备(异地)上,使用地址访问。
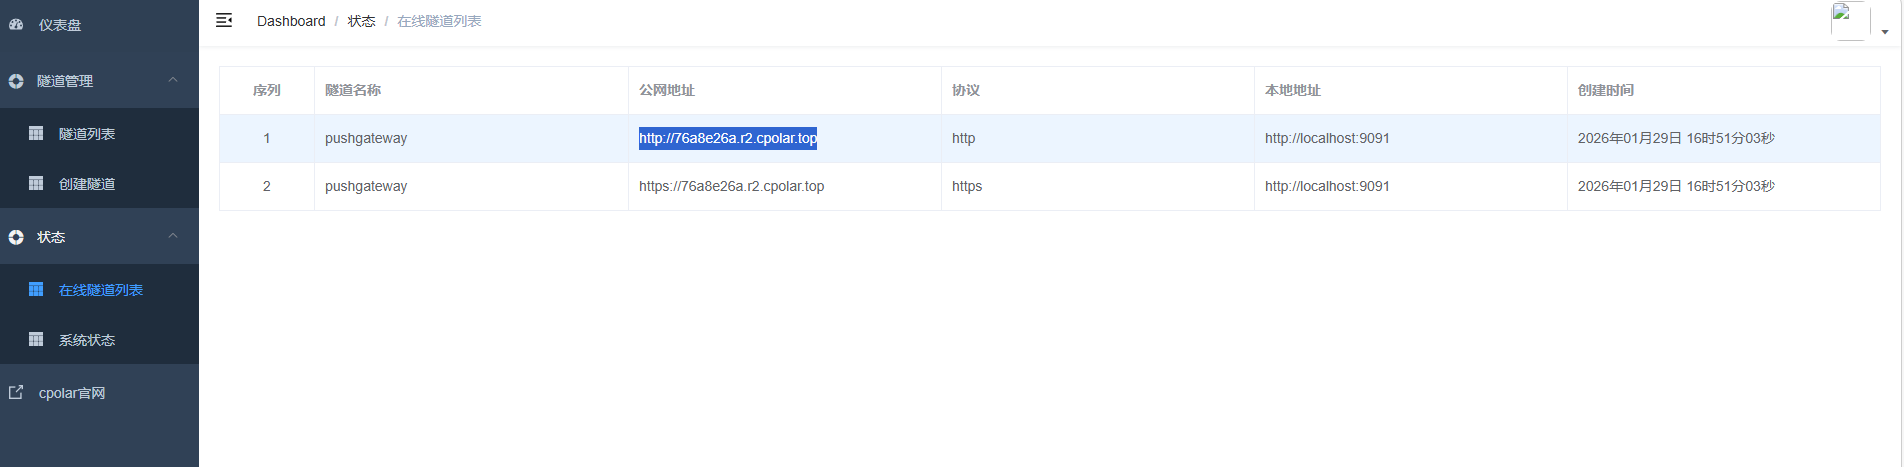
访问成功。
8.保留固定公网地址
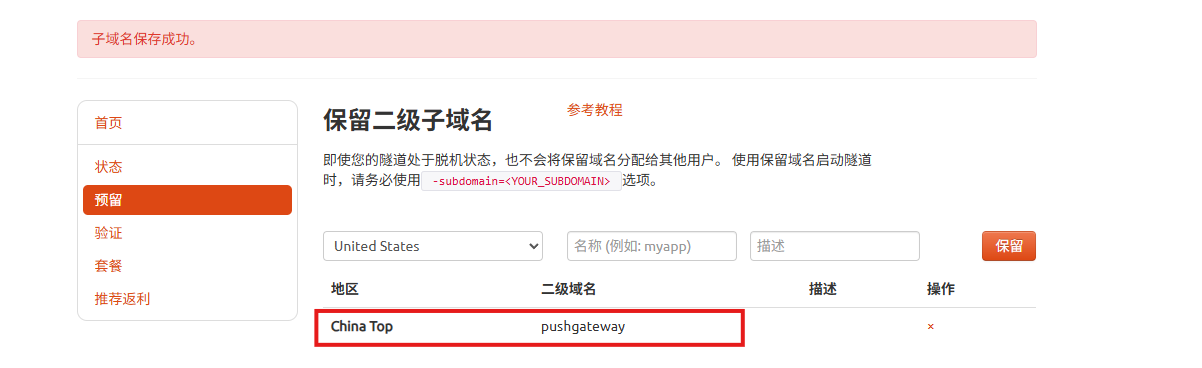
使用cpolar为其配置二级子域名(cpolar官网-安全的内网穿透工具 | 无需公网ip | 远程访问 | 搭建网站),该地址为固定地址,不会随机变化。
点击左侧的预留,选择保留二级子域名,地区选择china Top,然后设置一个二级子域名名称,我使用的是pushgateway,大家可以自定义。填写备注信息,点击保留。
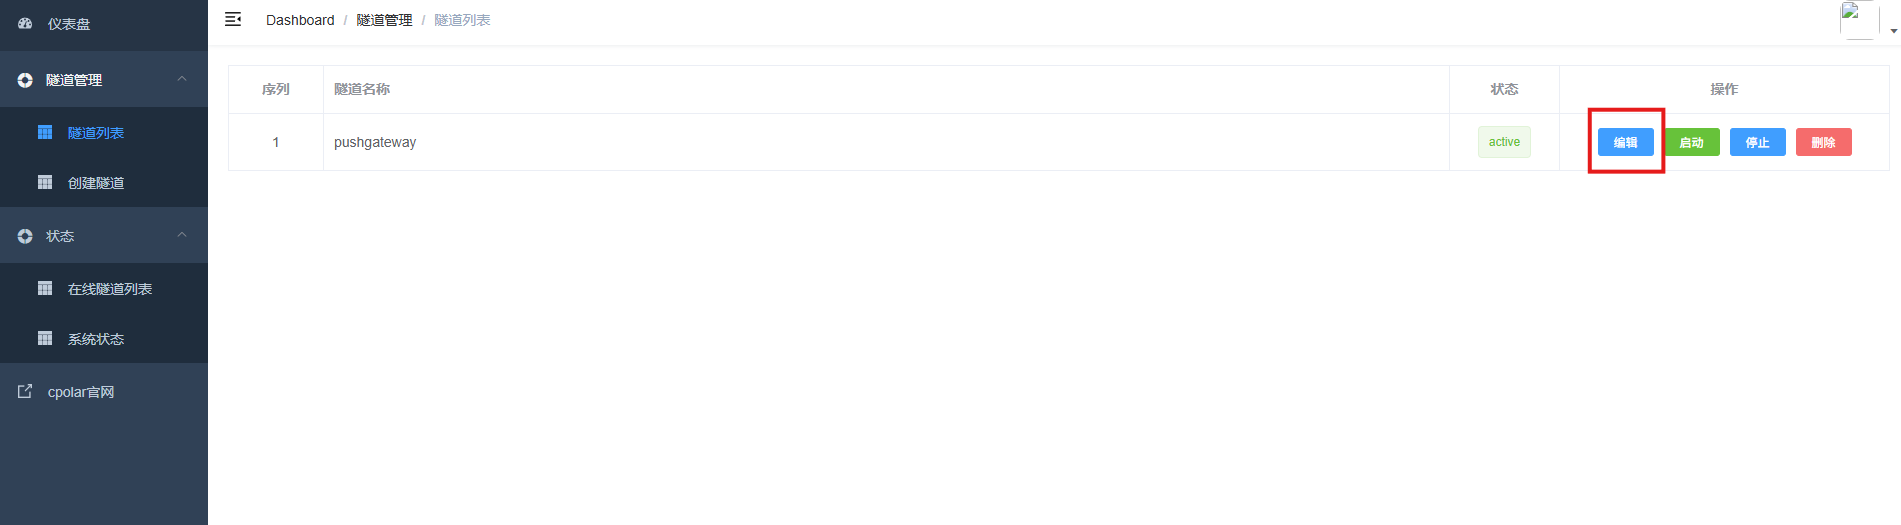
登录cpolar web UI管理界面,点击左侧仪表盘的隧道管理------隧道列表,找到所要配置的隧道,点击右侧的编辑。
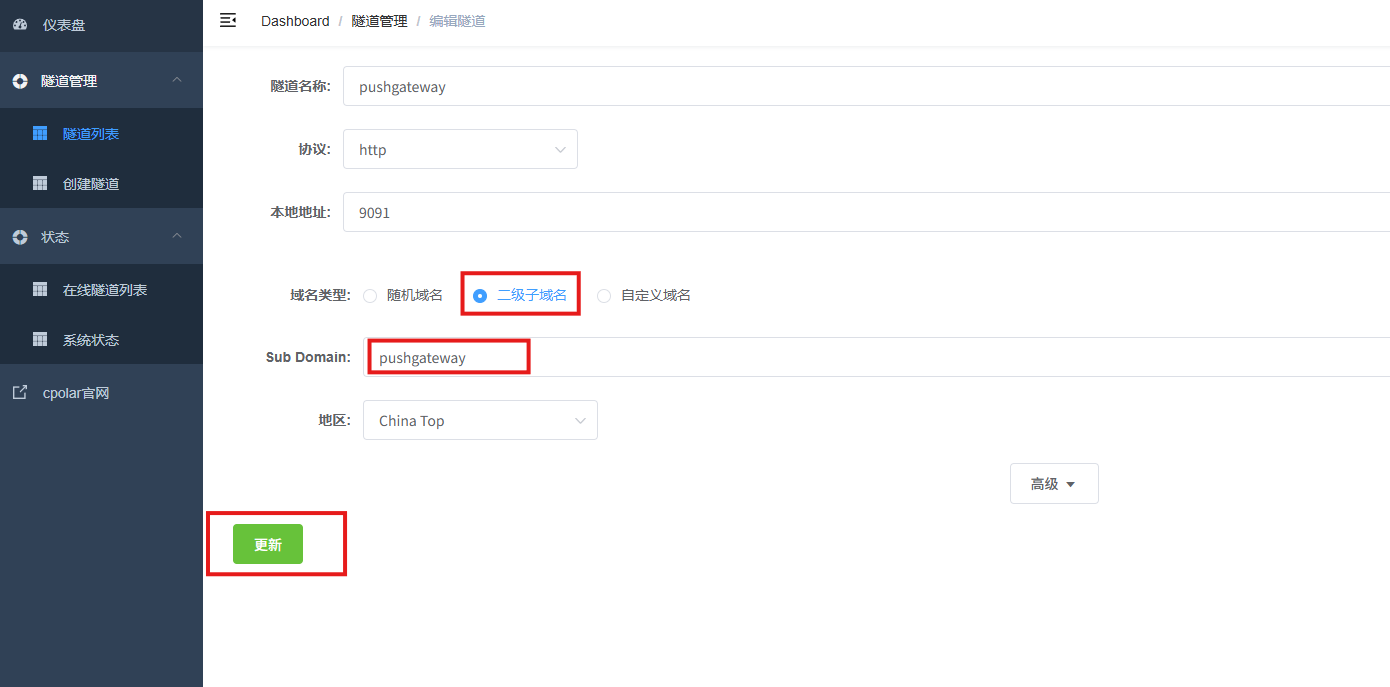
修改隧道信息,将保留成功的二级子域名配置到隧道中
- 域名类型:选择二级子域名
- Sub Domain:填写保留成功的二级子域名
- 地区: China Top
点击更新
更新完成后,打开在线隧道列表,此时可以看到随机的公网地址已经发生变化,地址名称也变成了保留和固定的二级子域名名称。
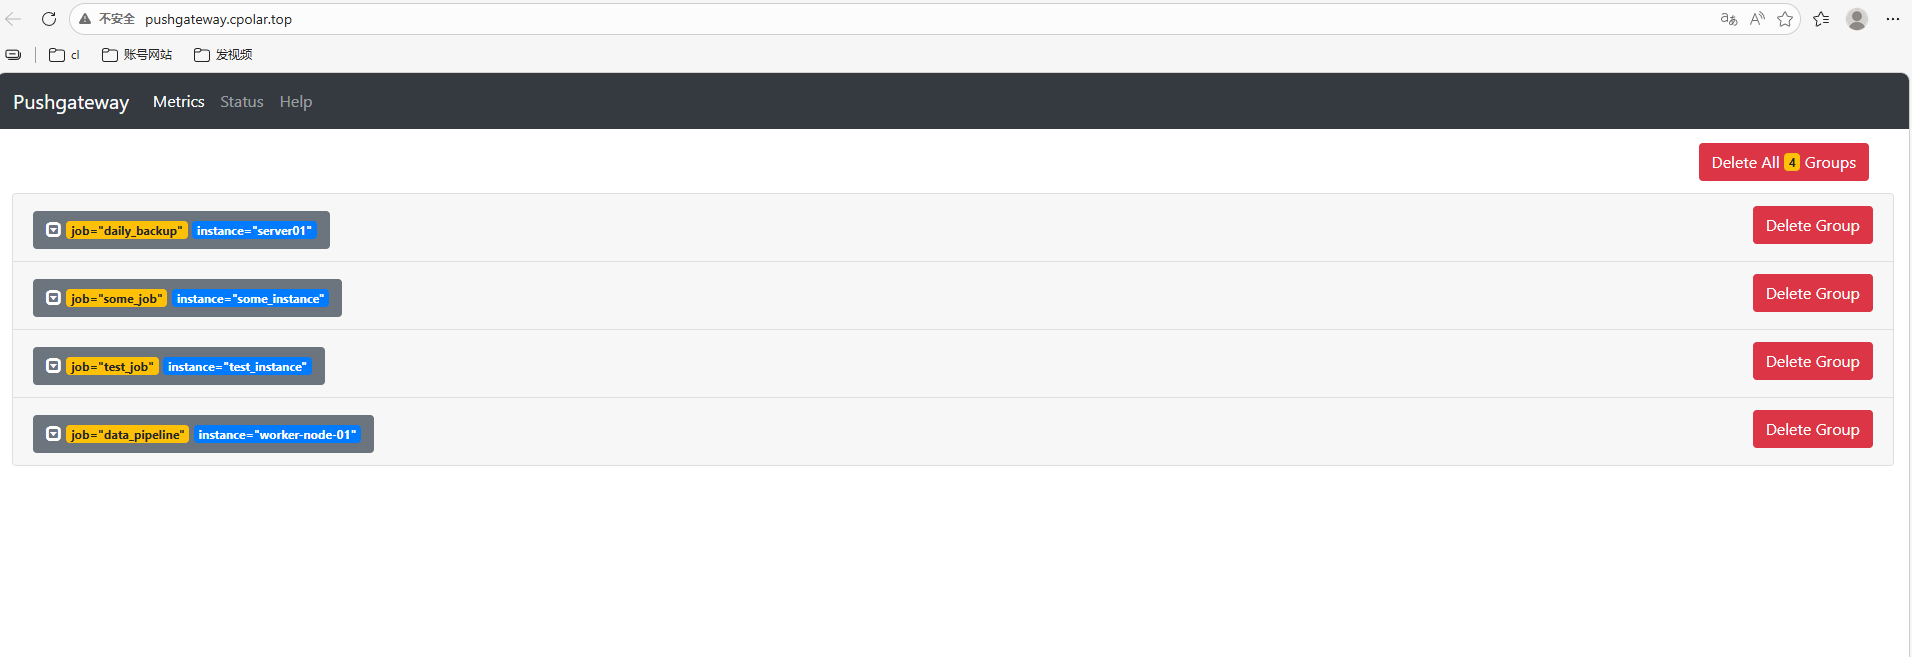
最后,我们使用固定的公网地址在任意设备的浏览器中访问,可以看到成功访问的页面,这样一个永久不会变化的二级子域名公网网址即设置好了。
总结
综上,Pushgateway 填补了 Prometheus 在短生命周期任务监控上的空白,让批量、离线类任务的执行状态、耗时等关键指标不再成为监控盲区。从部署配置到多语言指标上报,再到借助内网穿透突破网络限制,本文覆盖了 Pushgateway 落地的核心环节。
合理应用 Pushgateway,能让监控体系覆盖到系统运行的每一个环节,无论是定时备份、数据处理还是 CI/CD 任务,都能实现可观测、可追溯,为运维和开发工作提供可靠的数据支撑。