引言:为什么选择Streamlit?
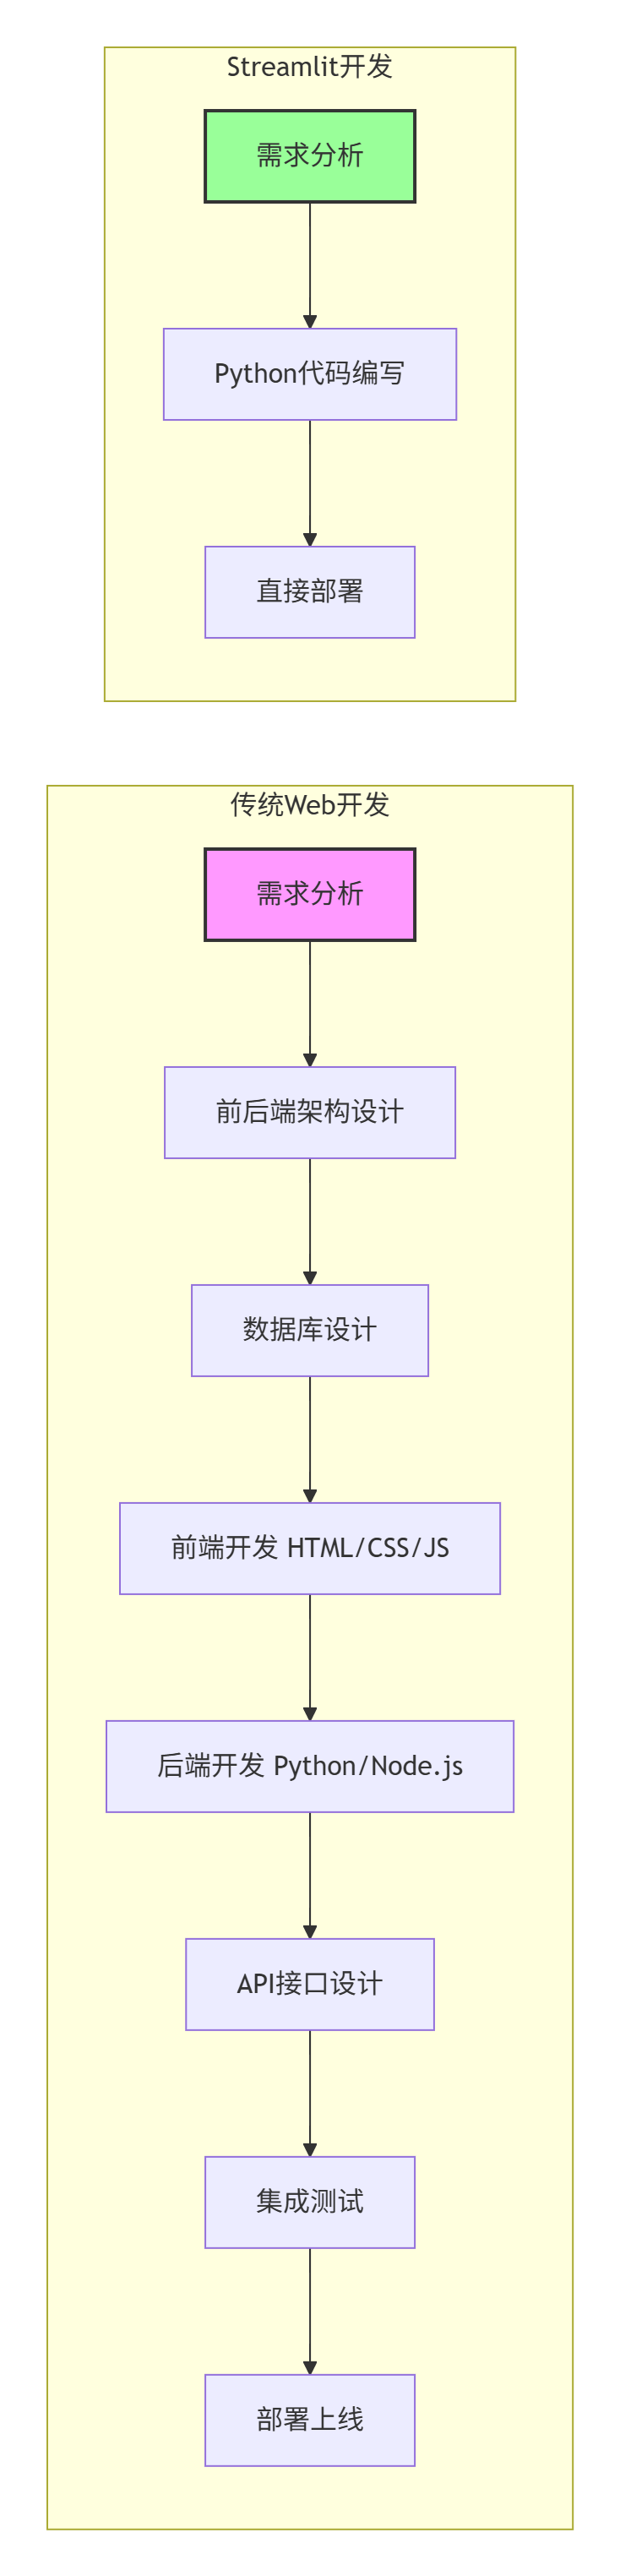
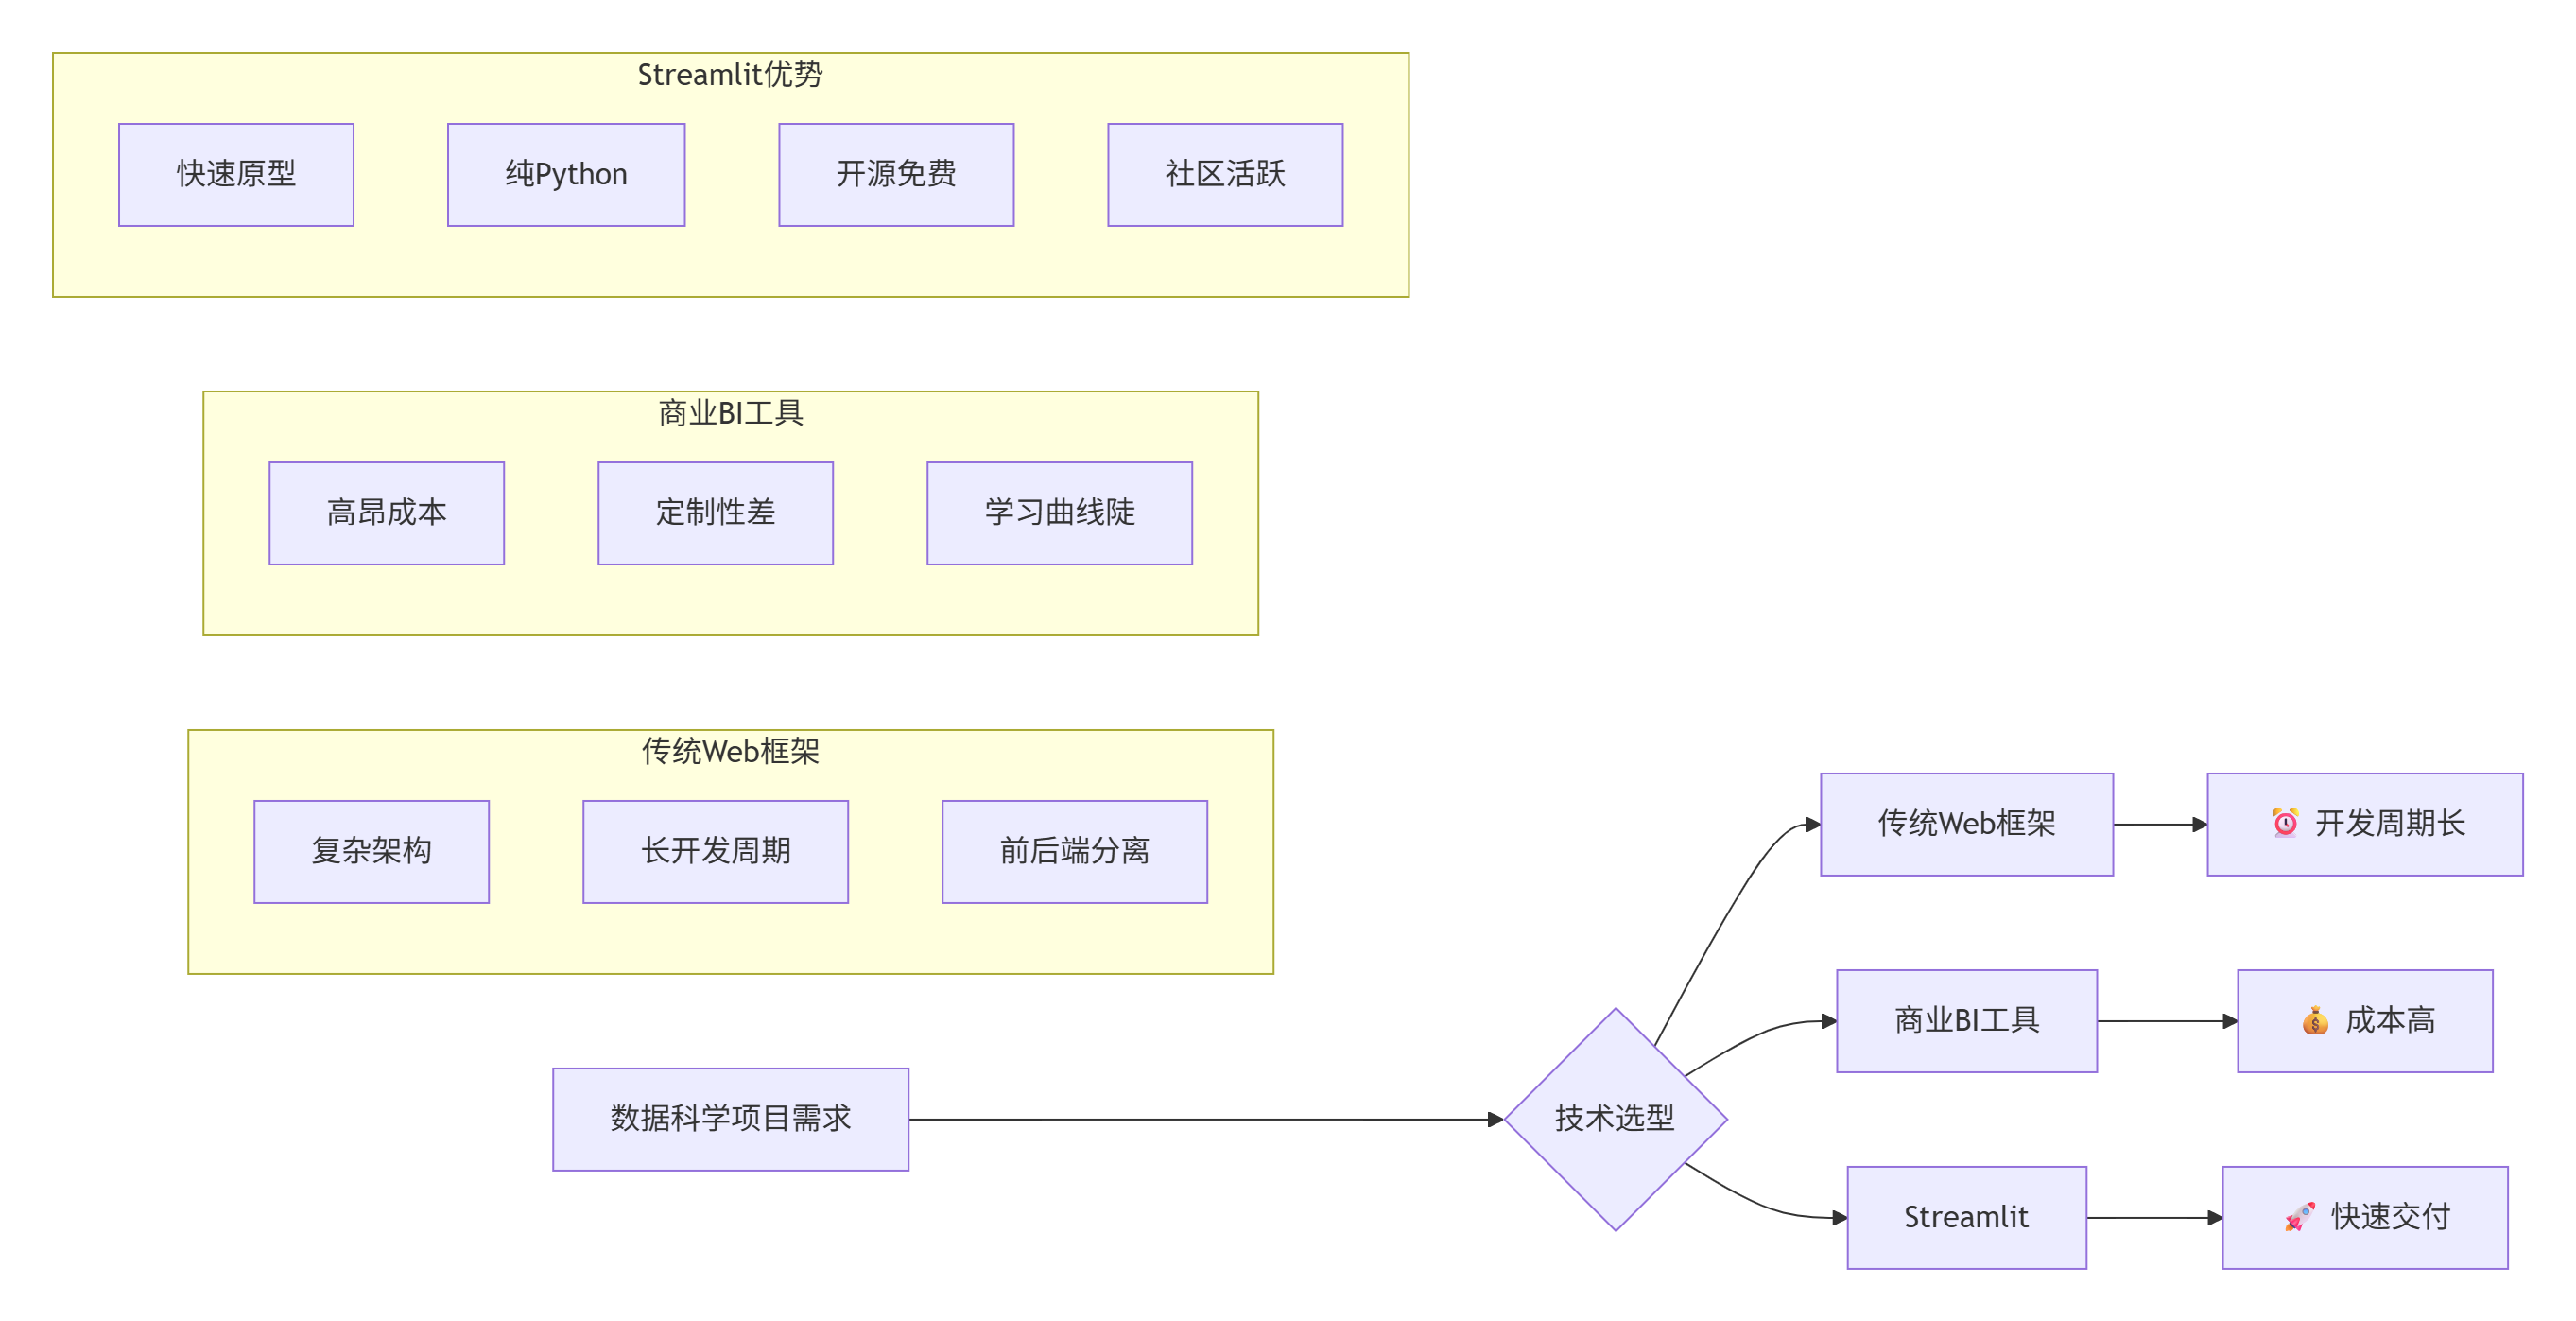
在当今数据驱动的世界中,快速构建交互式数据应用已成为数据科学家、分析师和开发者的核心需求。传统的Web开发流程(前端HTML/CSS/JavaScript + 后端Python/Node.js + 数据库 + API)虽然功能强大,但对于数据科学项目来说往往过于繁琐。这就是Streamlit诞生的背景。
Streamlit是一个开源的Python库,它允许您用纯Python代码快速创建自定义的Web应用。自2019年发布以来,它已经彻底改变了数据科学家分享其工作的方式。让我们通过以下对比来理解Streamlit的独特价值:
1. Streamlit核心概念解析
1.1 Streamlit的设计哲学
Streamlit的设计理念是"为数据科学而生的最快方式"。它基于以下几个核心原则:
-
拥抱Python:所有功能都通过Python API暴露
-
即时反馈:每次交互都会重新运行脚本
-
简单至上:API设计直观,学习曲线平缓
-
开源免费:MIT许可证,社区驱动
1.2 Streamlit的架构模型
理解Streamlit的架构对于高效使用它至关重要:
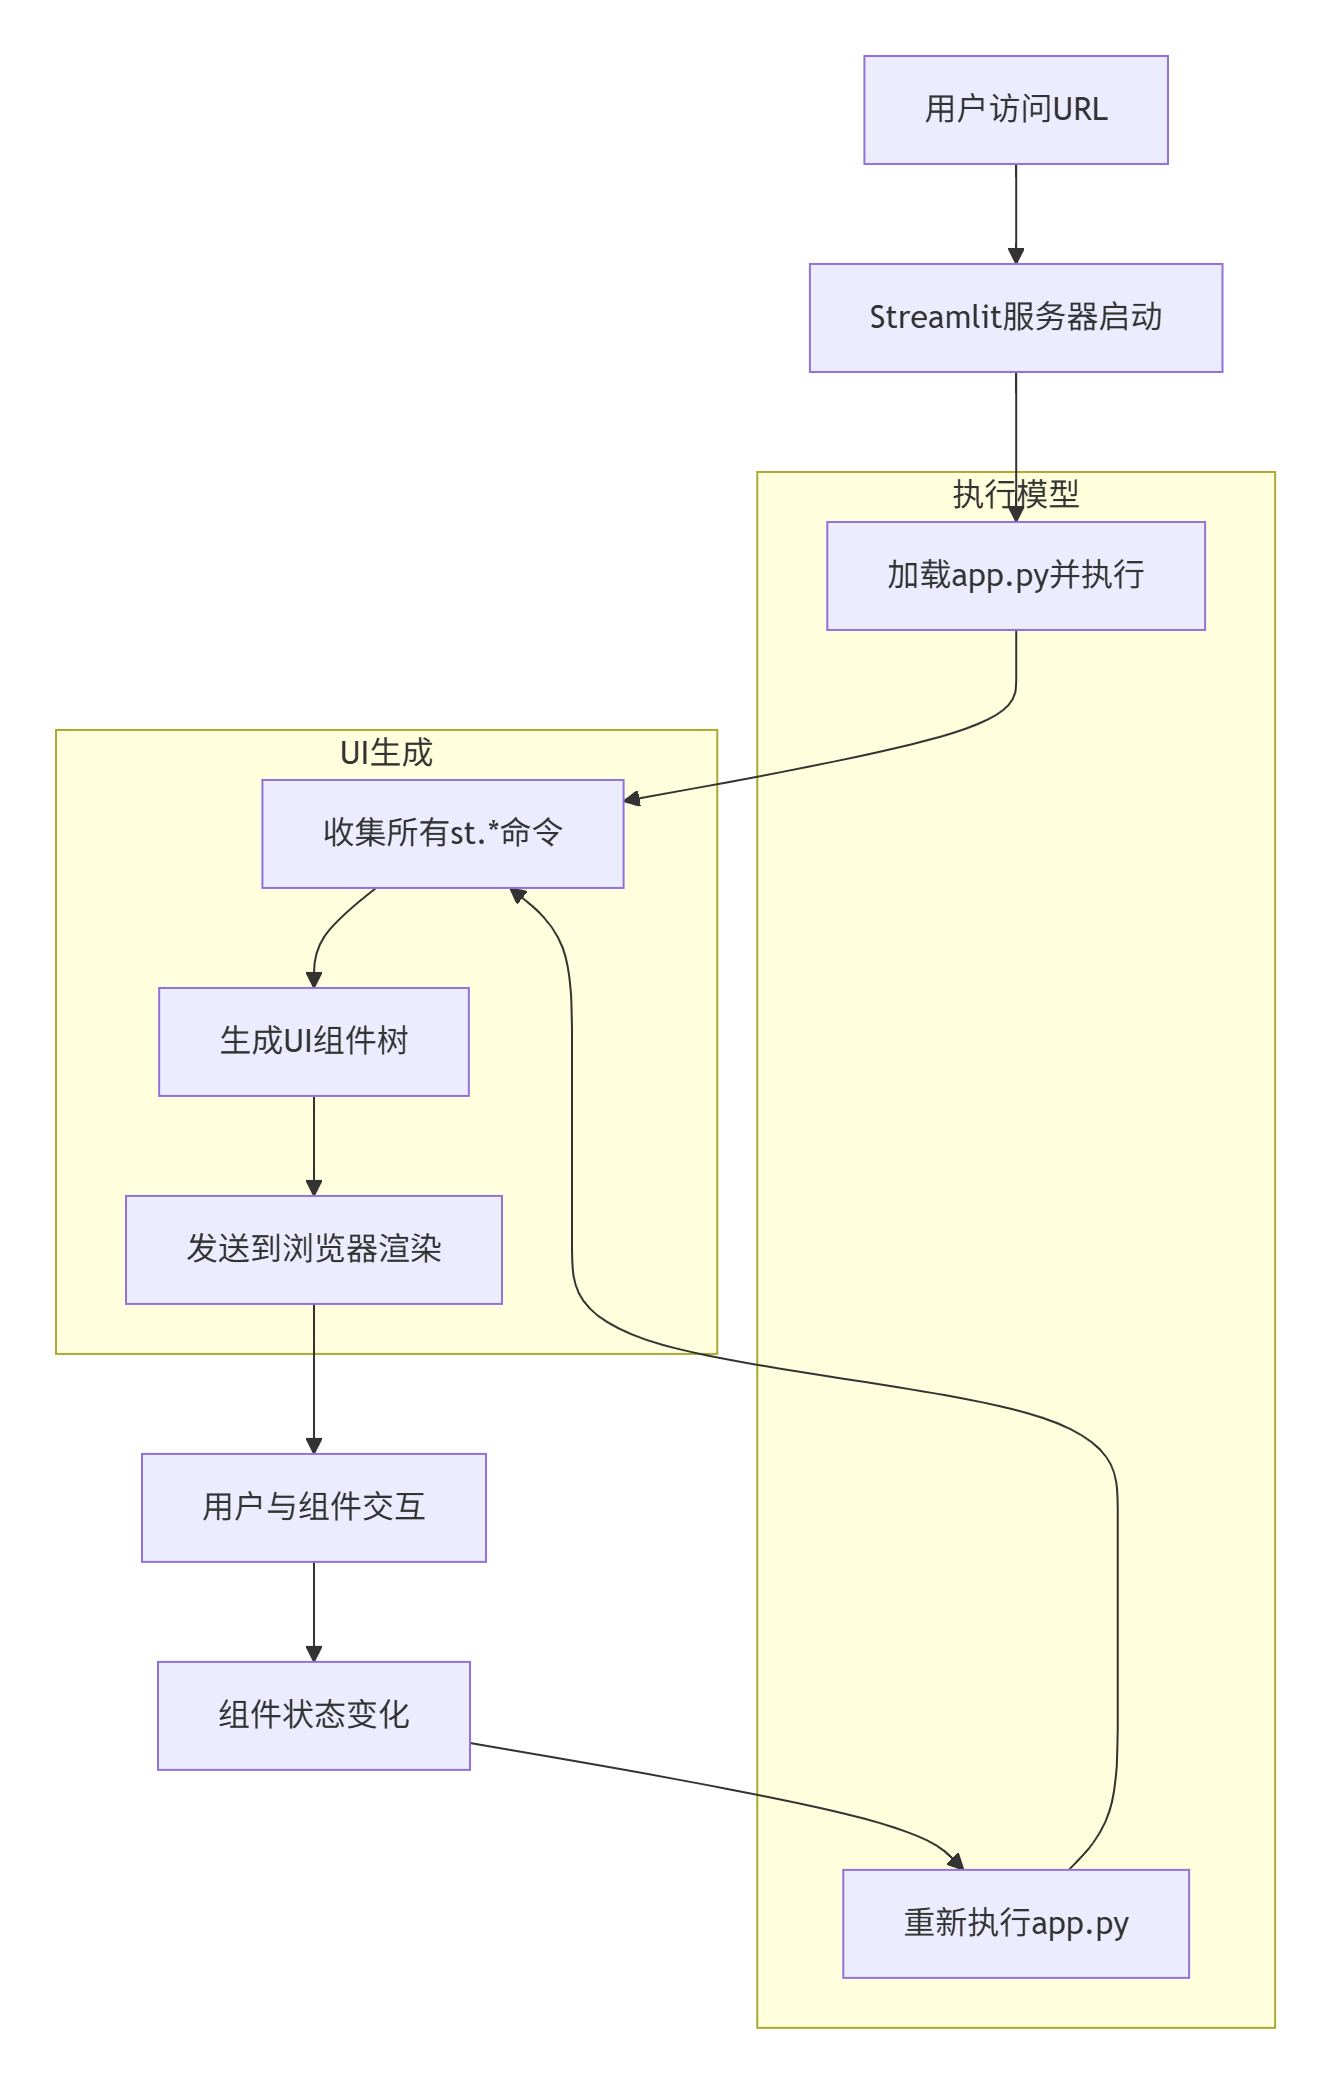
这种独特的执行模型意味着:每次用户交互都会导致整个脚本重新执行。这看起来可能效率低下,但实际上通过智能的缓存机制,Streamlit能够高效地处理这种模式。
1.3 安装与环境配置
在开始第一个Demo之前,让我们确保环境正确配置。下面是推荐的设置方式:
python
# 环境配置检查脚本
# 文件名: check_environment.py
import sys
import subprocess
import pkg_resources

def check_environment():
    """检查Python环境和Streamlit安装"""

    print("=" * 50)
    print("环境检查开始")
    print("=" * 50)

    # 检查Python版本
    python_version = sys.version_info
    print(f"Python版本: {python_version.major}.{python_version.minor}.{python_version.micro}")

    if python_version.major < 3 or (python_version.major == 3 and python_version.minor < 8):
        print("❌ 需要Python 3.8或更高版本")
        return False
    print("✅ Python版本符合要求")

    # 检查必要包
    required_packages = ['streamlit', 'pandas', 'numpy', 'plotly']

    for package in required_packages:
        try:
            version = pkg_resources.get_distribution(package).version
            print(f"✅ {package}: {version}")
        except pkg_resources.DistributionNotFound:
            print(f"❌ {package}: 未安装")

    print("=" * 50)
    print("要安装缺失的包,请运行:")
    print("pip install streamlit pandas numpy plotly matplotlib seaborn")
    print("=" * 50)

    return True

if __name__ == "__main__":
    check_environment()
2. Demo 1: Streamlit最简示例
让我们从最简单的Streamlit应用开始,了解其基本结构。
python
# demo_hello_world.py
"""
Streamlit最简示例 - 演示基础功能
运行方式: streamlit run demo_hello_world.py
功能特点:
1. 展示Streamlit的核心UI组件
2. 演示交互式控件
3. 展示数据可视化
4. 演示布局系统
"""
import streamlit as st
import pandas as pd
import numpy as np
import time
from datetime import datetime
# ============================
# 1. 页面配置
# ============================
st.set_page_config(
page_title="Streamlit快速入门演示",
page_icon="🎯",
layout="wide", # 可选 "centered" 或 "wide"
initial_sidebar_state="expanded" # 可选 "auto", "expanded", "collapsed"
)
# ============================
# 2. 应用标题和介绍
# ============================
st.title("🎯 Streamlit快速入门")
st.markdown("""
欢迎来到Streamlit世界!这是一个完整的入门示例,展示了Streamlit的核心功能。
从简单的文本展示到复杂的数据可视化,您将在这里找到一切。
""")
# 添加一些装饰
st.divider()
# ============================
# 3. 侧边栏 - 控制面板
# ============================
with st.sidebar:
st.header("⚙️ 控制面板")
# 主题选择
theme = st.selectbox(
"选择主题",
["Light", "Dark", "Auto"],
help="选择应用的主题样式"
)
# 更新频率
update_freq = st.slider(
"数据更新频率(秒)",
min_value=1,
max_value=60,
value=10,
help="控制数据自动更新的频率"
)
# 功能开关
st.subheader("功能开关")
show_data = st.checkbox("显示示例数据", value=True)
show_chart = st.checkbox("显示图表", value=True)
show_metrics = st.checkbox("显示指标", value=True)
# 颜色选择
st.subheader("图表颜色")
primary_color = st.color_picker("主色调", "#FF4B4B")
secondary_color = st.color_picker("辅助色", "#0068C9")
# 信息显示
st.divider()
st.info(f"当前时间: {datetime.now().strftime('%Y-%m-%d %H:%M:%S')}")
if st.button("🔄 刷新数据"):
st.rerun()
# ============================
# 4. 主内容区域
# ============================
# 使用列布局
col1, col2, col3 = st.columns(3)
with col1:
st.metric("用户数量", "1,234", "+123")
st.progress(75, text="本月完成度")
with col2:
st.metric("营收", "¥45,678", "+12.5%")
st.progress(45, text="季度目标")
with col3:
st.metric("转化率", "3.45%", "-0.2%")
st.progress(90, text="用户满意度")
# 添加一些间距
st.divider()
# ============================
# 5. 数据展示部分
# ============================
if show_data:
st.header("📊 数据展示")
# 创建示例数据
data_col1, data_col2 = st.columns(2)
with data_col1:
st.subheader("示例数据表")
# 生成随机数据
np.random.seed(42)
data = pd.DataFrame({
'日期': pd.date_range('2023-01-01', periods=10, freq='D'),
'销售额': np.random.randint(1000, 5000, 10),
'利润': np.random.randint(200, 1000, 10),
'访问量': np.random.randint(100, 1000, 10)
})
# 添加计算列
data['利润率'] = (data['利润'] / data['销售额'] * 100).round(2)
# 显示数据表
st.dataframe(
data,
use_container_width=True,
hide_index=True,
column_config={
"销售额": st.column_config.NumberColumn(format="¥%d"),
"利润": st.column_config.NumberColumn(format="¥%d"),
"利润率": st.column_config.NumberColumn(format="%.2f%%")
}
)
# 数据统计
with st.expander("📈 数据统计摘要"):
st.write(data.describe())
with data_col2:
st.subheader("数据操作")
# 文件上传
uploaded_file = st.file_uploader(
"上传数据文件 (CSV/Excel)",
type=['csv', 'xlsx', 'xls'],
help="支持CSV和Excel格式"
)
if uploaded_file is not None:
try:
if uploaded_file.name.endswith('.csv'):
df_uploaded = pd.read_csv(uploaded_file)
else:
df_uploaded = pd.read_excel(uploaded_file)
st.success(f"成功加载文件: {uploaded_file.name}")
st.write(f"数据形状: {df_uploaded.shape}")
st.dataframe(df_uploaded.head(), use_container_width=True)
except Exception as e:
st.error(f"读取文件时出错: {str(e)}")
# 数据过滤选项
st.subheader("数据过滤")
min_sales = st.slider(
"最低销售额",
min_value=int(data['销售额'].min()),
max_value=int(data['销售额'].max()),
value=int(data['销售额'].min()),
step=100
)
filtered_data = data[data['销售额'] >= min_sales]
st.write(f"显示 {len(filtered_data)} 条记录 (总计: {len(data)})")
# ============================
# 6. 可视化图表
# ============================
if show_chart:
st.header("📈 数据可视化")
# 创建示例图表数据
chart_data = pd.DataFrame({
'月份': ['1月', '2月', '3月', '4月', '5月', '6月'],
'产品A': [120, 135, 128, 145, 160, 155],
'产品B': [90, 95, 110, 105, 115, 120],
'产品C': [80, 85, 90, 95, 100, 110]
})
# 图表类型选择
chart_col1, chart_col2 = st.columns(2)
with chart_col1:
chart_type = st.selectbox(
"选择图表类型",
["折线图", "柱状图", "面积图", "散点图"]
)
with chart_col2:
selected_products = st.multiselect(
"选择产品",
['产品A', '产品B', '产品C'],
default=['产品A', '产品B']
)
# 根据选择创建图表
if selected_products:
if chart_type == "折线图":
st.line_chart(
chart_data.set_index('月份')[selected_products],
use_container_width=True
)
elif chart_type == "柱状图":
st.bar_chart(
chart_data.set_index('月份')[selected_products],
use_container_width=True
)
elif chart_type == "面积图":
st.area_chart(
chart_data.set_index('月份')[selected_products],
use_container_width=True
)
# 更多图表选项
with st.expander("📊 高级图表选项"):
# 使用matplotlib创建更多类型的图表
import matplotlib.pyplot as plt
fig, (ax1, ax2) = plt.subplots(1, 2, figsize=(10, 4))
# 饼图
pie_data = chart_data[selected_products].sum()
ax1.pie(pie_data, labels=selected_products, autopct='%1.1f%%')
ax1.set_title('销售额占比')
# 箱线图
box_data = [chart_data[product] for product in selected_products]
ax2.boxplot(box_data, labels=selected_products)
ax2.set_title('销售额分布')
ax2.set_ylabel('销售额')
st.pyplot(fig)
# ============================
# 7. 交互控件展示
# ============================
st.header("🎮 交互控件")
control_col1, control_col2 = st.columns(2)
with control_col1:
st.subheader("输入控件")
# 文本输入
name = st.text_input("请输入您的姓名", "张三")
# 数字输入
age = st.number_input("年龄", min_value=0, max_value=150, value=25, step=1)
# 选择器
job = st.selectbox(
"职业",
["学生", "工程师", "设计师", "产品经理", "数据分析师", "其他"]
)
# 多选
interests = st.multiselect(
"兴趣爱好",
["编程", "阅读", "运动", "音乐", "旅行", "美食"],
default=["编程", "阅读"]
)
# 滑块
salary = st.slider(
"期望薪资 (千元)",
min_value=10,
max_value=200,
value=50,
step=5
)
with control_col2:
st.subheader("操作控件")
# 按钮
if st.button("🎯 提交信息", type="primary"):
st.success(f"信息已提交!姓名: {name}, 年龄: {age}, 职业: {job}")
st.write(f"兴趣爱好: {', '.join(interests)}")
st.write(f"期望薪资: ¥{salary},000")
# 下载按钮
csv_data = chart_data.to_csv(index=False).encode('utf-8')
st.download_button(
label="📥 下载示例数据 (CSV)",
data=csv_data,
file_name="sample_data.csv",
mime="text/csv"
)
# 单选框
notification = st.radio(
"通知方式",
["邮箱", "短信", "应用内", "不通知"]
)
# 开关
dark_mode = st.toggle("深色模式", value=False)
if dark_mode:
st.info("已切换到深色模式")
# 进度条
if st.button("🚀 开始处理"):
progress_bar = st.progress(0)
status_text = st.empty()
for i in range(101):
progress_bar.progress(i)
status_text.text(f"处理中... {i}%")
time.sleep(0.01)
status_text.text("✅ 处理完成!")
# ============================
# 8. 表单示例
# ============================
st.header("📝 表单示例")
with st.form("user_form"):
st.subheader("用户注册表单")
form_col1, form_col2 = st.columns(2)
with form_col1:
username = st.text_input("用户名*")
email = st.text_input("邮箱*")
phone = st.text_input("手机号")
with form_col2:
password = st.text_input("密码*", type="password")
confirm_password = st.text_input("确认密码*", type="password")
country = st.selectbox("国家/地区", ["中国", "美国", "英国", "日本", "其他"])
# 多行文本
bio = st.text_area("个人简介", placeholder="简单介绍一下自己...")
# 表单提交
submitted = st.form_submit_button("注册", type="primary")
if submitted:
if not all([username, email, password, confirm_password]):
st.error("请填写所有必填项(带*的字段)")
elif password != confirm_password:
st.error("两次输入的密码不一致")
else:
st.success("注册成功!")
st.balloons()
# ============================
# 9. 特殊效果和信息展示
# ============================
st.header("✨ 特殊效果")
effect_col1, effect_col2, effect_col3 = st.columns(3)
with effect_col1:
if st.button("🎈 庆祝一下!"):
st.balloons()
st.success("庆祝成功!")
with effect_col2:
if st.button("❄️ 下雪了!"):
st.snow()
st.info("下雪效果激活")
with effect_col3:
if st.button("🎉 撒花庆祝"):
st.balloons()
st.snow()
st.success("双倍庆祝!")
# 信息展示
st.header("ℹ️ 信息展示")
info_tabs = st.tabs(["成功", "信息", "警告", "错误"])
with info_tabs[0]:
st.success("操作成功完成!")
st.success("这是一条成功的消息,用于表示操作成功。")
with info_tabs[1]:
st.info("这是一条信息提示")
st.info("Streamlit提供了多种信息展示组件")
with info_tabs[2]:
st.warning("警告:请注意操作风险")
st.warning("这是一条警告消息")
with info_tabs[3]:
st.error("错误:操作失败")
st.error("这是一条错误消息")
# ============================
# 10. 页脚和附加信息
# ============================
st.divider()
st.caption("""
© 2023 Streamlit入门示例 | 版本 1.0.0 |
[文档](https://docs.streamlit.io) |
[GitHub](https://github.com/streamlit) |
[社区论坛](https://discuss.streamlit.io)
""")
# 添加折叠面板显示技术细节
with st.expander("🔧 技术细节"):
st.code("""
# Streamlit应用的基本结构
1. 导入必要的库
import streamlit as st
import pandas as pd
2. 页面配置
st.set_page_config(...)
3. 侧边栏
with st.sidebar:
# 控制组件
4. 主内容区
st.title("标题")
st.write("内容")
5. 布局组件
col1, col2 = st.columns(2)
6. 交互组件
st.button(), st.slider(), etc.
7. 数据展示
st.dataframe(), st.table()
8. 可视化
st.line_chart(), st.bar_chart()
""", language="python")
# 性能监控
performance_expander = st.expander("📊 性能信息")
with performance_expander:
st.write(f"最后更新: {datetime.now().strftime('%Y-%m-%d %H:%M:%S')}")
st.write(f"数据更新频率: 每{update_freq}秒")
st.write(f"当前主题: {theme}")
st.write(f"显示数据: {show_data}")
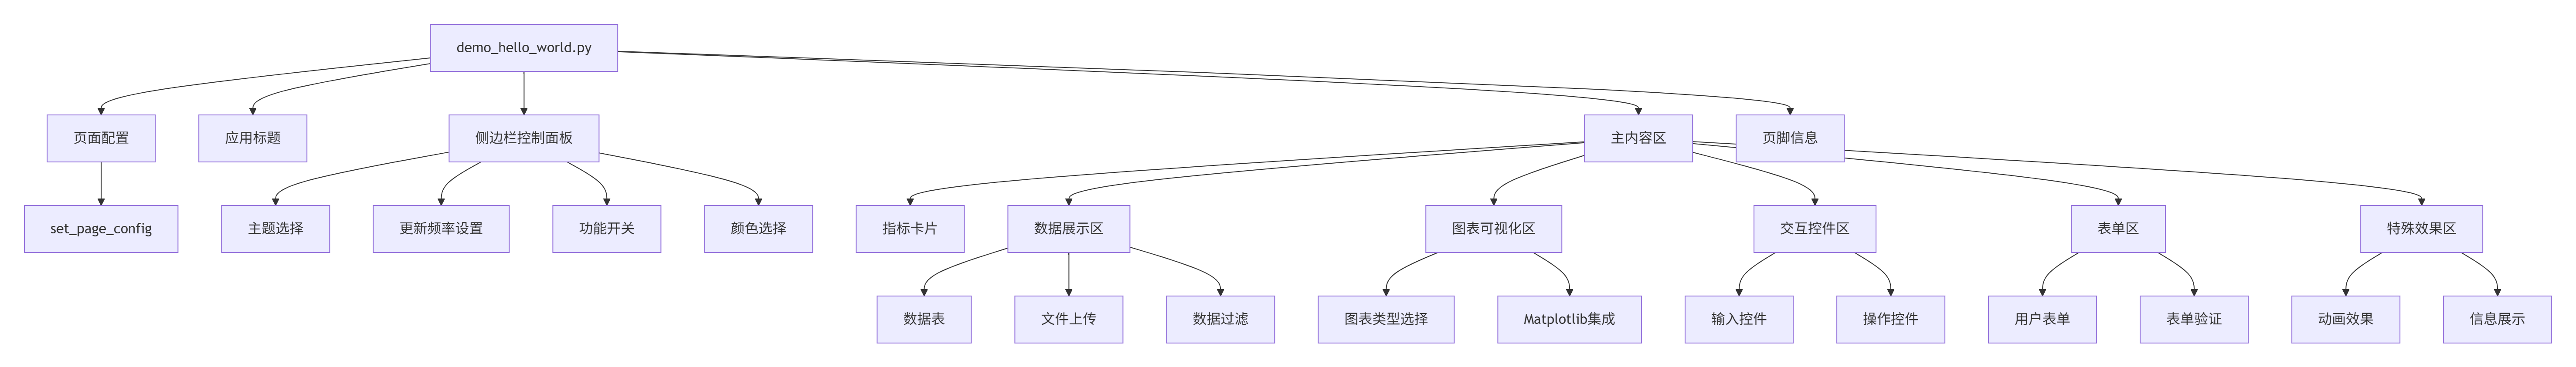
st.write(f"显示图表: {show_chart}")Demo代码结构解析
让我们通过图表来理解这个Demo的代码结构:
3. Demo 2: 交互式数据探索器
第二个Demo展示如何使用Streamlit创建完整的数据分析工具:
python
# demo_data_explorer.py
"""
交互式数据探索器 - 完整的数据分析应用
运行方式: streamlit run demo_data_explorer.py
依赖: pip install streamlit pandas numpy plotly matplotlib seaborn
"""
import streamlit as st
import pandas as pd
import numpy as np
import plotly.express as px
import plotly.graph_objects as go
import matplotlib.pyplot as plt
import seaborn as sns
from datetime import datetime, timedelta
import io
# 页面配置
st.set_page_config(
page_title="交互式数据探索器",
page_icon="🔍",
layout="wide"
)
# 应用标题
st.title("🔍 交互式数据探索器")
st.markdown("""
这是一个完整的数据分析工具,支持数据上传、清洗、探索和可视化。
您可以使用内置数据集,也可以上传自己的数据进行探索。
""")
# 侧边栏 - 数据选择和配置
with st.sidebar:
st.header("📁 数据源配置")
# 数据源选择
data_source = st.radio(
"选择数据源",
["使用示例数据", "上传CSV文件", "上传Excel文件"],
index=0
)
# 文件上传
uploaded_file = None
if data_source == "上传CSV文件":
uploaded_file = st.file_uploader("选择CSV文件", type=['csv'])
elif data_source == "上传Excel文件":
uploaded_file = st.file_uploader("选择Excel文件", type=['xlsx', 'xls'])
st.divider()
# 数据处理选项
st.header("⚙️ 数据处理选项")
# 缺失值处理
missing_strategy = st.selectbox(
"缺失值处理",
["不处理", "删除包含缺失值的行", "用均值填充", "用中位数填充", "用众数填充"]
)
# 数据采样
if st.checkbox("启用数据采样"):
sample_size = st.slider("采样比例 (%)", 1, 100, 100)
else:
sample_size = 100
# 高级选项
with st.expander("高级选项"):
encoding = st.selectbox(
"文件编码",
["utf-8", "gbk", "gb2312", "latin1"],
index=0
)
delimiter = st.selectbox(
"分隔符(CSV)",
[",", ";", "\t", "|"],
index=0
)
# 主内容区
tab1, tab2, tab3, tab4, tab5 = st.tabs([
"📥 数据加载", "🔧 数据清洗", "📊 数据探索",
"📈 数据可视化", "📋 报告生成"
])
# Tab 1: 数据加载
with tab1:
st.header("📥 数据加载与预览")
@st.cache_data
def load_sample_data():
"""加载示例数据集"""
# 创建示例销售数据
np.random.seed(42)
dates = pd.date_range('2023-01-01', '2023-12-31', freq='D')
data = {
'日期': dates,
'产品类别': np.random.choice(['电子产品', '服装', '食品', '家居', '图书'], len(dates)),
'地区': np.random.choice(['华北', '华东', '华南', '华中', '西南'], len(dates)),
'销售额': np.random.exponential(1000, len(dates)).cumsum(),
'利润': np.random.normal(200, 50, len(dates)).cumsum(),
'订单数量': np.random.poisson(50, len(dates)),
'客户评分': np.random.uniform(3.0, 5.0, len(dates)),
'促销活动': np.random.choice([True, False], len(dates), p=[0.3, 0.7]),
'退货数量': np.random.poisson(2, len(dates))
}
# 添加一些缺失值用于演示
for col in ['销售额', '利润', '客户评分']:
idx = np.random.choice(len(dates), int(len(dates)*0.05), replace=False)
data[col].iloc[idx] = np.nan
df = pd.DataFrame(data)
# 添加派生特征
df['月份'] = df['日期'].dt.month
df['季度'] = df['日期'].dt.quarter
df['星期'] = df['日期'].dt.day_name()
df['是否周末'] = df['日期'].dt.dayofweek >= 5
return df
def load_uploaded_data(file, file_type, encoding='utf-8', delimiter=','):
"""加载上传的数据"""
try:
if file_type == 'csv':
df = pd.read_csv(file, encoding=encoding, delimiter=delimiter)
else: # excel
df = pd.read_excel(file)
# 自动检测日期列
for col in df.columns:
if df[col].dtype == 'object':
try:
df[col] = pd.to_datetime(df[col])
except:
pass
return df, None
except Exception as e:
return None, str(e)
# 加载数据
if data_source == "使用示例数据":
df = load_sample_data()
st.success("✅ 已加载示例数据集")
elif uploaded_file is not None:
file_type = 'csv' if data_source == "上传CSV文件" else 'excel'
df, error = load_uploaded_data(
uploaded_file,
file_type,
encoding=encoding,
delimiter=delimiter
)
if error:
st.error(f"❌ 加载文件时出错: {error}")
st.stop()
else:
st.success(f"✅ 已加载文件: {uploaded_file.name}")
else:
st.info("请上传文件或使用示例数据")
st.stop()
# 数据采样
if sample_size < 100:
df = df.sample(frac=sample_size/100, random_state=42)
st.info(f"📊 已对数据进行采样: {sample_size}%")
# 显示数据基本信息
col1, col2, col3, col4 = st.columns(4)
with col1:
st.metric("数据行数", len(df))
with col2:
st.metric("数据列数", len(df.columns))
with col3:
missing_values = df.isnull().sum().sum()
st.metric("缺失值数量", missing_values)
with col4:
st.metric("内存使用", f"{df.memory_usage(deep=True).sum() / 1024**2:.2f} MB")
st.divider()
# 数据显示选项
display_options = st.columns(3)
with display_options[0]:
show_rows = st.slider("显示行数", 5, 100, 10)
with display_options[1]:
start_row = st.number_input("起始行", 0, len(df)-show_rows, 0)
with display_options[2]:
sort_by = st.selectbox("排序字段", ['无'] + list(df.columns))
# 处理排序
display_df = df.iloc[start_row:start_row+show_rows]
if sort_by != '无':
display_df = display_df.sort_values(sort_by)
# 显示数据
st.subheader("数据预览")
st.dataframe(display_df, use_container_width=True)
# 数据信息
with st.expander("📋 数据详细信息"):
st.subheader("数据类型")
dtype_df = pd.DataFrame({
'列名': df.columns,
'数据类型': df.dtypes.astype(str).values,
'非空数量': df.count().values,
'空值数量': df.isnull().sum().values,
'空值比例': (df.isnull().sum() / len(df) * 100).round(2).values
})
st.dataframe(dtype_df, use_container_width=True)
st.subheader("内存使用详情")
memory_df = pd.DataFrame({
'列名': df.columns,
'内存(MB)': (df.memory_usage(deep=True) / 1024**2).round(4).values
}).sort_values('内存(MB)', ascending=False)
st.dataframe(memory_df, use_container_width=True)
# Tab 2: 数据清洗
with tab2:
st.header("🔧 数据清洗与预处理")
if 'df' not in locals():
st.warning("请先加载数据")
st.stop()
# 创建数据清洗副本
df_clean = df.copy()
# 列选择
st.subheader("列选择")
selected_columns = st.multiselect(
"选择要保留的列",
df_clean.columns.tolist(),
default=df_clean.columns.tolist()
)
if selected_columns:
df_clean = df_clean[selected_columns]
# 缺失值处理
st.subheader("缺失值处理")
if missing_strategy != "不处理":
missing_before = df_clean.isnull().sum().sum()
if missing_strategy == "删除包含缺失值的行":
df_clean = df_clean.dropna()
elif missing_strategy == "用均值填充":
numeric_cols = df_clean.select_dtypes(include=[np.number]).columns
df_clean[numeric_cols] = df_clean[numeric_cols].fillna(df_clean[numeric_cols].mean())
elif missing_strategy == "用中位数填充":
numeric_cols = df_clean.select_dtypes(include=[np.number]).columns
df_clean[numeric_cols] = df_clean[numeric_cols].fillna(df_clean[numeric_cols].median())
elif missing_strategy == "用众数填充":
for col in df_clean.columns:
if df_clean[col].dtype == 'object' or df_clean[col].dtype.name == 'category':
mode_val = df_clean[col].mode()[0] if not df_clean[col].mode().empty else None
df_clean[col] = df_clean[col].fillna(mode_val)
missing_after = df_clean.isnull().sum().sum()
st.info(f"处理前缺失值: {missing_before}, 处理后缺失值: {missing_after}")
# 异常值检测
st.subheader("异常值检测与处理")
outlier_col = st.selectbox(
"选择要检测异常值的数值列",
df_clean.select_dtypes(include=[np.number]).columns.tolist()
)
if outlier_col:
Q1 = df_clean[outlier_col].quantile(0.25)
Q3 = df_clean[outlier_col].quantile(0.75)
IQR = Q3 - Q1
lower_bound = Q1 - 1.5 * IQR
upper_bound = Q3 + 1.5 * IQR
outliers = df_clean[(df_clean[outlier_col] < lower_bound) | (df_clean[outlier_col] > upper_bound)]
col1, col2, col3, col4 = st.columns(4)
with col1:
st.metric("Q1 (25%)", f"{Q1:.2f}")
with col2:
st.metric("Q3 (75%)", f"{Q3:.2f}")
with col3:
st.metric("IQR", f"{IQR:.2f}")
with col4:
st.metric("异常值数量", len(outliers))
# 异常值处理选项
if len(outliers) > 0:
outlier_strategy = st.selectbox(
"异常值处理策略",
["不处理", "删除异常值", "用边界值替换"]
)
if outlier_strategy == "删除异常值":
df_clean = df_clean[~df_clean.index.isin(outliers.index)]
st.success(f"已删除 {len(outliers)} 个异常值")
elif outlier_strategy == "用边界值替换":
df_clean.loc[df_clean[outlier_col] < lower_bound, outlier_col] = lower_bound
df_clean.loc[df_clean[outlier_col] > upper_bound, outlier_col] = upper_bound
st.success("异常值已用边界值替换")
# 数据类型转换
st.subheader("数据类型转换")
type_col1, type_col2 = st.columns(2)
with type_col1:
columns_to_convert = st.multiselect(
"选择要转换的列",
df_clean.columns.tolist()
)
with type_col2:
target_type = st.selectbox(
"目标类型",
["数值型", "字符型", "日期型", "分类型"]
)
if st.button("应用类型转换") and columns_to_convert:
for col in columns_to_convert:
try:
if target_type == "数值型":
df_clean[col] = pd.to_numeric(df_clean[col], errors='coerce')
elif target_type == "字符型":
df_clean[col] = df_clean[col].astype(str)
elif target_type == "日期型":
df_clean[col] = pd.to_datetime(df_clean[col], errors='coerce')
elif target_type == "分类型":
df_clean[col] = df_clean[col].astype('category')
st.success(f"列 '{col}' 已转换为 {target_type}")
except Exception as e:
st.error(f"转换列 '{col}' 时出错: {str(e)}")
# 显示清洗后的数据
st.subheader("清洗后数据预览")
st.dataframe(df_clean.head(), use_container_width=True)
# 数据清洗统计
with st.expander("📊 清洗统计"):
st.write(f"原始数据形状: {df.shape}")
st.write(f"清洗后数据形状: {df_clean.shape}")
st.write(f"删除的行数: {len(df) - len(df_clean)}")
st.write(f"删除的列数: {len(df.columns) - len(df_clean.columns)}")
# Tab 3: 数据探索
with tab3:
st.header("📊 数据探索性分析")
if 'df_clean' not in locals():
df_clean = df
# 描述性统计
st.subheader("描述性统计")
stat_col1, stat_col2, stat_col3 = st.columns(3)
with stat_col1:
stat_type = st.selectbox(
"统计类型",
["所有列", "仅数值列", "仅分类列"]
)
with stat_col2:
percentiles = st.multiselect(
"百分位数",
["25%", "50%", "75%", "90%", "95%", "99%"],
default=["25%", "50%", "75%"]
)
with stat_col3:
if st.button("重新计算统计"):
st.rerun()
# 计算统计
if stat_type == "所有列":
stats_df = df_clean.describe(include='all', percentiles=[p/100 for p in [25, 50, 75, 90, 95, 99]])
elif stat_type == "仅数值列":
stats_df = df_clean.describe(include=[np.number], percentiles=[p/100 for p in [25, 50, 75, 90, 95, 99]])
else:
stats_df = df_clean.describe(include=['object', 'category'])
st.dataframe(stats_df, use_container_width=True)
# 相关性分析
st.subheader("相关性分析")
numeric_cols = df_clean.select_dtypes(include=[np.number]).columns
if len(numeric_cols) >= 2:
corr_method = st.selectbox(
"相关性计算方法",
["皮尔逊相关系数", "斯皮尔曼相关系数", "肯德尔相关系数"]
)
if corr_method == "皮尔逊相关系数":
corr_matrix = df_clean[numeric_cols].corr(method='pearson')
elif corr_method == "斯皮尔曼相关系数":
corr_matrix = df_clean[numeric_cols].corr(method='spearman')
else:
corr_matrix = df_clean[numeric_cols].corr(method='kendall')
# 显示相关性矩阵
st.write("相关性矩阵:")
st.dataframe(corr_matrix.style.background_gradient(cmap='coolwarm', axis=None),
use_container_width=True)
# 相关性热图
fig, ax = plt.subplots(figsize=(10, 8))
sns.heatmap(corr_matrix, annot=True, fmt='.2f', cmap='coolwarm',
center=0, square=True, ax=ax)
ax.set_title(f'相关性热图 ({corr_method})')
st.pyplot(fig)
else:
st.warning("数值列不足,无法计算相关性")
# 分布分析
st.subheader("分布分析")
dist_col = st.selectbox(
"选择要分析的列",
numeric_cols if len(numeric_cols) > 0 else df_clean.columns
)
if dist_col in df_clean.columns:
col1, col2 = st.columns(2)
with col1:
# 直方图
fig1, ax1 = plt.subplots(figsize=(8, 6))
df_clean[dist_col].hist(bins=30, ax=ax1, edgecolor='black')
ax1.set_title(f'{dist_col} 分布直方图')
ax1.set_xlabel(dist_col)
ax1.set_ylabel('频数')
st.pyplot(fig1)
with col2:
# 箱线图
fig2, ax2 = plt.subplots(figsize=(8, 6))
df_clean[[dist_col]].boxplot(ax=ax2)
ax2.set_title(f'{dist_col} 箱线图')
ax2.set_ylabel(dist_col)
st.pyplot(fig2)
# 分组分析
st.subheader("分组分析")
group_cols = df_clean.select_dtypes(include=['object', 'category']).columns.tolist()
value_cols = df_clean.select_dtypes(include=[np.number]).columns.tolist()
if group_cols and value_cols:
group_by = st.selectbox("分组字段", group_cols)
agg_col = st.selectbox("聚合字段", value_cols)
agg_func = st.selectbox("聚合函数", ["均值", "总和", "中位数", "标准差", "最小值", "最大值"])
func_map = {
"均值": "mean",
"总和": "sum",
"中位数": "median",
"标准差": "std",
"最小值": "min",
"最大值": "max"
}
grouped = df_clean.groupby(group_by)[agg_col].agg(func_map[agg_func]).reset_index()
grouped = grouped.sort_values(agg_col, ascending=False)
col1, col2 = st.columns(2)
with col1:
st.write(f"按 {group_by} 分组 - {agg_func}")
st.dataframe(grouped, use_container_width=True)
with col2:
fig, ax = plt.subplots(figsize=(10, 6))
bars = ax.bar(grouped[group_by].astype(str), grouped[agg_col])
ax.set_title(f'{agg_col} 按 {group_by} 分组 ({agg_func})')
ax.set_xlabel(group_by)
ax.set_ylabel(agg_col)
ax.tick_params(axis='x', rotation=45)
# 添加数值标签
for bar in bars:
height = bar.get_height()
ax.text(bar.get_x() + bar.get_width()/2., height,
f'{height:.2f}', ha='center', va='bottom')
st.pyplot(fig)
# Tab 4: 数据可视化
with tab4:
st.header("📈 高级数据可视化")
if 'df_clean' not in locals():
df_clean = df
# 可视化类型选择
viz_type = st.selectbox(
"可视化类型",
["散点图", "折线图", "柱状图", "箱线图", "热力图", "分布图", "相关性矩阵"]
)
if viz_type == "散点图":
col1, col2, col3 = st.columns(3)
with col1:
x_axis = st.selectbox("X轴", numeric_cols)
with col2:
y_axis = st.selectbox("Y轴", numeric_cols)
with col3:
color_by = st.selectbox("颜色分组", ["无"] + group_cols)
if x_axis and y_axis:
if color_by == "无":
fig = px.scatter(df_clean, x=x_axis, y=y_axis,
title=f'{y_axis} vs {x_axis}')
else:
fig = px.scatter(df_clean, x=x_axis, y=y_axis, color=color_by,
title=f'{y_axis} vs {x_axis} (按{color_by}分组)')
st.plotly_chart(fig, use_container_width=True)
elif viz_type == "折线图":
if '日期' in df_clean.columns:
time_cols = ['日期']
else:
time_cols = df_clean.select_dtypes(include=['datetime64']).columns.tolist()
if time_cols:
time_col = st.selectbox("时间列", time_cols)
value_col = st.selectbox("数值列", numeric_cols)
group_col = st.selectbox("分组列(可选)", ["无"] + group_cols)
if time_col and value_col:
if group_col == "无":
fig = px.line(df_clean, x=time_col, y=value_col,
title=f'{value_col} 随时间变化')
else:
fig = px.line(df_clean, x=time_col, y=value_col, color=group_col,
title=f'{value_col} 随时间变化 (按{group_col}分组)')
st.plotly_chart(fig, use_container_width=True)
else:
st.warning("未找到日期时间列")
elif viz_type == "柱状图":
col1, col2, col3 = st.columns(3)
with col1:
x_axis = st.selectbox("X轴(分类)", ["无"] + group_cols)
with col2:
y_axis = st.selectbox("Y轴(数值)", numeric_cols)
with col3:
agg_func = st.selectbox("聚合函数", ["计数", "求和", "平均值"])
if x_axis != "无" and y_axis:
if agg_func == "计数":
agg_data = df_clean.groupby(x_axis).size().reset_index(name='计数')
y_col = '计数'
else:
func = "sum" if agg_func == "求和" else "mean"
agg_data = df_clean.groupby(x_axis)[y_axis].agg(func).reset_index()
y_col = y_axis
fig = px.bar(agg_data, x=x_axis, y=y_col,
title=f'{agg_func}柱状图')
st.plotly_chart(fig, use_container_width=True)
# 更多可视化选项...
# 由于篇幅限制,这里省略了其他可视化类型的代码
# Tab 5: 报告生成
with tab5:
st.header("📋 分析报告生成")
# 报告配置
st.subheader("报告配置")
report_col1, report_col2 = st.columns(2)
with report_col1:
report_title = st.text_input("报告标题", "数据分析报告")
include_summary = st.checkbox("包含摘要", True)
include_statistics = st.checkbox("包含统计信息", True)
include_visualizations = st.checkbox("包含可视化", True)
with report_col2:
report_format = st.selectbox("报告格式", ["HTML", "Markdown", "Text"])
include_recommendations = st.checkbox("包含建议", True)
auto_analyze = st.checkbox("自动分析", False)
# 生成报告
if st.button("生成分析报告", type="primary"):
with st.spinner("正在生成报告..."):
# 模拟报告生成
time.sleep(2)
# 创建报告内容
report_content = []
if report_format == "HTML":
report_content.append(f"<h1>{report_title}</h1>")
report_content.append(f"<p>生成时间: {datetime.now().strftime('%Y-%m-%d %H:%M:%S')}</p>")
report_content.append(f"<p>数据行数: {len(df_clean) if 'df_clean' in locals() else len(df)}</p>")
report_content.append(f"<p>数据列数: {len(df_clean.columns) if 'df_clean' in locals() else len(df.columns)}</p>")
if include_summary:
report_content.append("<h2>数据摘要</h2>")
report_content.append("<p>这是一份自动生成的数据分析报告。</p>")
if include_statistics:
report_content.append("<h2>统计信息</h2>")
# 添加统计信息...
if include_recommendations:
report_content.append("<h2>建议</h2>")
report_content.append("<ul>")
report_content.append("<li>建议定期清理数据中的缺失值</li>")
report_content.append("<li>考虑对数值列进行标准化处理</li>")
report_content.append("<li>建议监控异常值对分析结果的影响</li>")
report_content.append("</ul>")
elif report_format == "Markdown":
report_content.append(f"# {report_title}\n")
report_content.append(f"**生成时间**: {datetime.now().strftime('%Y-%m-%d %H:%M:%S')}\n")
report_content.append(f"**数据行数**: {len(df_clean) if 'df_clean' in locals() else len(df)}\n")
report_content.append(f"**数据列数**: {len(df_clean.columns) if 'df_clean' in locals() else len(df.columns)}\n")
if include_summary:
report_content.append("\n## 数据摘要\n")
report_content.append("这是一份自动生成的数据分析报告。\n")
else: # Text
report_content.append(f"{report_title}\n")
report_content.append("=" * 50)
report_content.append(f"生成时间: {datetime.now().strftime('%Y-%m-%d %H:%M:%S')}")
report_content.append(f"数据行数: {len(df_clean) if 'df_clean' in locals() else len(df)}")
report_content.append(f"数据列数: {len(df_clean.columns) if 'df_clean' in locals() else len(df.columns)}")
# 显示报告
st.subheader("生成的分析报告")
report_text = "\n".join(report_content)
st.text_area("报告内容", report_text, height=300)
# 下载按钮
if report_format == "HTML":
mime_type = "text/html"
file_ext = "html"
elif report_format == "Markdown":
mime_type = "text/markdown"
file_ext = "md"
else:
mime_type = "text/plain"
file_ext = "txt"
st.download_button(
label=f"📥 下载报告 (.{file_ext})",
data=report_text,
file_name=f"data_analysis_report_{datetime.now().strftime('%Y%m%d_%H%M%S')}.{file_ext}",
mime=mime_type
)
# 页脚
st.divider()
st.caption("""
交互式数据探索器 | 版本 1.0.0 |
使用Streamlit构建 | 数据仅供参考
""")
# 侧边栏底部信息
with st.sidebar:
st.divider()
st.info("""
**使用提示:**
1. 从"数据加载"标签页开始
2. 在"数据清洗"中处理数据质量问题
3. 使用"数据探索"了解数据特征
4. 在"数据可视化"中创建图表
5. 最后生成分析报告
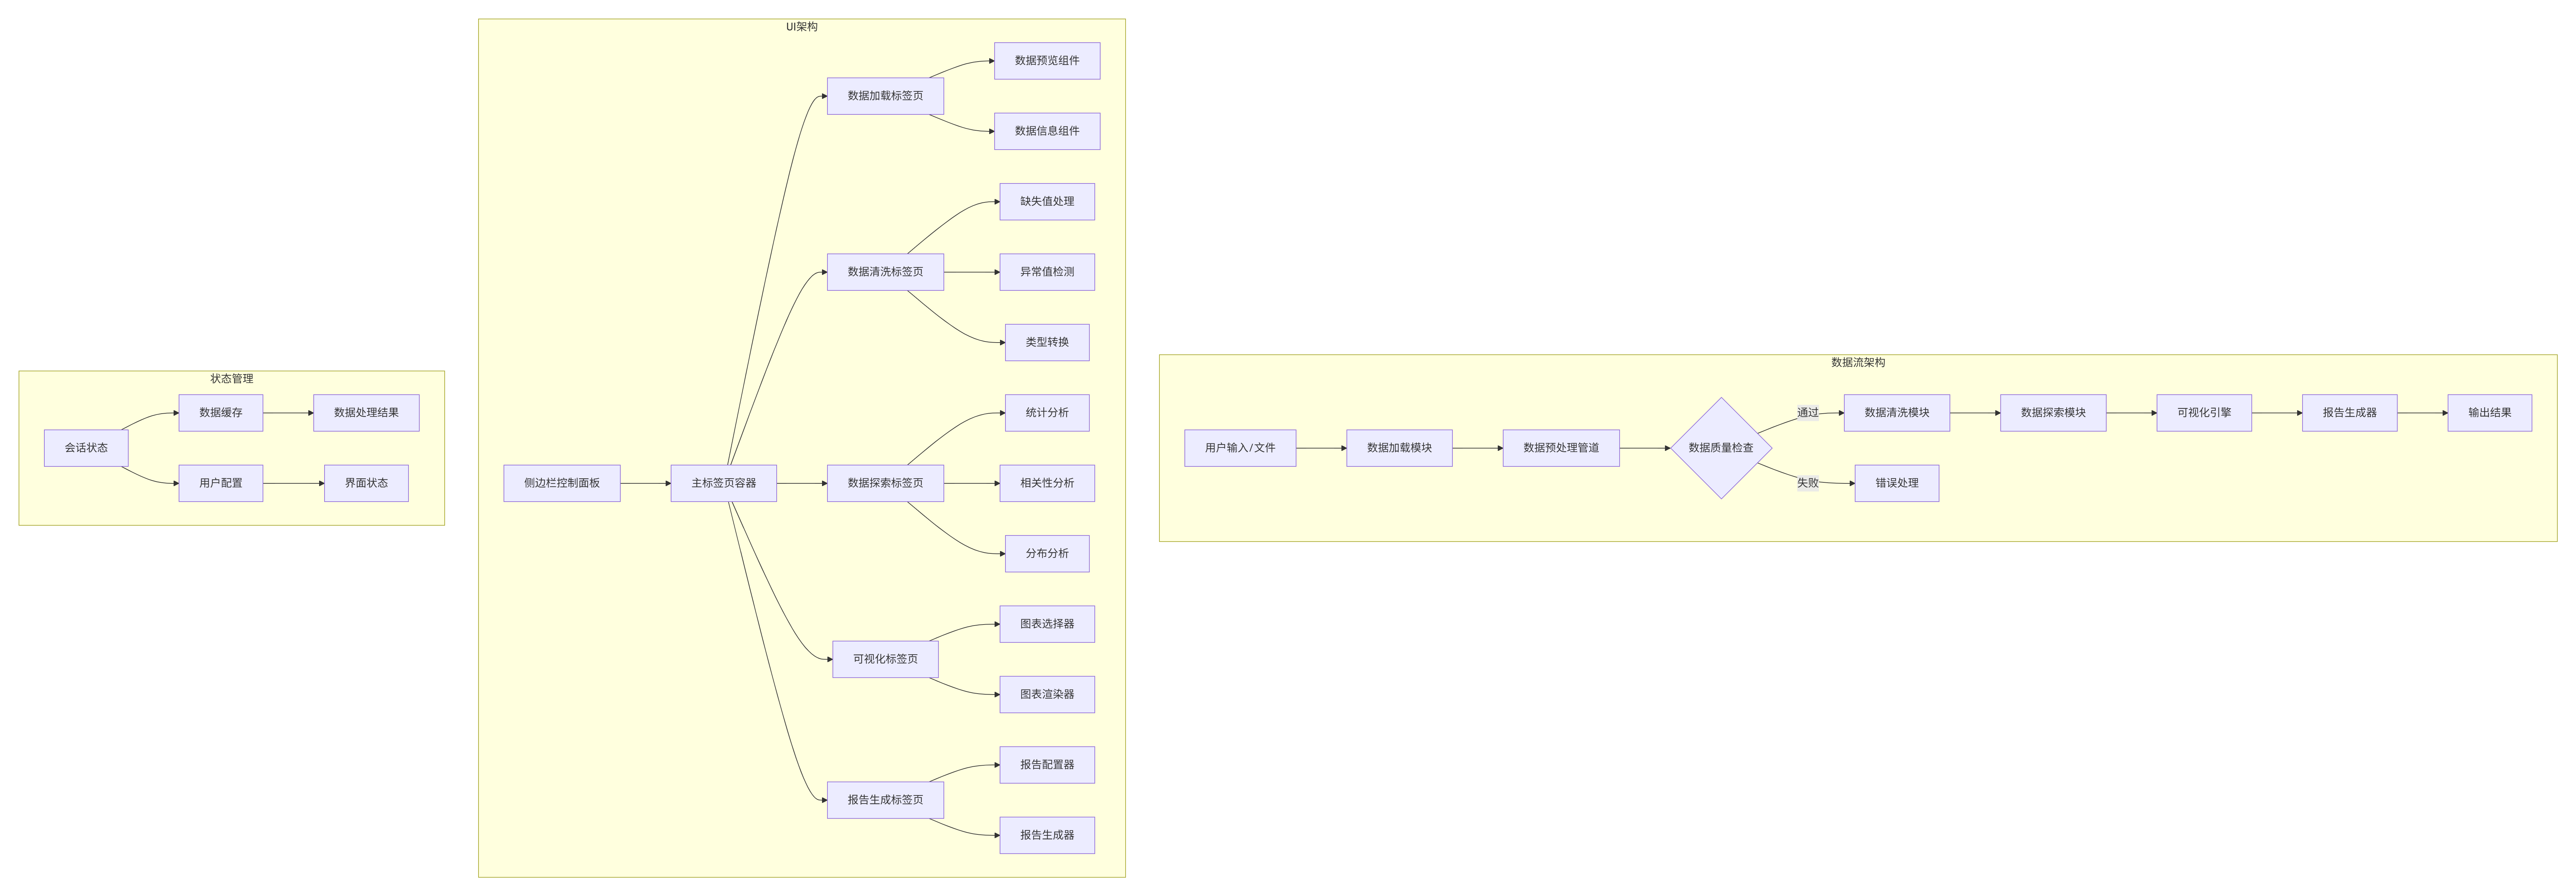
""")应用架构解析
这个复杂应用的架构如下:
4. Streamlit核心概念深度解析
4.1 Streamlit的执行模型
理解Streamlit的执行模型是掌握其核心的关键。让我们通过一个简单的例子来说明:
python
# execution_model.py
"""
Streamlit执行模型演示
展示每次交互如何导致脚本重新执行
"""

import streamlit as st
import time

st.title("Streamlit执行模型演示")

# 初始化计数器
if 'counter' not in st.session_state:
    st.session_state.counter = 0

# 显示当前计数
st.write(f"当前计数: {st.session_state.counter}")

# 显示脚本执行次数
if 'execution_count' not in st.session_state:
    st.session_state.execution_count = 0

st.session_state.execution_count += 1
st.write(f"脚本执行次数: {st.session_state.execution_count}")

# 交互按钮
col1, col2, col3 = st.columns(3)

with col1:
    if st.button("增加计数"):
        st.session_state.counter += 1
        st.rerun()  # 手动触发重新执行

with col2:
    if st.button("减少计数"):
        st.session_state.counter -= 1
        st.rerun()

with col3:
    if st.button("重置计数"):
        st.session_state.counter = 0
        st.rerun()

# 显示执行时间戳
st.write(f"最后执行时间: {time.ctime()}")

# 演示Streamlit的执行流程
st.divider()
st.subheader("执行流程说明")

st.markdown("""
**Streamlit执行流程:**
1. 用户与界面交互(如点击按钮)
2. 触发脚本重新执行
3. 从头到尾运行整个脚本
4. 更新界面状态
5. 等待下一次交互

**关键特点:**
- 每次交互都重新运行脚本
- 使用`st.session_state`保持状态
- 通过缓存避免重复计算
- 自动管理界面更新
""")

# 演示缓存
@st.cache_data
def expensive_computation(n):
    """模拟耗时计算"""
    time.sleep(2)  # 模拟2秒计算
    return n * 2

if st.button("执行耗时计算"):
    with st.spinner("计算中..."):
        result = expensive_computation(10)
        st.success(f"计算结果: {result}")
4.2 会话状态(Session State)深度解析
会话状态是Streamlit中管理状态的核心机制。让我们通过一个更复杂的例子来理解:
python
# session_state_demo.py
"""
Streamlit会话状态深度解析
展示不同状态管理模式的对比
"""
import streamlit as st
import json
import pickle
import hashlib
from datetime import datetime
st.set_page_config(
page_title="会话状态演示",
page_icon="💾",
layout="wide"
)
st.title("💾 Streamlit会话状态深度解析")
# 标签页
tab1, tab2, tab3, tab4 = st.tabs([
"基础使用", "状态同步", "高级模式", "状态持久化"
])
# Tab 1: 基础使用
with tab1:
st.header("1. 会话状态基础")
st.markdown("""
**会话状态的核心概念:**
- 跨交互保持数据
- 类似于Python字典
- 键值对存储
- 自动序列化/反序列化
""")
# 初始化状态
if 'user_info' not in st.session_state:
st.session_state.user_info = {
'name': '张三',
'age': 25,
'preferences': []
}
if 'history' not in st.session_state:
st.session_state.history = []
# 状态操作
col1, col2 = st.columns(2)
with col1:
st.subheader("当前状态")
st.json(st.session_state)
# 状态信息
st.metric("状态键数量", len(st.session_state))
st.metric("历史记录数", len(st.session_state.history))
with col2:
st.subheader("状态操作")
# 修改状态
new_name = st.text_input("修改姓名", st.session_state.user_info['name'])
new_age = st.number_input("修改年龄",
min_value=0, max_value=150,
value=st.session_state.user_info['age'])
if st.button("更新用户信息"):
st.session_state.user_info['name'] = new_name
st.session_state.user_info['age'] = new_age
st.session_state.history.append({
'action': 'update_user_info',
'timestamp': datetime.now().strftime('%Y-%m-%d %H:%M:%S'),
'old_name': st.session_state.user_info['name'],
'new_name': new_name
})
st.success("用户信息已更新")
st.rerun()
# 添加偏好
preference = st.text_input("添加偏好")
if st.button("添加偏好") and preference:
if preference not in st.session_state.user_info['preferences']:
st.session_state.user_info['preferences'].append(preference)
st.session_state.history.append({
'action': 'add_preference',
'preference': preference
})
st.success(f"偏好 '{preference}' 已添加")
st.rerun()
# 清空状态
if st.button("清空历史", type="secondary"):
st.session_state.history = []
st.success("历史已清空")
st.rerun()
# Tab 2: 状态同步
with tab2:
st.header("2. 状态同步机制")
st.markdown("""
**状态同步的挑战:**
- 多个组件访问同一状态
- 状态的更新顺序
- 避免竞态条件
""")
# 演示状态同步问题
if 'shared_counter' not in st.session_state:
st.session_state.shared_counter = 0
if 'last_updated_by' not in st.session_state:
st.session_state.last_updated_by = None
st.subheader("共享计数器示例")
counter_col1, counter_col2, counter_col3 = st.columns(3)
with counter_col1:
st.metric("当前值", st.session_state.shared_counter)
st.write(f"最后更新: {st.session_state.last_updated_by or '无'}")
with counter_col2:
if st.button("按钮A: +1", key="btn_a"):
st.session_state.shared_counter += 1
st.session_state.last_updated_by = "按钮A"
st.rerun()
if st.button("按钮A: +5", key="btn_a5"):
st.session_state.shared_counter += 5
st.session_state.last_updated_by = "按钮A"
st.rerun()
with counter_col3:
if st.button("按钮B: +1", key="btn_b"):
st.session_state.shared_counter += 1
st.session_state.last_updated_by = "按钮B"
st.rerun()
if st.button("按钮B: -1", key="btn_b_minus"):
st.session_state.shared_counter -= 1
st.session_state.last_updated_by = "按钮B"
st.rerun()
# 状态更新历史
st.subheader("状态更新历史")
if 'update_history' not in st.session_state:
st.session_state.update_history = []
# 显示历史
for i, update in enumerate(st.session_state.update_history[-10:]): # 显示最后10条
st.write(f"{i+1}. {update}")
# 添加历史记录
if st.button("记录当前状态"):
st.session_state.update_history.append({
'counter': st.session_state.shared_counter,
'updated_by': st.session_state.last_updated_by,
'timestamp': datetime.now().strftime('%Y-%m-%d %H:%M:%S')
})
st.rerun()
# Tab 3: 高级模式
with tab3:
st.header("3. 高级状态模式")
# 使用回调函数
st.subheader("回调函数模式")
def increment_counter(key):
"""计数器增加回调"""
st.session_state[key] = st.session_state.get(key, 0) + 1
def decrement_counter(key):
"""计数器减少回调"""
st.session_state[key] = st.session_state.get(key, 0) - 1
def reset_counter(key):
"""计数器重置回调"""
st.session_state[key] = 0
# 使用回调的计数器
counter_key = "advanced_counter"
if counter_key not in st.session_state:
st.session_state[counter_key] = 0
col1, col2, col3 = st.columns(3)
with col1:
st.number_input(
"高级计数器",
value=st.session_state[counter_key],
key=counter_key
)
with col2:
st.button(
"增加",
on_click=increment_counter,
args=(counter_key,)
)
st.button(
"减少",
on_click=decrement_counter,
args=(counter_key,)
)
with col3:
st.button(
"重置",
on_click=reset_counter,
args=(counter_key,),
type="secondary"
)
# 状态验证
st.subheader("状态验证")
def validate_age(age):
"""年龄验证"""
if age < 0 or age > 150:
return False, "年龄必须在0-150之间"
return True, ""
if 'validated_age' not in st.session_state:
st.session_state.validated_age = 25
st.session_state.age_error = ""
age = st.number_input(
"年龄(带验证)",
min_value=0,
max_value=150,
value=st.session_state.validated_age,
key="age_input"
)
if st.button("验证年龄"):
is_valid, error_msg = validate_age(age)
if is_valid:
st.session_state.validated_age = age
st.session_state.age_error = ""
st.success("年龄验证通过")
else:
st.session_state.age_error = error_msg
st.error(error_msg)
if st.session_state.age_error:
st.error(f"验证错误: {st.session_state.age_error}")
# Tab 4: 状态持久化
with tab4:
st.header("4. 状态持久化")
st.markdown("""
**状态持久化的应用场景:**
- 用户偏好设置
- 表单数据保存
- 复杂计算中间结果
- 跨会话数据共享
""")
# 初始化持久化状态
if 'persistent_data' not in st.session_state:
st.session_state.persistent_data = {
'user_settings': {},
'form_data': {},
'cached_results': {}
}
if 'auto_save' not in st.session_state:
st.session_state.auto_save = False
# 持久化方法选择
st.subheader("持久化方法")
persistence_method = st.radio(
"选择持久化方法",
["会话内持久化", "浏览器存储", "文件存储", "数据库存储"],
horizontal=True
)
# 1. 会话内持久化演示
if persistence_method == "会话内持久化":
st.info("""
会话内持久化仅在当前浏览器标签页有效。
刷新页面或关闭标签页后数据将丢失。
""")
if 'session_data' not in st.session_state:
st.session_state.session_data = {
'visit_count': 0,
'last_visit': None,
'pages_visited': []
}
# 更新会话数据
st.session_state.session_data['visit_count'] += 1
st.session_state.session_data['last_visit'] = datetime.now().strftime('%Y-%m-%d %H:%M:%S')
# 添加当前页面
current_page = st.text_input("当前页面", "状态持久化演示")
if current_page and current_page not in st.session_state.session_data['pages_visited']:
st.session_state.session_data['pages_visited'].append(current_page)
# 显示会话数据
st.json(st.session_state.session_data)
# 会话操作
col1, col2 = st.columns(2)
with col1:
if st.button("清空访问记录"):
st.session_state.session_data['pages_visited'] = []
st.success("访问记录已清空")
st.rerun()
with col2:
if st.button("重置会话数据"):
st.session_state.session_data = {
'visit_count': 0,
'last_visit': None,
'pages_visited': []
}
st.success("会话数据已重置")
st.rerun()
# 2. 浏览器存储模拟
elif persistence_method == "浏览器存储":
st.warning("注意:Streamlit本身不提供浏览器存储API,这里通过模拟展示概念")
# 模拟localStorage
if 'browser_storage' not in st.session_state:
st.session_state.browser_storage = {}
st.subheader("浏览器存储模拟")
col1, col2 = st.columns(2)
with col1:
# 存储操作
storage_key = st.text_input("存储键", "user_preference")
storage_value = st.text_input("存储值", "dark_mode")
if st.button("存储到浏览器"):
st.session_state.browser_storage[storage_key] = storage_value
st.success(f"已存储: {storage_key} = {storage_value}")
st.rerun()
with col2:
# 读取操作
read_key = st.selectbox(
"读取键",
list(st.session_state.browser_storage.keys()) + [""]
)
if read_key and st.button("从浏览器读取"):
value = st.session_state.browser_storage.get(read_key, "键不存在")
st.info(f"{read_key} = {value}")
if st.button("清空浏览器存储"):
st.session_state.browser_storage = {}
st.warning("浏览器存储已清空")
st.rerun()
# 显示浏览器存储内容
st.subheader("浏览器存储内容")
st.json(st.session_state.browser_storage)
# 导出/导入
export_col1, export_col2 = st.columns(2)
with export_col1:
if st.button("导出为JSON"):
json_data = json.dumps(st.session_state.browser_storage, ensure_ascii=False, indent=2)
st.download_button(
label="📥 下载JSON",
data=json_data,
file_name="browser_storage.json",
mime="application/json"
)
with export_col2:
uploaded_json = st.file_uploader("导入JSON文件", type=['json'])
if uploaded_json and st.button("导入JSON"):
try:
imported_data = json.load(uploaded_json)
st.session_state.browser_storage.update(imported_data)
st.success("JSON数据导入成功")
st.rerun()
except Exception as e:
st.error(f"导入失败: {str(e)}")
# 3. 文件存储
elif persistence_method == "文件存储":
st.subheader("文件存储持久化")
# 文件存储配置
file_format = st.selectbox("文件格式", ["JSON", "Pickle", "CSV"])
# 要存储的数据
st.subheader("要存储的数据")
data_col1, data_col2 = st.columns(2)
with data_col1:
data_key = st.text_input("数据键", "user_data")
data_type = st.selectbox("数据类型", ["字典", "列表", "字符串", "数值"])
with data_col2:
if data_type == "字典":
dict_key = st.text_input("键", "username")
dict_value = st.text_input("值", "user123")
data_value = {dict_key: dict_value}
elif data_type == "列表":
list_items = st.text_area("列表项(每行一项)", "item1\nitem2\nitem3")
data_value = [item.strip() for item in list_items.split('\n') if item.strip()]
elif data_type == "字符串":
data_value = st.text_input("字符串值", "Hello, World!")
else: # 数值
data_value = st.number_input("数值", value=42)
# 文件操作
st.subheader("文件操作")
op_col1, op_col2, op_col3 = st.columns(3)
with op_col1:
if st.button("💾 保存到文件"):
try:
if file_format == "JSON":
file_content = json.dumps({data_key: data_value}, ensure_ascii=False, indent=2)
file_name = f"data_{data_key}.json"
mime_type = "application/json"
elif file_format == "Pickle":
file_content = pickle.dumps({data_key: data_value})
file_name = f"data_{data_key}.pkl"
mime_type = "application/octet-stream"
else: # CSV
if isinstance(data_value, dict):
import pandas as pd
df = pd.DataFrame([data_value])
file_content = df.to_csv(index=False)
else:
file_content = str(data_value)
file_name = f"data_{data_key}.csv"
mime_type = "text/csv"
st.download_button(
label=f"📥 下载{file_format}文件",
data=file_content,
file_name=file_name,
mime=mime_type
)
st.session_state[f"last_saved_{data_key}"] = {
'key': data_key,
'value': data_value,
'format': file_format,
'timestamp': datetime.now().strftime('%Y-%m-%d %H:%M:%S')
}
st.success("数据已准备下载")
except Exception as e:
st.error(f"保存失败: {str(e)}")
with op_col2:
uploaded_file = st.file_uploader(
f"上传{file_format}文件",
type=[file_format.lower()],
key=f"upload_{file_format}"
)
if uploaded_file and st.button("📤 从文件加载"):
try:
if file_format == "JSON":
loaded_data = json.load(uploaded_file)
elif file_format == "Pickle":
loaded_data = pickle.load(uploaded_file)
else: # CSV
import pandas as pd
loaded_data = pd.read_csv(uploaded_file).to_dict('records')
st.session_state[f"loaded_{data_key}"] = {
'data': loaded_data,
'filename': uploaded_file.name,
'timestamp': datetime.now().strftime('%Y-%m-%d %H:%M:%S')
}
st.success(f"从 {uploaded_file.name} 加载成功")
st.rerun()
except Exception as e:
st.error(f"加载失败: {str(e)}")
with op_col3:
# 显示最近的操作
if f"last_saved_{data_key}" in st.session_state:
st.info("最近保存:")
st.json(st.session_state[f"last_saved_{data_key}"])
if f"loaded_{data_key}" in st.session_state:
st.info("最近加载:")
st.json(st.session_state[f"loaded_{data_key}"])
# 4. 数据库存储模拟
else: # 数据库存储
st.subheader("数据库存储模拟")
st.info("""
在实际应用中,您可以使用SQLite、PostgreSQL、MySQL等数据库。
这里我们模拟数据库操作来展示概念。
""")
# 模拟数据库表
if 'db_users' not in st.session_state:
st.session_state.db_users = []
if 'db_products' not in st.session_state:
st.session_state.db_products = [
{'id': 1, 'name': '产品A', 'price': 100, 'stock': 50},
{'id': 2, 'name': '产品B', 'price': 200, 'stock': 30},
{'id': 3, 'name': '产品C', 'price': 150, 'stock': 20}
]
# 数据库操作
db_tab1, db_tab2, db_tab3 = st.tabs(["用户管理", "产品管理", "数据库操作"])
with db_tab1:
st.subheader("用户管理")
# 添加用户
with st.form("add_user_form"):
st.write("添加新用户")
user_name = st.text_input("用户名")
user_email = st.text_input("邮箱")
user_role = st.selectbox("角色", ["用户", "管理员", "访客"])
if st.form_submit_button("添加用户"):
if user_name and user_email:
new_user = {
'id': len(st.session_state.db_users) + 1,
'name': user_name,
'email': user_email,
'role': user_role,
'created_at': datetime.now().strftime('%Y-%m-%d %H:%M:%S')
}
st.session_state.db_users.append(new_user)
st.success(f"用户 {user_name} 添加成功")
st.rerun()
else:
st.error("请填写所有必填字段")
# 显示用户列表
st.subheader("用户列表")
if st.session_state.db_users:
users_df = pd.DataFrame(st.session_state.db_users)
st.dataframe(users_df, use_container_width=True)
else:
st.info("暂无用户数据")
with db_tab2:
st.subheader("产品管理")
# 显示产品列表
products_df = pd.DataFrame(st.session_state.db_products)
st.dataframe(products_df, use_container_width=True)
# 产品操作
col1, col2 = st.columns(2)
with col1:
# 添加产品
with st.form("add_product_form"):
st.write("添加新产品")
prod_name = st.text_input("产品名称")
prod_price = st.number_input("价格", min_value=0.0, value=100.0)
prod_stock = st.number_input("库存", min_value=0, value=10)
if st.form_submit_button("添加产品"):
if prod_name:
new_product = {
'id': len(st.session_state.db_products) + 1,
'name': prod_name,
'price': prod_price,
'stock': prod_stock
}
st.session_state.db_products.append(new_product)
st.success(f"产品 {prod_name} 添加成功")
st.rerun()
else:
st.error("请输入产品名称")
with col2:
# 更新库存
product_id = st.number_input("产品ID", min_value=1, value=1)
new_stock = st.number_input("新库存", min_value=0, value=0)
if st.button("更新库存"):
for product in st.session_state.db_products:
if product['id'] == product_id:
product['stock'] = new_stock
st.success(f"产品ID {product_id} 库存更新为 {new_stock}")
st.rerun()
break
else:
st.error(f"未找到产品ID {product_id}")
with db_tab3:
st.subheader("数据库操作")
# 数据库统计
col1, col2, col3 = st.columns(3)
with col1:
st.metric("用户数量", len(st.session_state.db_users))
with col2:
st.metric("产品数量", len(st.session_state.db_products))
with col3:
total_value = sum(p['price'] * p['stock'] for p in st.session_state.db_products)
st.metric("库存总价值", f"¥{total_value:,.2f}")
# 数据导出
st.subheader("数据导出")
export_format = st.selectbox("导出格式", ["JSON", "CSV", "SQL"])
if st.button("导出数据库"):
export_data = {
'users': st.session_state.db_users,
'products': st.session_state.db_products,
'export_time': datetime.now().strftime('%Y-%m-%d %H:%M:%S'),
'data_hash': hashlib.md5(
json.dumps(st.session_state.db_users + st.session_state.db_products, sort_keys=True).encode()
).hexdigest()[:8]
}
if export_format == "JSON":
file_content = json.dumps(export_data, ensure_ascii=False, indent=2)
file_name = f"database_export_{datetime.now().strftime('%Y%m%d_%H%M%S')}.json"
mime_type = "application/json"
elif export_format == "CSV":
import pandas as pd
# 导出为多个CSV文件
users_df = pd.DataFrame(export_data['users'])
products_df = pd.DataFrame(export_data['products'])
# 创建ZIP文件
import zipfile
import io
zip_buffer = io.BytesIO()
with zipfile.ZipFile(zip_buffer, 'w') as zip_file:
# 添加用户CSV
users_csv = users_df.to_csv(index=False)
zip_file.writestr('users.csv', users_csv)
# 添加产品CSV
products_csv = products_df.to_csv(index=False)
zip_file.writestr('products.csv', products_csv)
# 添加元数据
meta_data = {
'export_time': export_data['export_time'],
'data_hash': export_data['data_hash']
}
meta_json = json.dumps(meta_data, indent=2)
zip_file.writestr('metadata.json', meta_json)
file_content = zip_buffer.getvalue()
file_name = f"database_export_{datetime.now().strftime('%Y%m%d_%H%M%S')}.zip"
mime_type = "application/zip"
else: # SQL
# 生成SQL语句
sql_statements = []
sql_statements.append("-- 数据库导出SQL")
sql_statements.append(f"-- 导出时间: {export_data['export_time']}")
sql_statements.append(f"-- 数据哈希: {export_data['data_hash']}")
sql_statements.append("")
# 用户表
sql_statements.append("-- 用户表数据")
for user in export_data['users']:
sql_statements.append(
f"INSERT INTO users (id, name, email, role, created_at) "
f"VALUES ({user['id']}, '{user['name']}', '{user['email']}', "
f"'{user['role']}', '{user['created_at']}');"
)
sql_statements.append("")
# 产品表
sql_statements.append("-- 产品表数据")
for product in export_data['products']:
sql_statements.append(
f"INSERT INTO products (id, name, price, stock) "
f"VALUES ({product['id']}, '{product['name']}', "
f"{product['price']}, {product['stock']});"
)
file_content = "\n".join(sql_statements)
file_name = f"database_export_{datetime.now().strftime('%Y%m%d_%H%M%S')}.sql"
mime_type = "application/sql"
st.download_button(
label=f"📥 下载{export_format}文件",
data=file_content,
file_name=file_name,
mime=mime_type
)
# 数据库重置
st.subheader("危险操作")
if st.button("🔄 重置数据库", type="secondary"):
st.session_state.db_users = []
st.session_state.db_products = [
{'id': 1, 'name': '产品A', 'price': 100, 'stock': 50},
{'id': 2, 'name': '产品B', 'price': 200, 'stock': 30},
{'id': 3, 'name': '产品C', 'price': 150, 'stock': 20}
]
st.warning("数据库已重置为初始状态")
st.rerun()
# 导入pandas用于数据库标签页
import pandas as pd
# 页脚
st.divider()
st.caption(f"""
会话状态演示应用 | 最后更新: {datetime.now().strftime('%Y-%m-%d %H:%M:%S')} |
会话ID哈希: {hashlib.md5(str(id(st.session_state)).encode()).hexdigest()[:8]}
""")5. 总结与最佳实践
5.1 Streamlit的核心优势总结
让我们通过一个对比表格来总结Streamlit的优势:
5.2 Streamlit最佳实践
基于我们的示例Demo,以下是Streamlit开发的最佳实践:
- 代码组织最佳实践
python
# ✅ 推荐结构
import streamlit as st
import other_libraries

# 1. 页面配置
st.set_page_config(...)

# 2. 初始化状态
if 'key' not in st.session_state:
    st.session_state.key = value

# 3. 侧边栏配置
with st.sidebar:
    # 控制组件

# 4. 主内容区
st.title(...)

# 5. 使用缓存优化性能
@st.cache_data
def load_data():
    return data

# 6. 错误处理
try:
    # 业务逻辑
except Exception as e:
st.error(f"错误: {str(e)}")-
性能优化建议
-
使用
@st.cache_data缓存数据加载 -
使用
@st.cache_resource缓存资源 -
避免在回调中执行重计算
-
使用会话状态避免重复初始化
-
-
用户体验优化
-
使用进度条
st.progress()显示长时间操作 -
使用
st.spinner()提供反馈 -
合理的错误提示和信息展示
-
响应式布局设计
-
5.3 实际应用场景
通过前面的Demo,我们已经展示了Streamlit在多个场景的应用:
-
数据探索与可视化 -
demo_data_explorer.py -
机器学习模型部署 - 将在后续博客中详细展示
-
企业内部工具 - 快速构建管理界面
-
报告生成系统 - 自动化数据报告
-
原型验证 - 快速验证产品想法
5.4 学习路径建议

6. 常见问题与解决方案
6.1 性能问题
问题: 应用响应缓慢
解决方案:
-
使用缓存装饰器
-
避免在回调中执行重计算
-
使用会话状态保存中间结果
-
优化数据加载和预处理
6.2 状态管理问题
问题: 状态丢失或混乱
解决方案:
-
使用唯一的键名
-
初始化状态时使用默认值
-
使用回调函数管理状态更新
-
实现状态验证逻辑
6.3 布局问题
问题: 界面在不同设备上显示不一致
解决方案:
-
使用响应式布局(
layout="wide") -
使用列和容器组织内容
-
测试不同屏幕尺寸
-
使用主题保持一致性
7. 资源推荐
7.1 官方资源
-
📚 官方文档
-
🎮 API参考
-
💬 社区论坛
-
📦 组件库
7.2 学习资源
-
📹 官方教程视频
-
📖 示例应用库
-
🏆 最佳实践指南
7.3 社区资源
-
🌟 Awesome Streamlit
-
🚀 Streamlit Components
-
📊 Streamlit for Data Science
8. 下一篇预告
在下一篇博客中,我们将深入探讨:
-
Streamlit高级功能深度解析
-
多页面应用架构
-
自定义主题和样式
-
高级图表集成
-
实时数据处理
-
-
更多完整Demo工程
-
实时数据监控面板
-
机器学习模型部署平台
-
团队协作工具
-
自动化报告系统
-
-
企业级应用开发
-
项目架构设计
-
代码组织规范
-
测试和部署
-
性能优化策略
-
总结
本篇博客通过多个完整的Demo工程,从基础到进阶,全面介绍了Streamlit的核心概念和应用场景。我们重点讲解了:
-
Streamlit的设计哲学 - 快速原型开发的革命性工具
-
核心组件深度解析 - 从基础组件到高级布局
-
状态管理机制 - 会话状态的完整解决方案
-
实际应用开发 - 完整的数据探索器实现
-
最佳实践 - 性能优化和代码组织
每个Demo都是独立的、完整的Python文件,可以直接运行和学习。通过Mermaid图表,我们清晰地展示了代码结构和数据流程。
Streamlit的真正价值在于它让数据科学家和开发者能够专注于业务逻辑,而不是Web开发的复杂性。通过本篇博客的学习,您应该已经能够:
-
✅ 快速搭建Streamlit应用
-
✅ 理解并应用状态管理
-
✅ 创建交互式数据应用
-
✅ 优化应用性能和用户体验