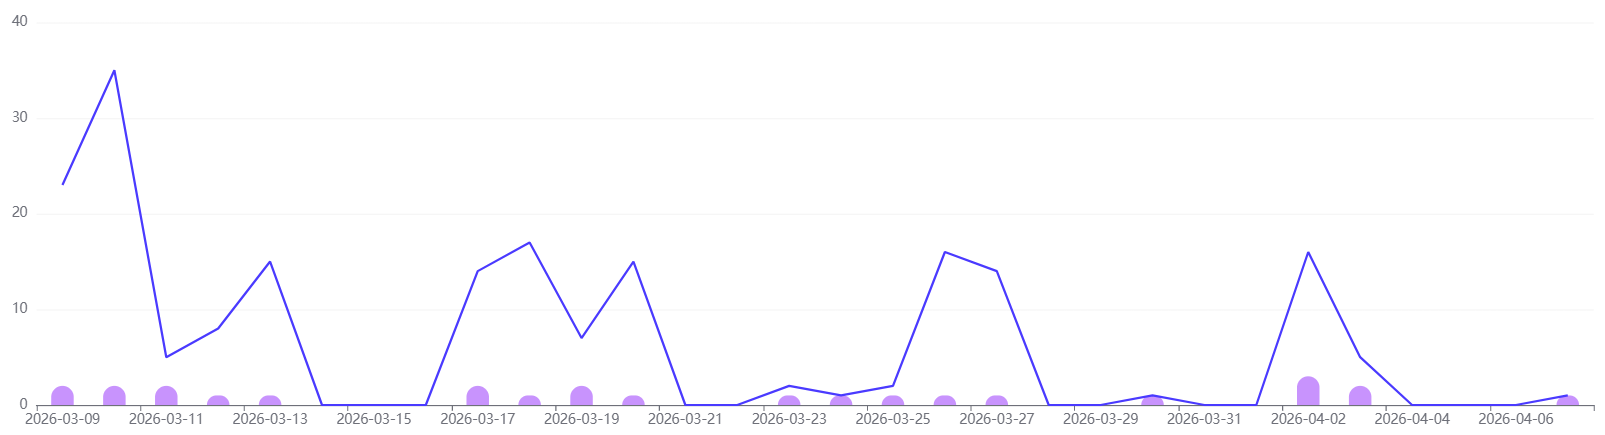
我的项目中有一个图表组件,通过父组件传递数据到图表组件,此时会出现一个问题:当我第二天再点进这个页面时,图表数据并没有更新(没有当天的数据,最新的日期是昨天),需要刷新页面后,才会展示最新的时间以及数据。封装hook后,尽管我没有关闭当面标签页,第二天再打开这个标签页,图表数据依旧能自动更新到最新。
在hooks目录下新建useEchart.ts
TypeScript
//导入Echart
import * as echarts from 'echarts'
import { onBeforeUnmount, onMounted, Ref, watch } from 'vue'
export interface RefObject {
  current?: HTMLElement | null
}

export interface CallbackRef {
  (el: HTMLElement | null): void
}

export type EchartsOption = echarts.EChartsOption

export type container = Ref<HTMLElement | null> | HTMLElement | string | string[]

/**
 * 适配多种容器选择方式的 ECharts 封装
 * @param container - 容器选择器(支持 Ref, DOM 元素, ID 选择器, 类选择器)
 * @param option - 初始配置
 * @returns {chart: echarts.ECharts | null, update: (newOption: EChartsOption) => void}
 */
export function useEchart(
  container: container,
  option: EchartsOption = {},
): {
  chart: echarts.ECharts | null
  onChartEvent: (event: string, handler: (params: any) => void) => void
  offChartEvent: (event: string, handler: (params: any) => void) => void
  update: (newOption: EchartsOption) => void
  handleResize: () => void
} {
  let chart: echarts.ECharts | null = null
  let containerElement: HTMLElement | null = null
  let resizeObserver: ResizeObserver | null = null //ResizeObserver 实例

  //   辅助函数处理单个选择器
  const getContainerElementForSingle = (selector: string): HTMLElement | null => {
    if (selector.startsWith('#')) {
      return document.getElementById(selector.slice(1)) || null
    } else if (selector.startsWith('.')) {
      return (document.querySelector(selector) as HTMLElement) || null
    }
    // 直接ID 无#
    return document.getElementById(selector) || null
  }

  //获取容器元素
  const getContainerElement = (): HTMLElement | null => {
    if (container instanceof HTMLElement) {
      return container
    } else if (typeof container === 'string') {
      return getContainerElementForSingle(container)
    } else if ('value' in container) {
      // Ref 类型
      return container.value
    } else if (Array.isArray(container)) {
      // 多个选择器(返回第一个匹配)
      for (const selector of container) {
        const element = getContainerElementForSingle(selector)
        if (element) {
          return element
        }
      }
    }
    return null
  }

  //   初始化图表
  const initChart = (): void => {
    containerElement = getContainerElement()

    if (!containerElement) {
      console.error('无法获取容器元素')
      return
    }

    if (!chart) {
      chart = echarts.init(containerElement, 'infographic')
      resizeObserver = new ResizeObserver(() => {
        chart?.resize()
      })
      resizeObserver.observe(containerElement)
    }

    if (option) {
      chart.setOption(option)
    }
  }

  //   处理窗口大小变化
  const handleResize = () => {
    chart?.resize()
  }

  //   更新图表配置
  const update = (newOption: EchartsOption): void => {
    if (chart) {
      chart.setOption(newOption)
    }
  }
  // 新增:事件绑定方法
  const onChartEvent = (event: string, handler: (params: any) => void) => {
    chart?.on(event, handler)
  }

  const offChartEvent = (event: string, handler: (params: any) => void) => {
    chart?.off(event, handler)
  }
  //   响应式更新图表配置
  watch(
    () => option,
    newOption => update(newOption),
    {
      deep: true,
    },
  )

  onMounted(() => {
    initChart()
  })

  onBeforeUnmount(() => {
    if (chart) {
      // 清理 ResizeObserver 实例
      if (resizeObserver) {
        resizeObserver.disconnect()
        resizeObserver = null
      }
      chart.dispose()
      chart = null
    }
  })
  return {
    get chart() {
      return chart
    },
    onChartEvent,
    offChartEvent,
    update,
    handleResize,
  }
}
在页面中调用hook:
javascript
<template>
  <div w-full>
    <div ref="chartRef" class="chart-container" w-full h-400></div>
  </div>
</template>

<script setup lang="ts">
import { ref,  watch } from 'vue'
import { useI18n } from 'vue-i18n'
import { useEchart } from '@eam/ui-components'
const { t } = useI18n()
const props = defineProps({
  visitTrend: {
    type: Object,
    default: () => ({
      dateType: 'day',
      visitData: { dates: [], visitCounts: [], userCounts: [] },
    }),
  },
})


// 图表实例
const chartRef = ref(null)

// 生成图表配置
const getChartOption = data => ({
  tooltip: { trigger: 'axis', padding: 10 },
  xAxis: [
    {
      type: 'category',
      data: data.dates,
    },
  ],
  yAxis: [
    {
      type: 'value',
      min: 0,
      splitLine: { lineStyle: { color: '#f5f5f5' } },
    },
    // { type: 'value', show: false },
  ],
  series: [
    {
      name: t('statistics.visitor.visitors'),
      type: 'bar',
      itemStyle: { color: '#C893FD', borderRadius: [12, 12, 0, 0] },
      barWidth: 20,
      data: data.userCounts,
    },
    {
      name: t('statistics.visitor.visits'),
      type: 'line',
      // yAxisIndex: 1,
      lineStyle: { color: '#4A3AFF', width: 2 },
      symbol: 'none',
      data: data.visitCounts,
    },
  ],
  grid: { top: '5%', bottom: '10%', left: '5%', right: '5%' },
})

// 初始化图表
const { update } = useEchart(chartRef, getChartOption(props.visitTrend.visitData))

// 监听数据变化更新图表
watch(
  () => props.visitTrend.visitData,
  newData => {
    update(getChartOption(newData))
  },
  { deep: true, immediate: false }, // 非必要不立即执行,避免挂载时重复调用
)
</script>