Visualize Org Charts and Decision Trees in WinForms
Attend the MESCIUS CodeClinic live webinar & learn to convert datasets into interactive diagrams.
ComponentOne WinForms Edition is a collection of easy-to-use WinForms components that provides access to all updates released within your 1 year subscription period and online support. ComponentOne Winforms Edition includes FlexGrid, FlexChart, FlexReport, InputPanel, Ribbon, DockingTab, and more.
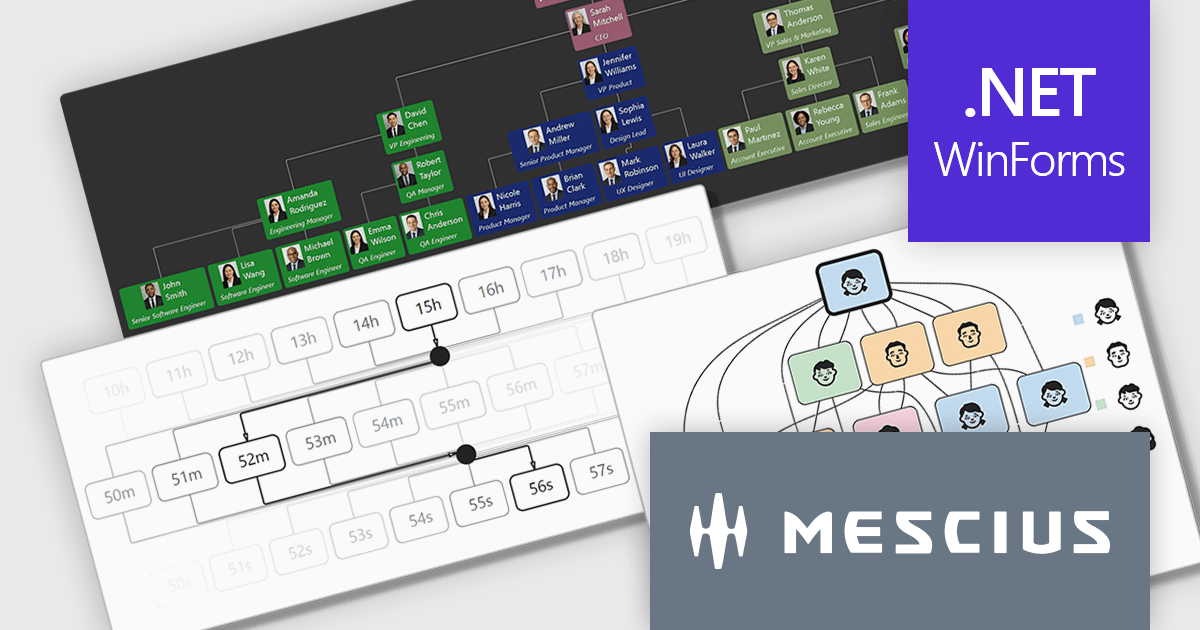
On Wednesday, April 8th at 11:00 AM EDT, MESCIUS is presenting a CodeClinic Live Webinar effecting a deep dive into how .NET developers can convert hierarchical and rule-based datasets into interactive visual diagrams in a Windows Forms application using ComponentOne FlexDiagram. MESCIUS Product Manager Greg Lutz will show you how to bind structured application data to diagram elements, define node relationships, and dynamically generate diagrams using C#. Key takeaways include: