适合:养老院、看护中心、项目交付、客户演示 效果:专业级 CSI 波形图 + 运动强度曲线 + 多房间监控墙
一、整体数据流
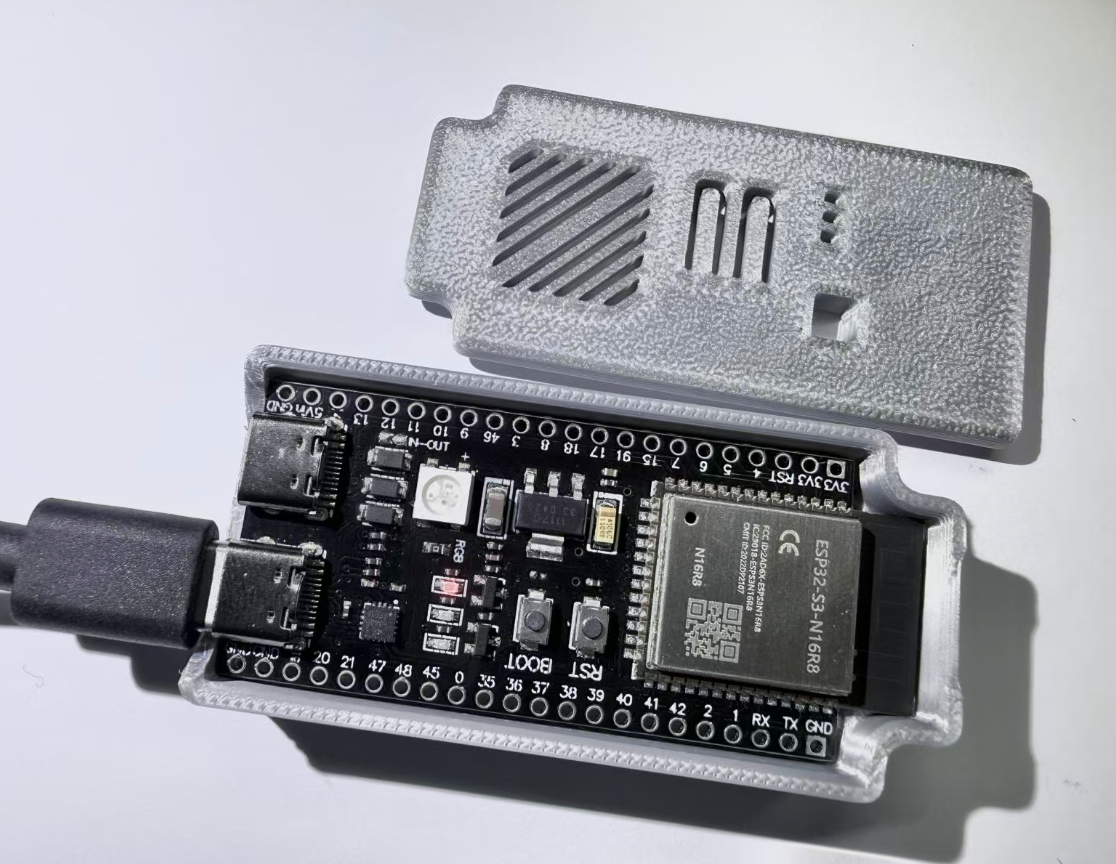
1. 硬件环境
ESP32S3 Dev Module开发板(主要是国内兼容版本的ESP32S3-N16R8开发板)
2. 软件环境
- ESPectre(ESP32)
- Home Assistant
- InfluxDB 数据库(存历史数据)
- Grafana(可视化面板)
建议通过Linux 服务器运维管理面板1Panel进行安装相关服务组件 。

3. 整体数据流
ESP32 ESPectre → ESPHome → Home Assistant → InfluxDB 2.8 → Grafana 专业面板
ESP32 (ESPectre)
   ↓(ESPHome 本地直连)
Home Assistant(已实现)
   ↓(HA 自带集成:自动转发)
InfluxDB(存历史数据)
   ↓
Grafana(专业可视化)
二、 HA 配置 InfluxDB 集成
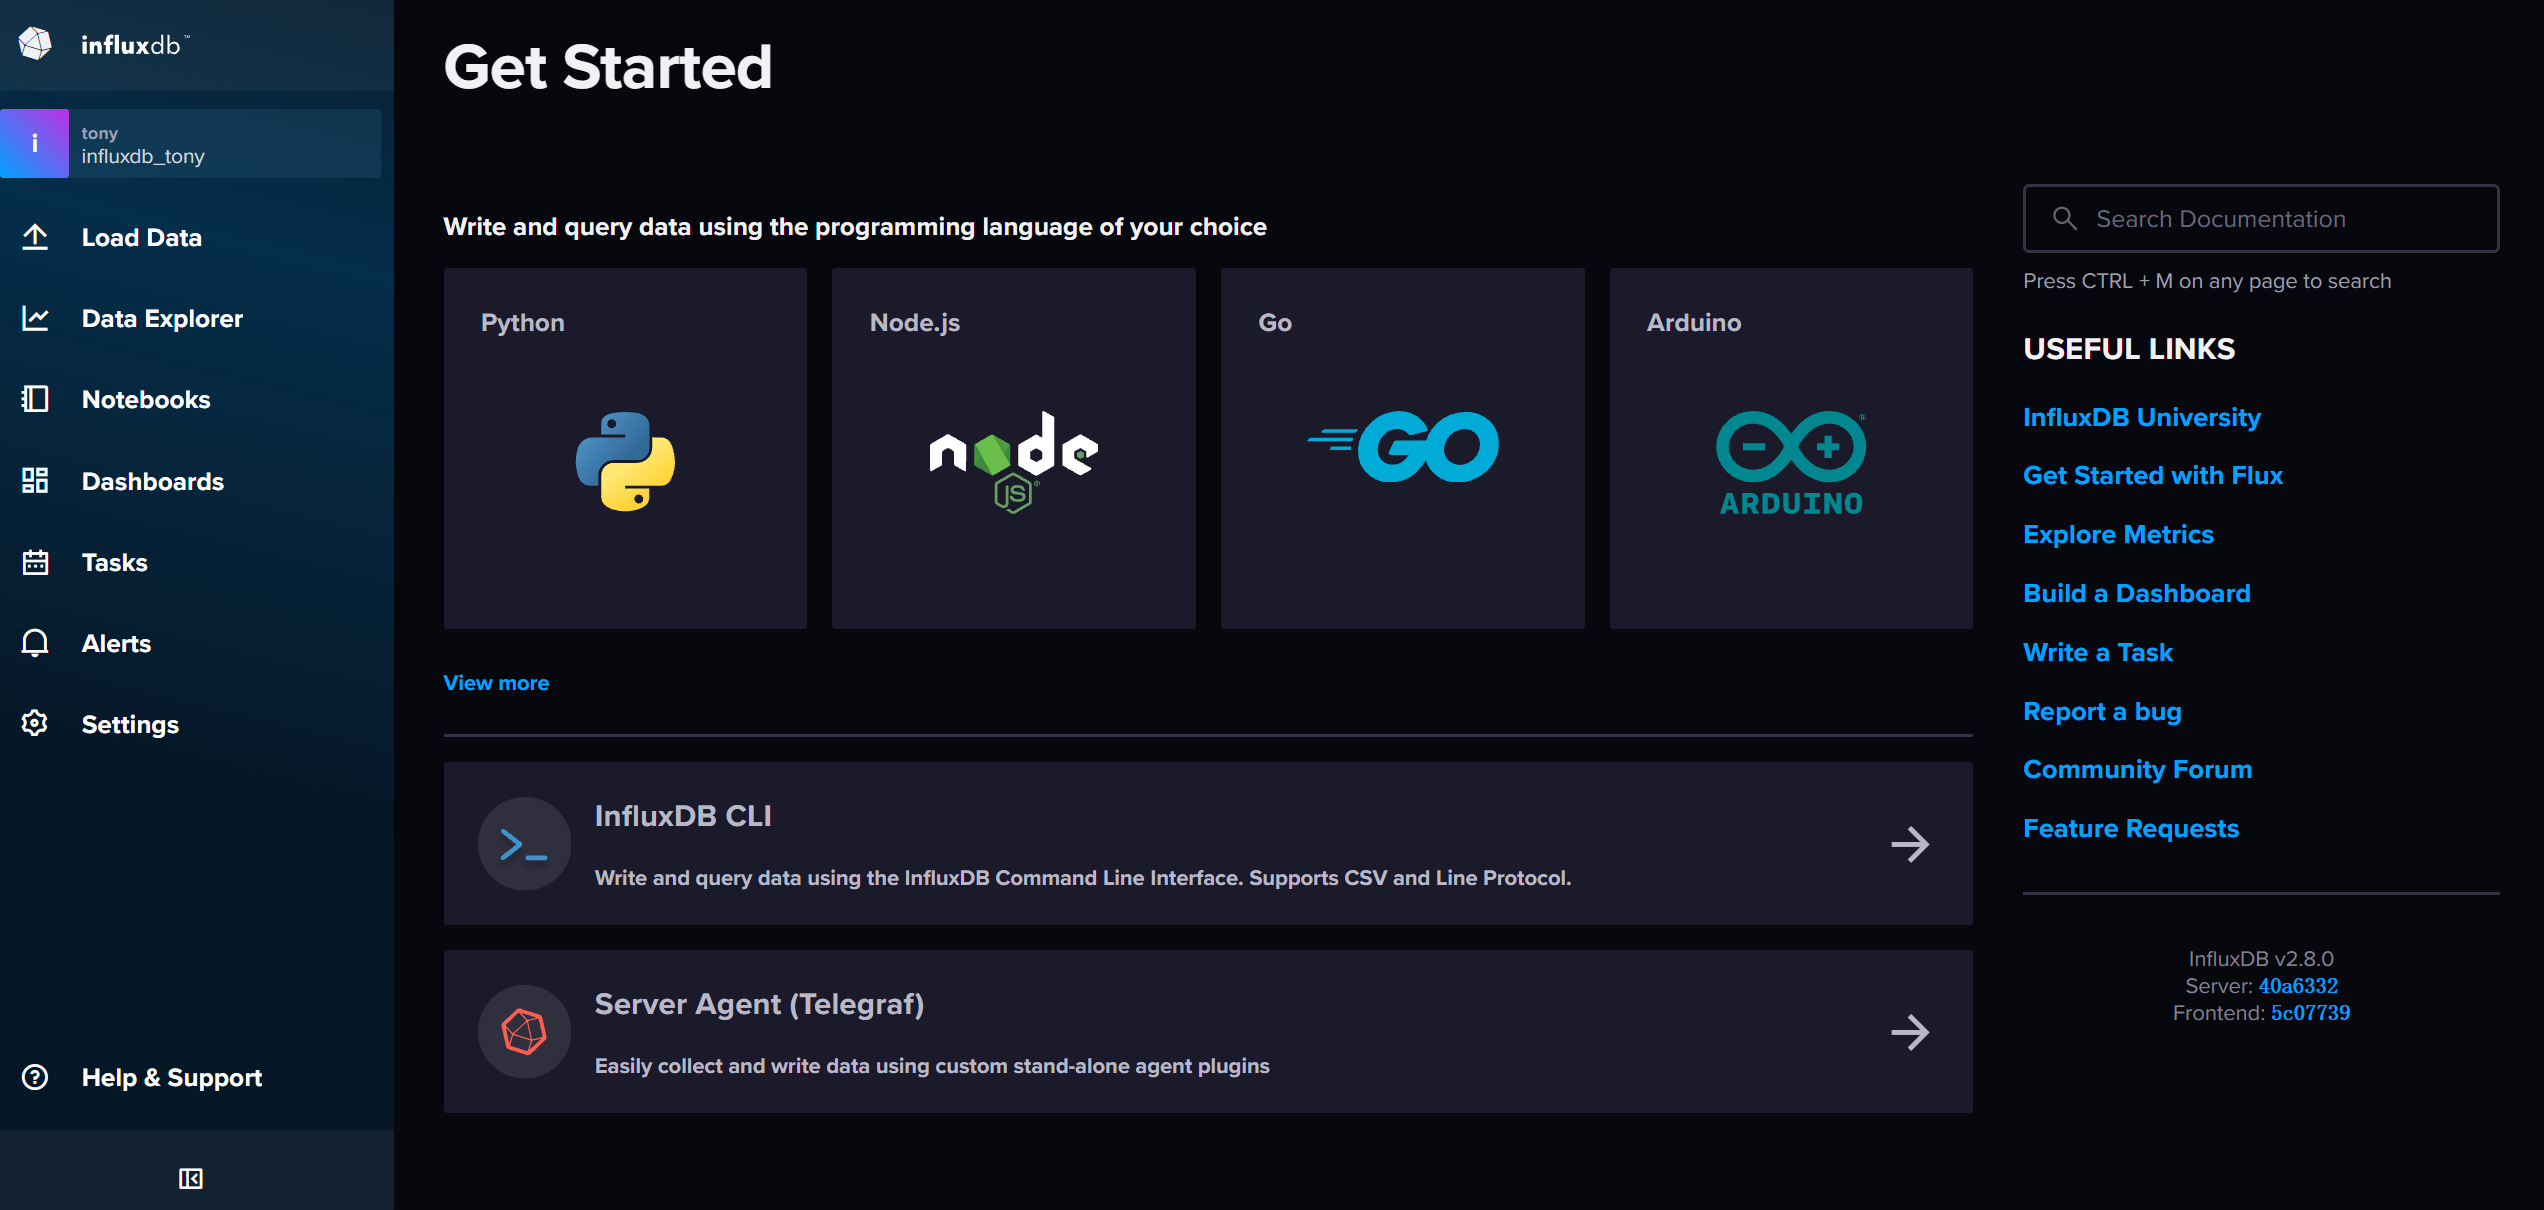
1. 安装 InfluxDB
你可以用 1Panel / 群晖 / Docker 安装
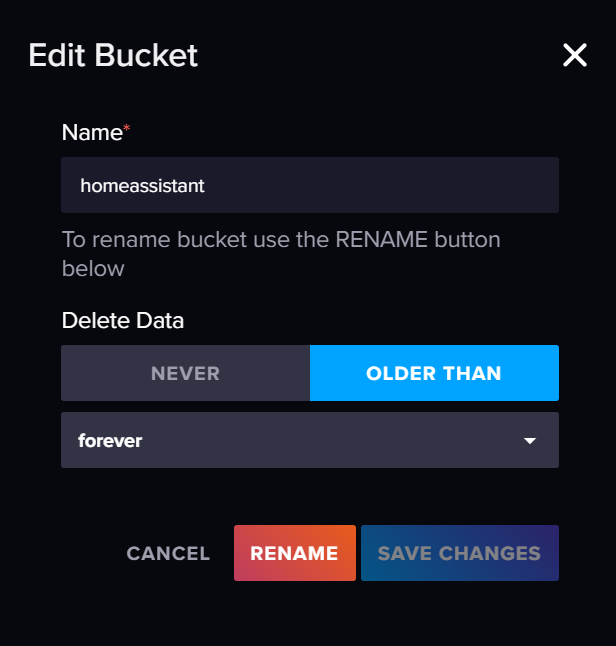
创建:
- 数据库名:
homeassistant
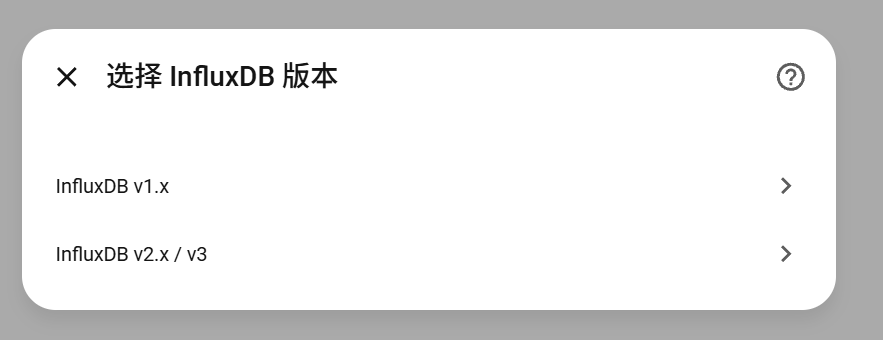
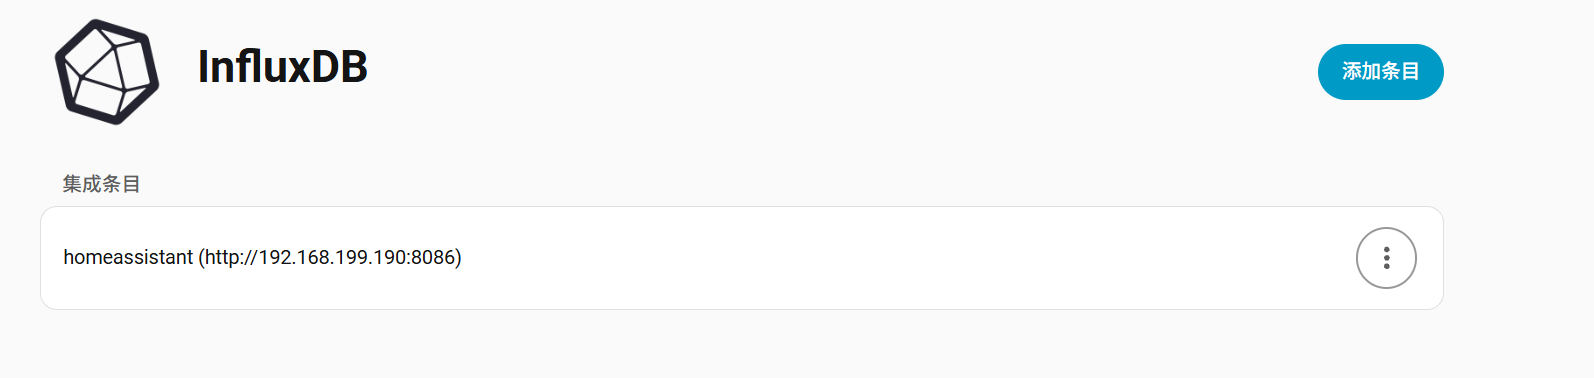
2. HA 里添加 InfluxDB 集成
- 打开 Home Assistant
- 设置 → 设备与服务 → 添加集成
- 搜索 InfluxDB()
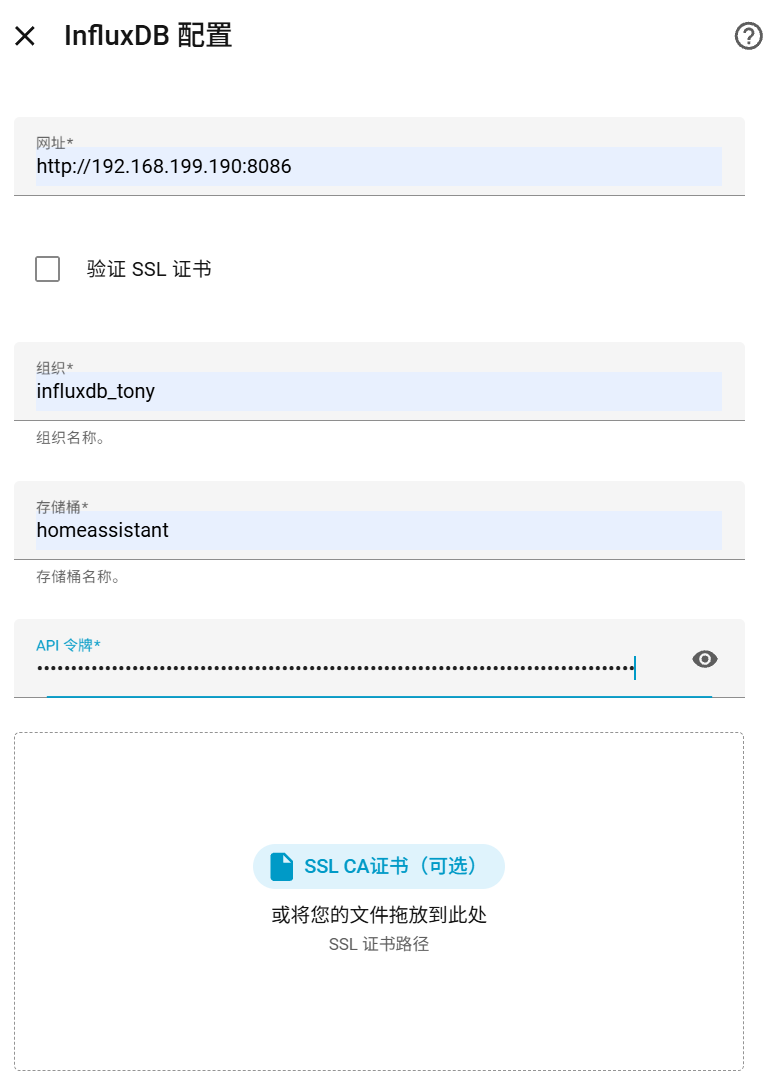
- 输入:
-
- URL:
http://IP:8086(不能漏 http://,不能加 https) - 组织:你的 InfluxDB 组织名
- 数据库:
homeassistant - API令牌:InfluxDB 管理员全局 Token
- URL:
HA 会自动把所有实体数据写入 InfluxDB包括:
sensor.movement_scorebinary_sensor.motion_detected- 所有 ESPHome 设备数据
HA的configration.yaml配置文件添加influxdb的序列化数据条目。
# INFLUXDB 2.x 写入配置(直接复制)
influxdb:
  include:
    entities:
      - sensor.espectre_movement_score
      - binary_sensor.espectre_motion_detected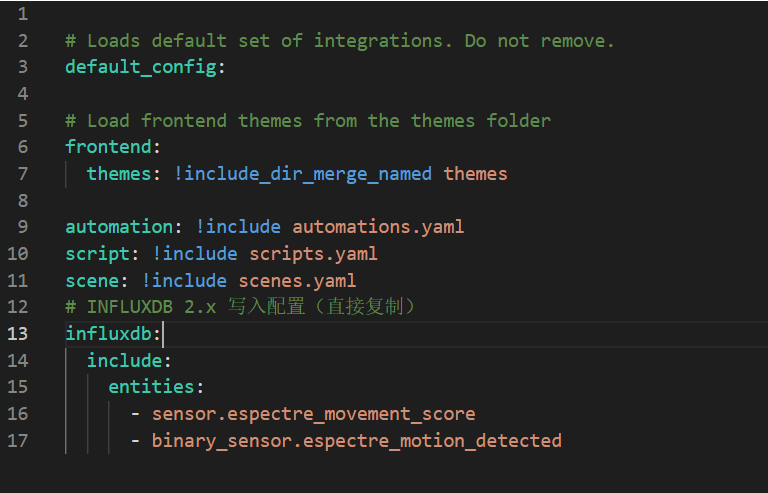
三、InfluxDB测试数据源
1. Home Assistant端验证
HA 里能看到:
- 运动强度 Movement Score
- 运动检测
- 校准开关
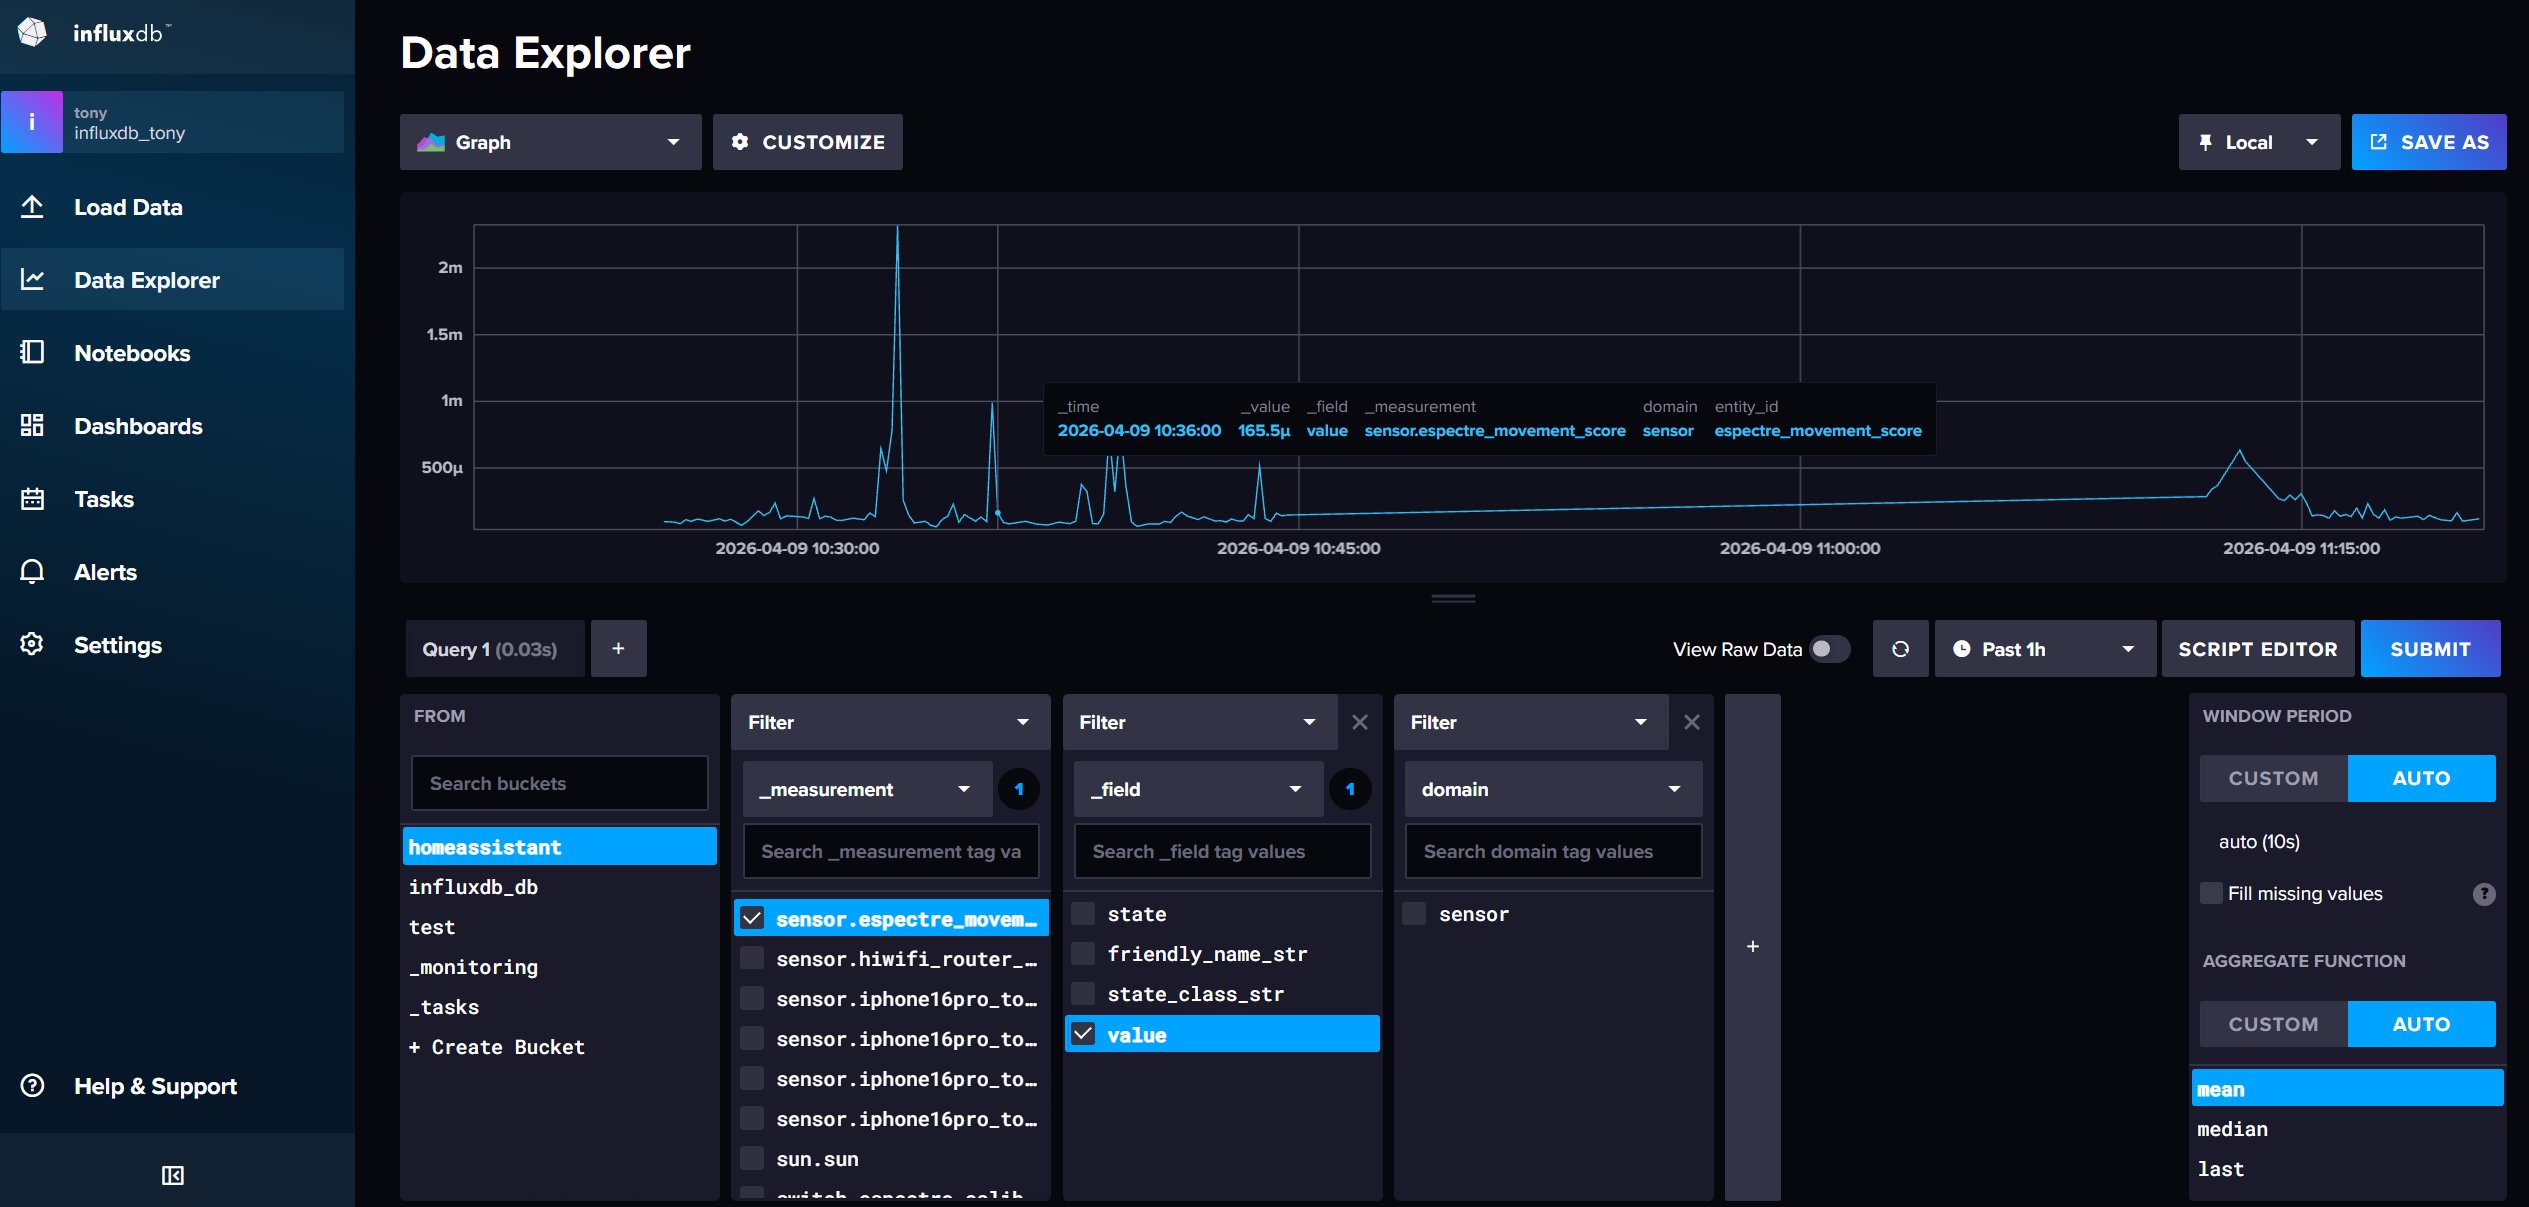
2. InfluxDB 端验证
- 打开 InfluxDB 2.8 → Data Explorer
- 选择 Bucket:homeassistant
- 筛选 measurement:
sensor.movement_score
只要出现数据 → 成功!
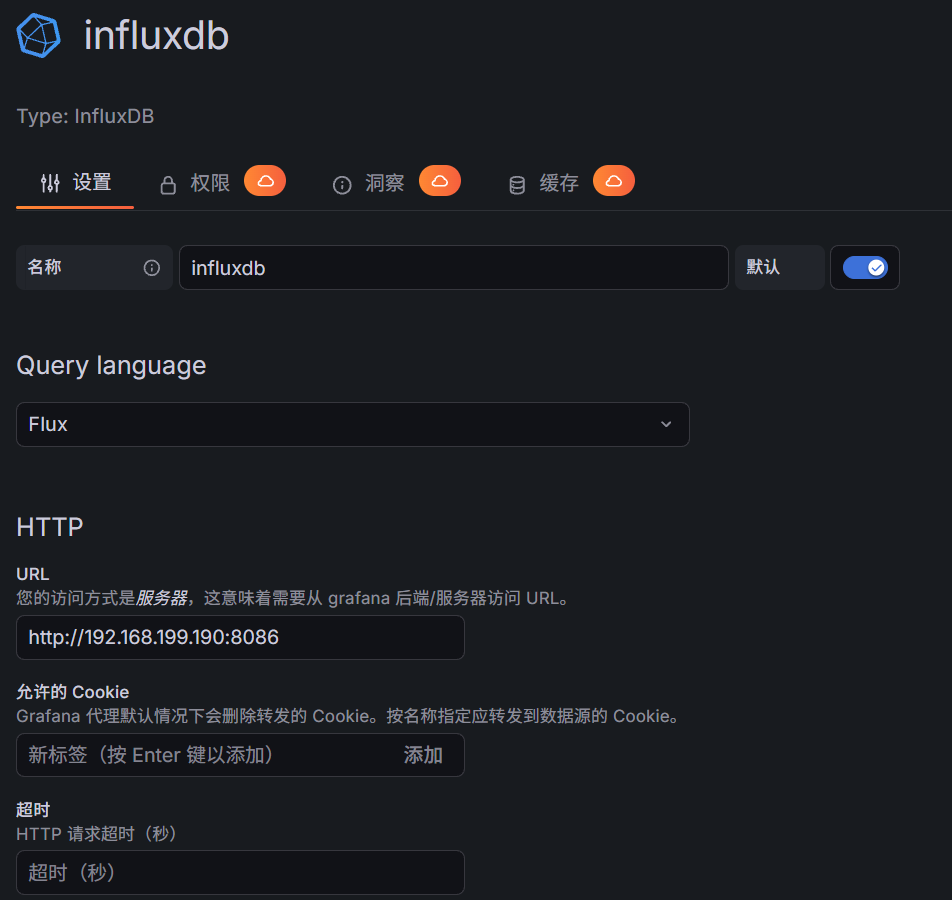
四、Grafana 配置InfluxDB 数据源
1. 数据源配置
- 打开 Grafana → 左侧边栏 ⚙️ Configuration → Data sources
- 点击 Add data source ,选择 InfluxDB
2. 关键参数填写
|-----------------------|-------------------------------|----------------------------------------------------------|
| 配置项 | 填写内容 | 注意事项 |
| Query Language | Flux | 必须选 Flux!InfluxDB 2.x 不支持 InfluxQL |
| URL | http://你的InfluxDB服务器IP:8086 | 必须加 http:// ,不能漏端口 8086 |
| Organization | 你的 InfluxDB 组织名 | 和 InfluxDB 网页里的组织名完全一致(大小写敏感) |
| Token | InfluxDB 管理员全局 Token | 复制 InfluxDB → Load Data → API Tokens 里的 All Access Token |
| Default Bucket | homeassistant | 你提前建好的桶名,大小写一致 |
| Min time interval | 5s | 匹配 ESPectre 数据上报频率,保证曲线流畅 |
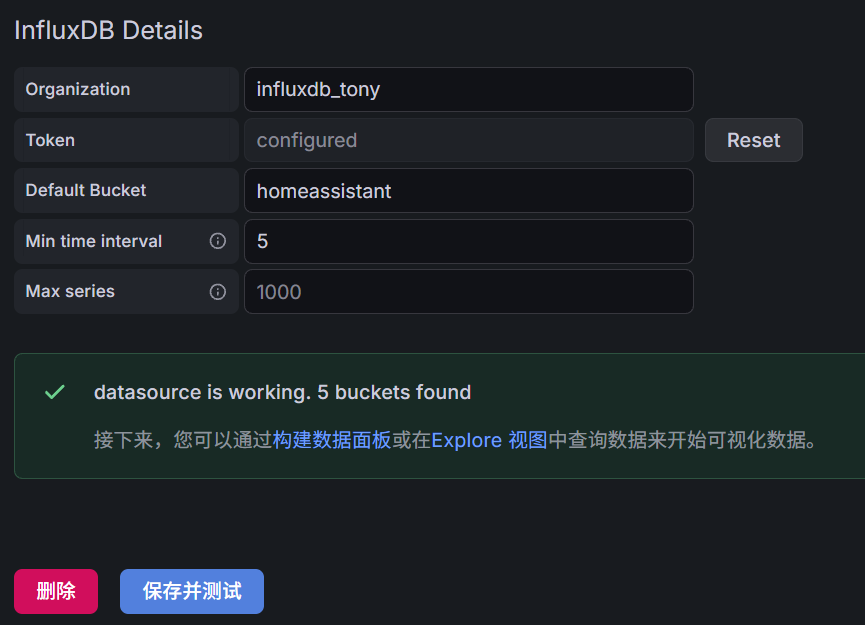
3. 测试连通性
拉到页面最底部,点击 Save & test
- 显示
Data source is working:配置成功 - 报错:检查 Token 权限、Bucket 名、IP 端口、防火墙
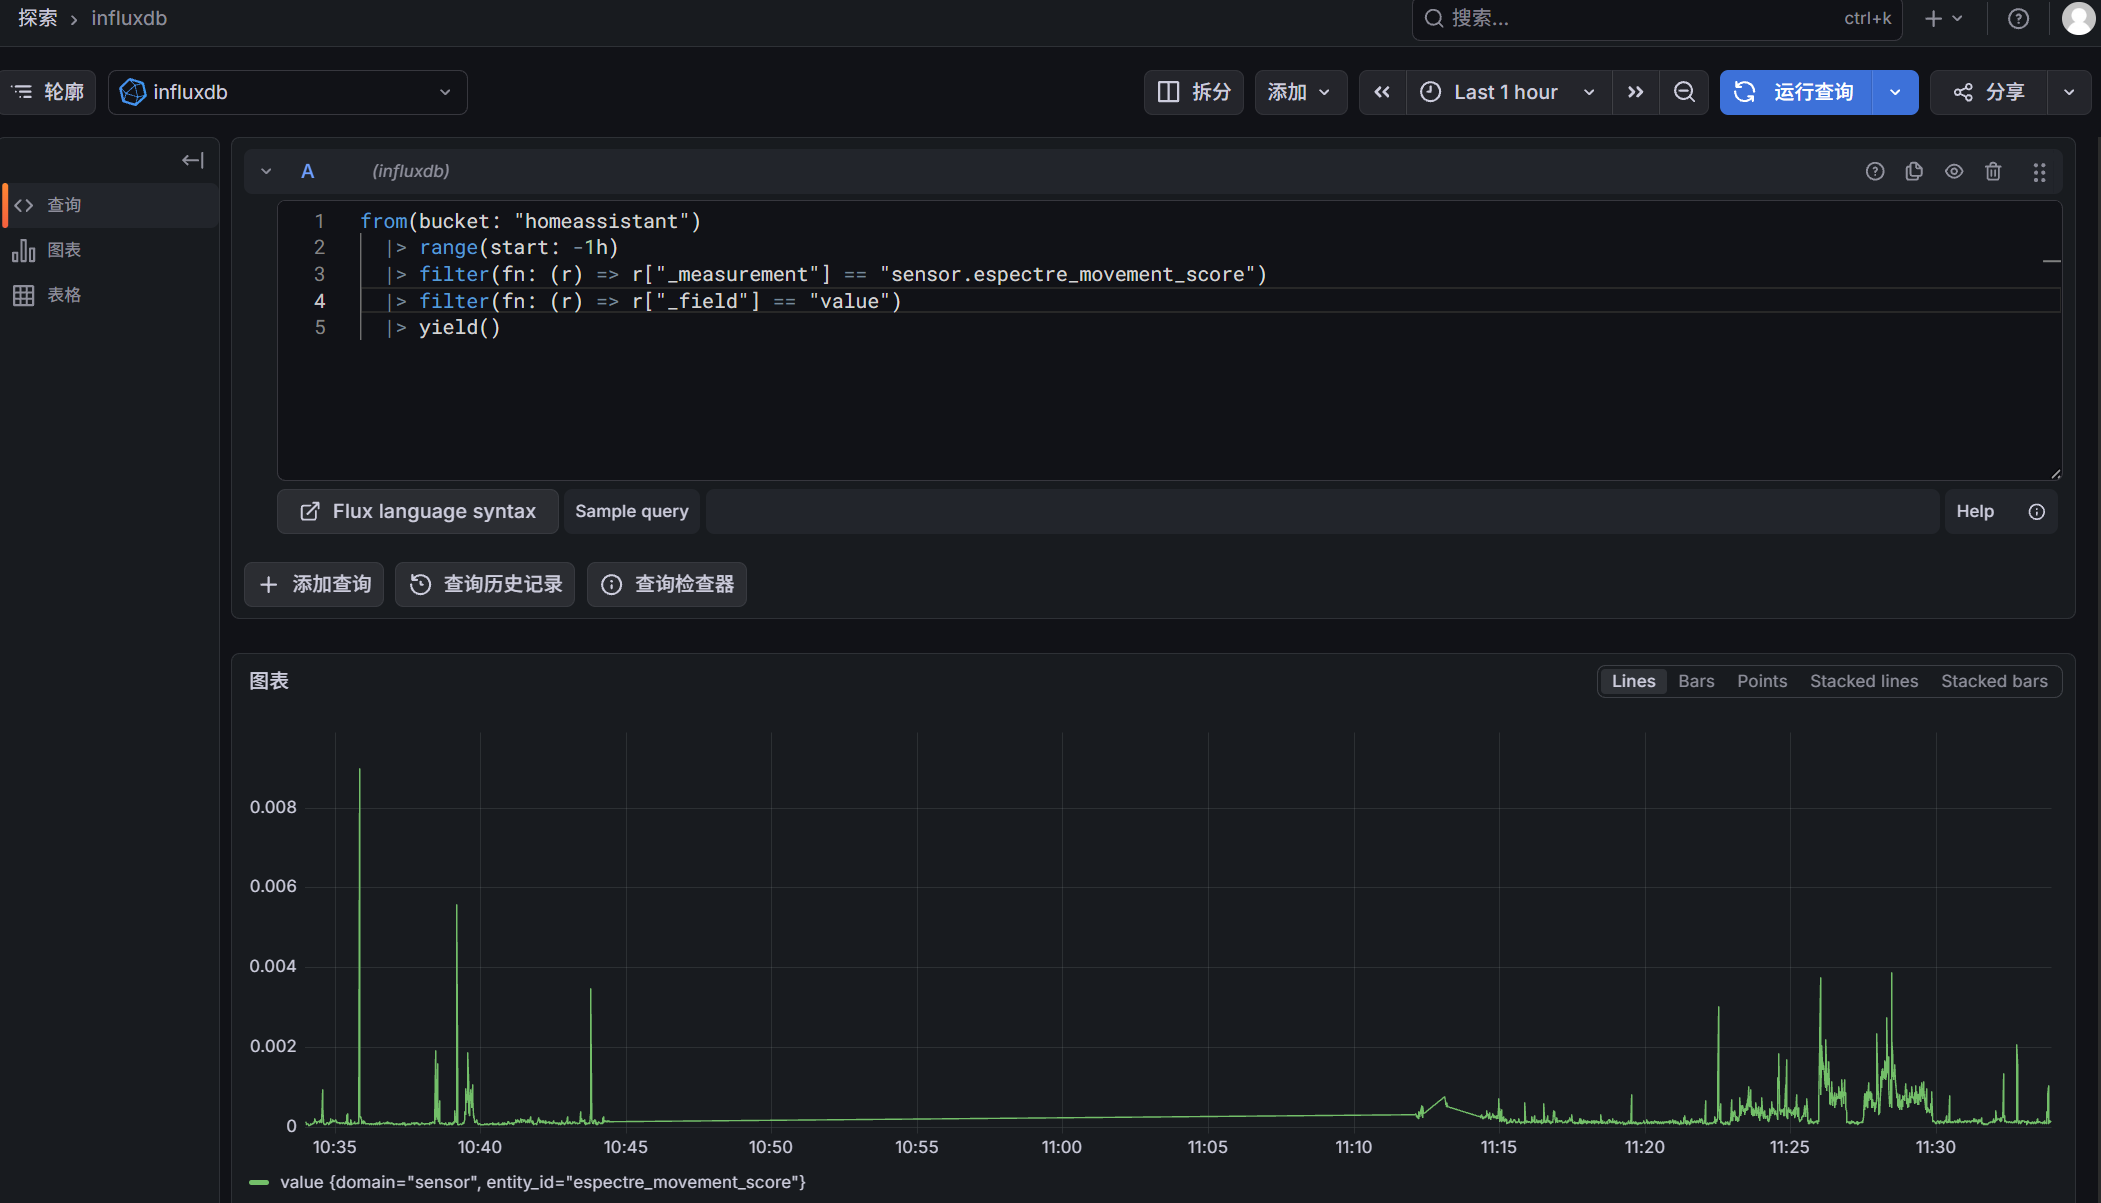
五、Grafana 查询 ESPectre 数据
1. 测试 Flux 语句
from(bucket: "homeassistant")
  |> range(start: -1h)
  |> filter(fn: (r) => r["_measurement"] == "sensor.espectre_movement_score")
  |> filter(fn: (r) => r["_field"] == "value")
  |> yield()
2. 查询内容
- 查 最近 1 小时
- 查你的实体 sensor.espectre_movement_score
- 最简单、最快、不报错
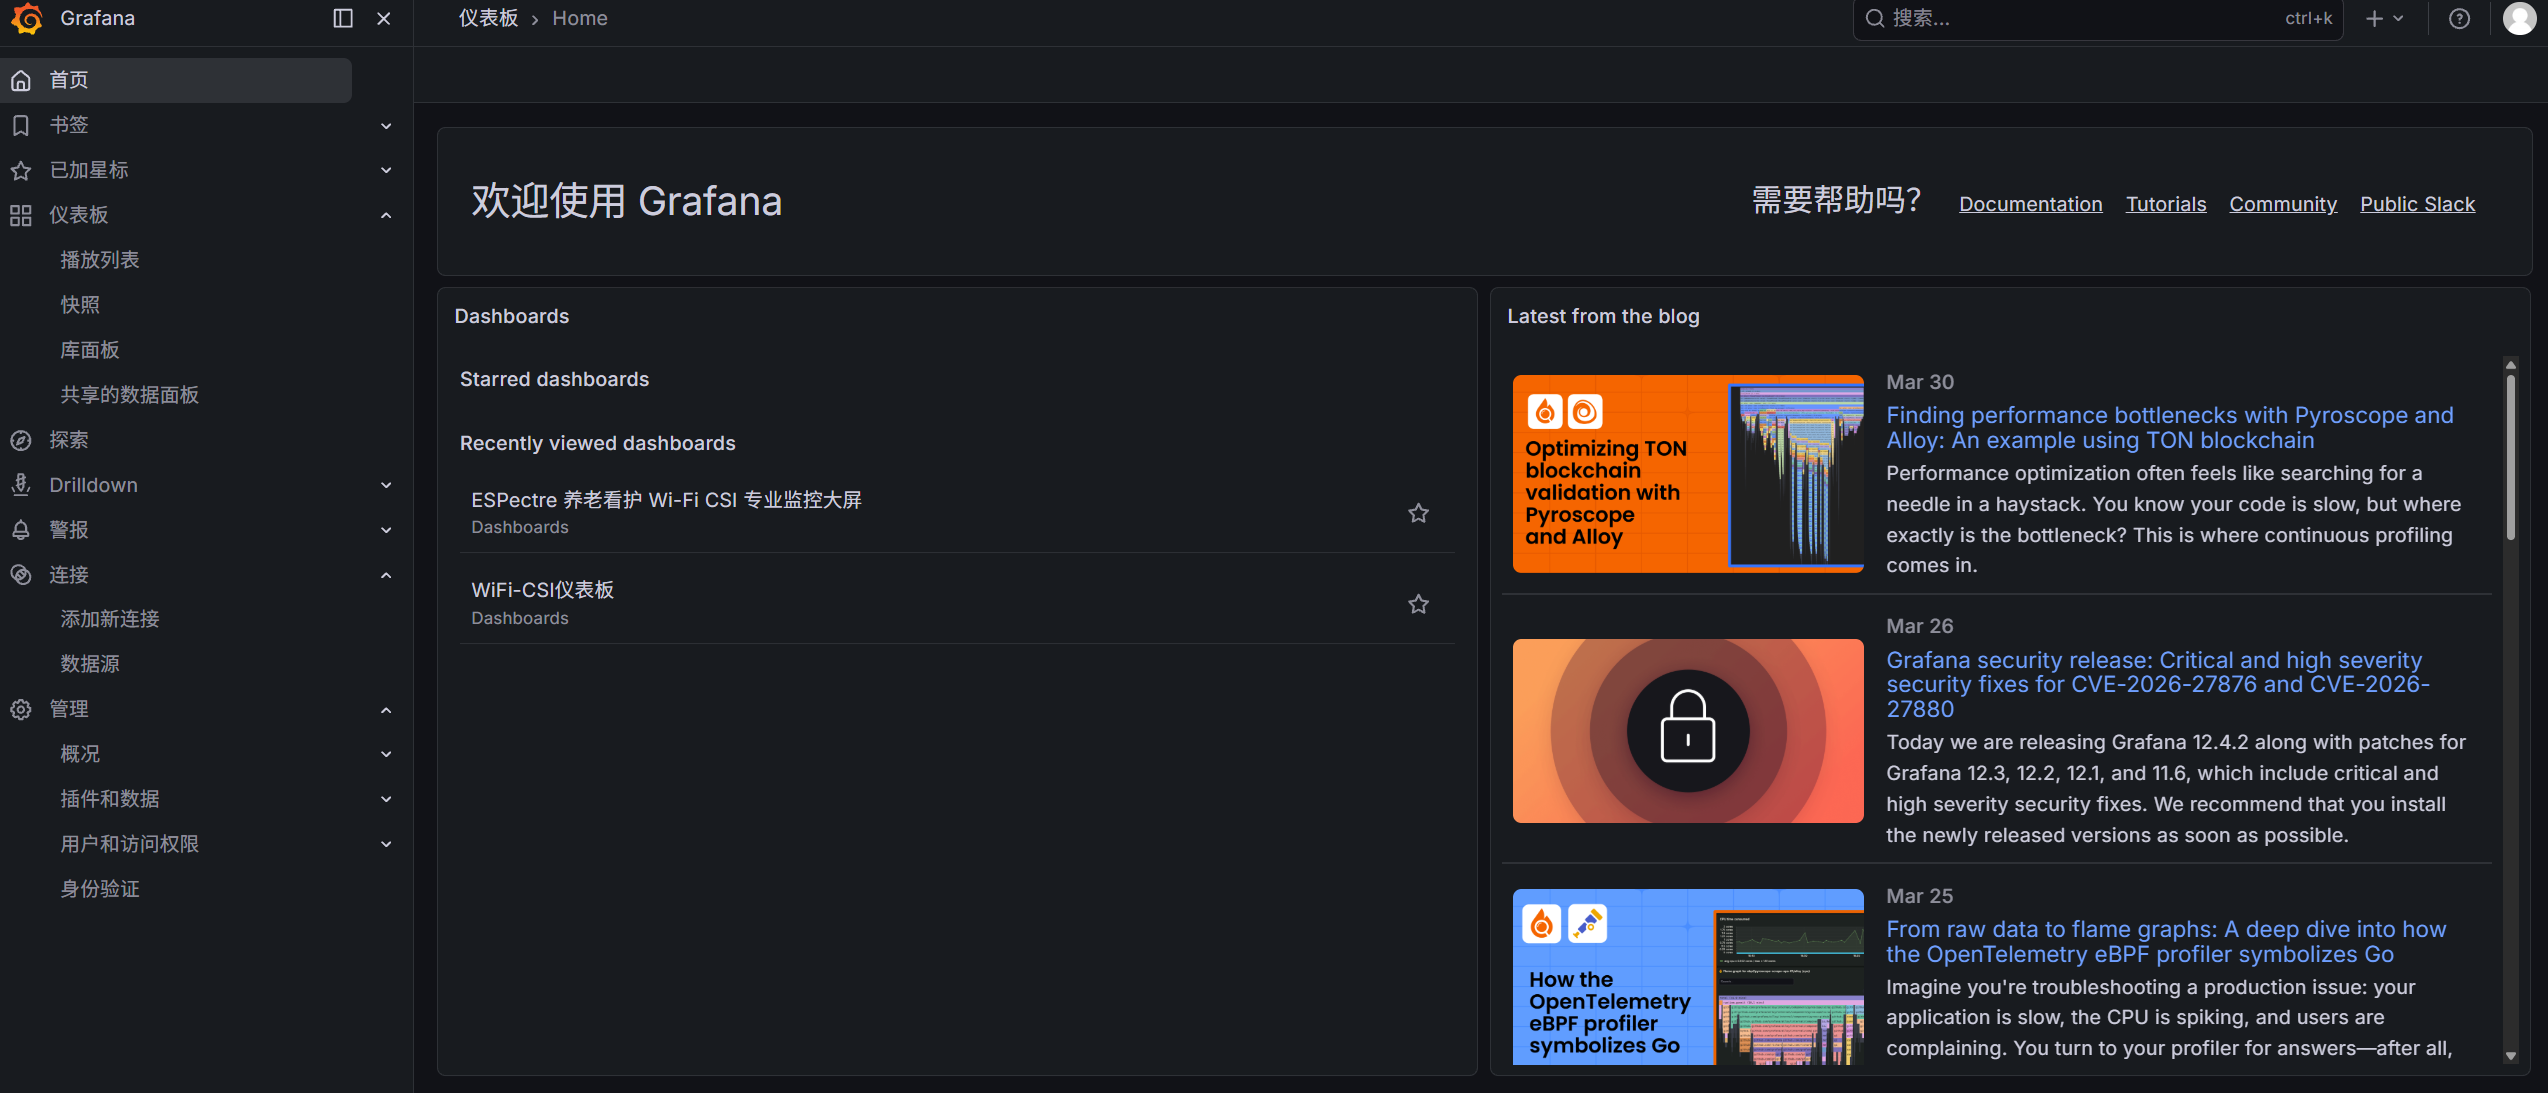
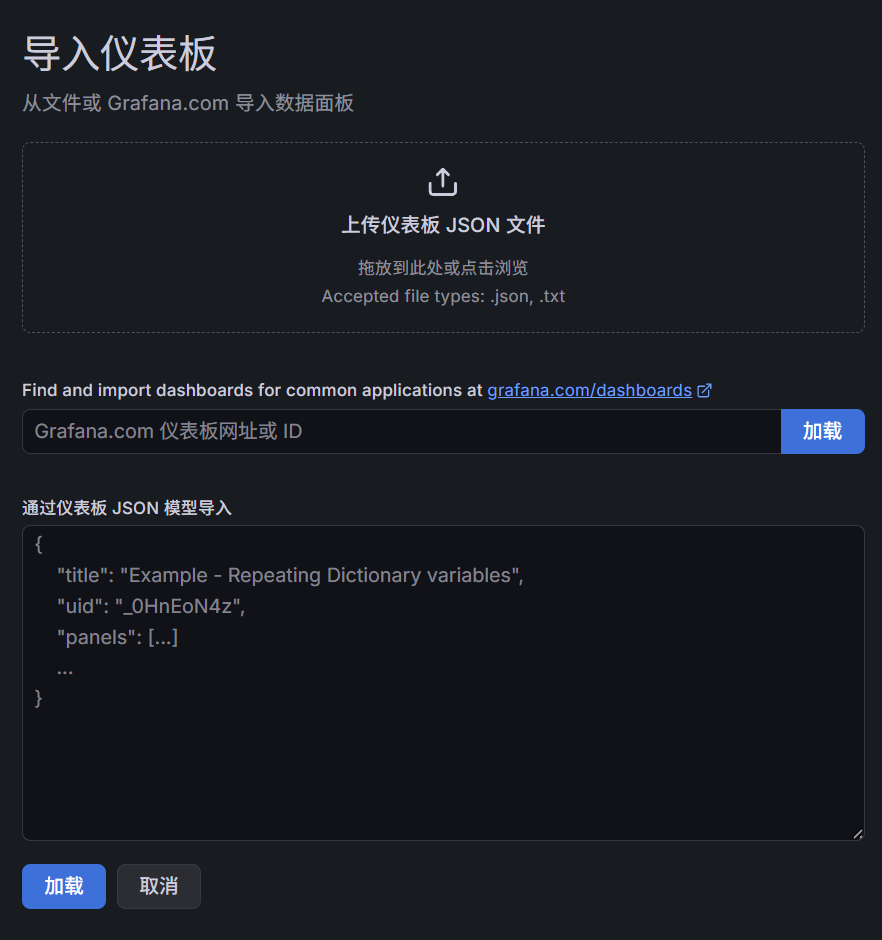
六、导入仪表板
1. 操作步骤
- 点击「导入仪表板」 点击你截图右下角那个 「导入仪表板」 按钮。
- 选择 JSON 文件 弹出窗口后,点击 "从文件上传"(通常是一个上传图标或文字链接),找到你下载的 JSON 文件选中。
- 完成导入 下方会出现一个 "导入" 按钮,点击它,仪表盘就会自动生成。
仪表盘JSON文件:
{
"annotations": {
"list": [
{
"builtIn": 1,
"datasource": {
"type": "grafana",
"uid": "-- Grafana --"
},
"enable": true,
"hide": true,
"iconColor": "rgba(0, 211, 255, 1)",
"name": "Annotations & Alerts",
"type": "dashboard"
}
]
},
"editable": true,
"fiscalYearStartMonth": 0,
"graphTooltip": 0,
"links": [],
"panels": [
{
"datasource": {
"type": "influxdb",
"uid": "influxdb"
},
"description": "ESPectre Wi-Fi CSI 实时运动强度曲线",
"fieldConfig": {
"defaults": {
"color": {
"mode": "palette-classic"
},
"custom": {
"axisBorderShow": false,
"axisCenteredZero": false,
"axisColorMode": "text",
"axisLabel": "活动强度 Movement Score",
"axisPlacement": "auto",
"barAlignment": 0,
"barWidthFactor": 0.6,
"drawStyle": "line",
"fillOpacity": 30,
"gradientMode": "none",
"hideFrom": {
"legend": false,
"tooltip": false,
"viz": false
},
"insertNulls": false,
"lineInterpolation": "linear",
"lineWidth": 2,
"pointSize": 5,
"scaleDistribution": {
"type": "linear"
},
"showPoints": "never",
"showValues": false,
"spanNulls": true,
"stacking": {
"group": "A",
"mode": "none"
},
"thresholdsStyle": {
"mode": "area"
}
},
"mappings": [],
"max": 0.001,
"min": 0,
"thresholds": {
"mode": "absolute",
"steps": [
{
"color": "red",
"value": 0
},
{
"color": "yellow",
"value": 0.0001
},
{
"color": "green",
"value": 0.0002
}
]
},
"unit": "short"
},
"overrides": []
},
"gridPos": {
"h": 10,
"w": 24,
"x": 0,
"y": 0
},
"id": 1,
"options": {
"legend": {
"calcs": [
"mean",
"max",
"min",
"last"
],
"displayMode": "table",
"placement": "bottom",
"showLegend": true
},
"tooltip": {
"hideZeros": false,
"max": true,
"mode": "single",
"sort": "none"
}
},
"pluginVersion": "12.4.2",
"targets": [
{
"datasource": {
"type": "influxdb",
"uid": "influxdb"
},
"query": "from(bucket: \"homeassistant\")\n |> range(start: -24h)\n |> filter(fn: (r) => r[\"_measurement\"] == \"sensor.espectre_movement_score\")\n |> filter(fn: (r) => r[\"_field\"] == \"value\")\n |> aggregateWindow(every: 30s, fn: mean)\n |> yield()",
"refId": "A",
"type": "flux"
}
],
"title": "ESPectre 实时 Movement Score 曲线(养老看护)",
"type": "timeseries"
},
{
"datasource": {
"type": "influxdb",
"uid": "influxdb"
},
"fieldConfig": {
"defaults": {
"color": {
"mode": "thresholds"
},
"mappings": [],
"max": 0.001,
"min": 0,
"thresholds": {
"mode": "absolute",
"steps": [
{
"color": "red",
"value": 0
},
{
"color": "yellow",
"value": 0.0001
},
{
"color": "green",
"value": 0.0002
}
]
},
"unit": "short"
},
"overrides": []
},
"gridPos": {
"h": 4,
"w": 8,
"x": 0,
"y": 10
},
"id": 2,
"options": {
"colorMode": "value",
"graphMode": "none",
"justifyMode": "auto",
"orientation": "auto",
"percentChangeColorMode": "standard",
"reduceOptions": {
"calcs": [
"lastNotNull"
],
"fields": "",
"values": false
},
"showPercentChange": false,
"textMode": "auto",
"wideLayout": true
},
"pluginVersion": "12.4.2",
"targets": [
{
"datasource": {
"type": "influxdb",
"uid": "influxdb"
},
"query": "from(bucket: \"homeassistant\")\n |> range(start: -5m)\n |> filter(fn: (r) => r[\"_measurement\"] == \"sensor.espectre_movement_score\")\n |> filter(fn: (r) => r[\"_field\"] == \"value\")\n |> last()\n |> yield()",
"refId": "A",
"type": "flux"
}
],
"title": "当前实时 Movement Score",
"type": "stat"
},
{
"datasource": {
"type": "influxdb",
"uid": "influxdb"
},
"fieldConfig": {
"defaults": {
"color": {
"mode": "thresholds"
},
"mappings": [
{
"options": {
"0": {
"color": "green",
"index": 1,
"text": "静默"
},
"1": {
"color": "red",
"index": 0,
"text": "活动"
}
},
"type": "value"
}
],
"thresholds": {
"mode": "absolute",
"steps": [
{
"color": "green",
"value": 0
},
{
"color": "red",
"value": "on"
}
]
},
"unit": "none"
},
"overrides": []
},
"gridPos": {
"h": 4,
"w": 8,
"x": 8,
"y": 10
},
"id": 3,
"options": {
"colorMode": "value",
"graphMode": "none",
"justifyMode": "auto",
"orientation": "auto",
"percentChangeColorMode": "standard",
"reduceOptions": {
"calcs": [
"lastNotNull"
],
"fields": "",
"values": false
},
"showPercentChange": false,
"textMode": "auto",
"wideLayout": true
},
"pluginVersion": "12.4.2",
"targets": [
{
"datasource": {
"type": "influxdb",
"uid": "influxdb"
},
"query": "from(bucket: \"homeassistant\")\n |> range(start: -5m)\n |> filter(fn: (r) => r[\"_measurement\"] == \"binary_sensor.espectre_motion_detected\")\n |> filter(fn: (r) => r[\"_field\"] == \"value\")\n |> last()\n |> yield()",
"refId": "A",
"type": "flux"
}
],
"title": "当前检测状态",
"type": "stat"
},
{
"datasource": {
"type": "influxdb",
"uid": "influxdb"
},
"fieldConfig": {
"defaults": {
"color": {
"mode": "thresholds"
},
"mappings": [],
"max": 0.001,
"min": 0,
"thresholds": {
"mode": "absolute",
"steps": [
{
"color": "red",
"value": 0
},
{
"color": "yellow",
"value": 0.0001
},
{
"color": "green",
"value": 0.0002
}
]
},
"unit": "short"
},
"overrides": []
},
"gridPos": {
"h": 4,
"w": 8,
"x": 16,
"y": 10
},
"id": 4,
"options": {
"colorMode": "value",
"graphMode": "none",
"justifyMode": "auto",
"orientation": "auto",
"percentChangeColorMode": "standard",
"reduceOptions": {
"calcs": [
"min"
],
"fields": "",
"values": false
},
"showPercentChange": false,
"textMode": "auto",
"wideLayout": true
},
"pluginVersion": "12.4.2",
"targets": [
{
"datasource": {
"type": "influxdb",
"uid": "influxdb"
},
"query": "from(bucket: \"homeassistant\")\n |> range(start: -24h)\n |> filter(fn: (r) => r[\"_measurement\"] == \"sensor.espectre_movement_score\")\n |> filter(fn: (r) => r[\"_field\"] == \"value\")\n |> filter(fn: (r) => r[\"_value\"] > 0)\n |> min()\n |> yield()",
"refId": "A",
"type": "flux"
}
],
"title": "24小时最低分值",
"type": "stat"
}
],
"preload": false,
"refresh": "5s",
"schemaVersion": 42,
"tags": [
"ESPectre",
"Wi-Fi CSI",
"养老看护",
"监控大屏"
],
"templating": {
"list": []
},
"time": {
"from": "now-24h",
"to": "now"
},
"timepicker": {},
"timezone": "Asia/Shanghai",
"title": "ESPectre 养老看护 Wi-Fi CSI 专业监控大屏",
"uid": "espectre-elderly-final-final",
"version": 3,
"weekStart": ""
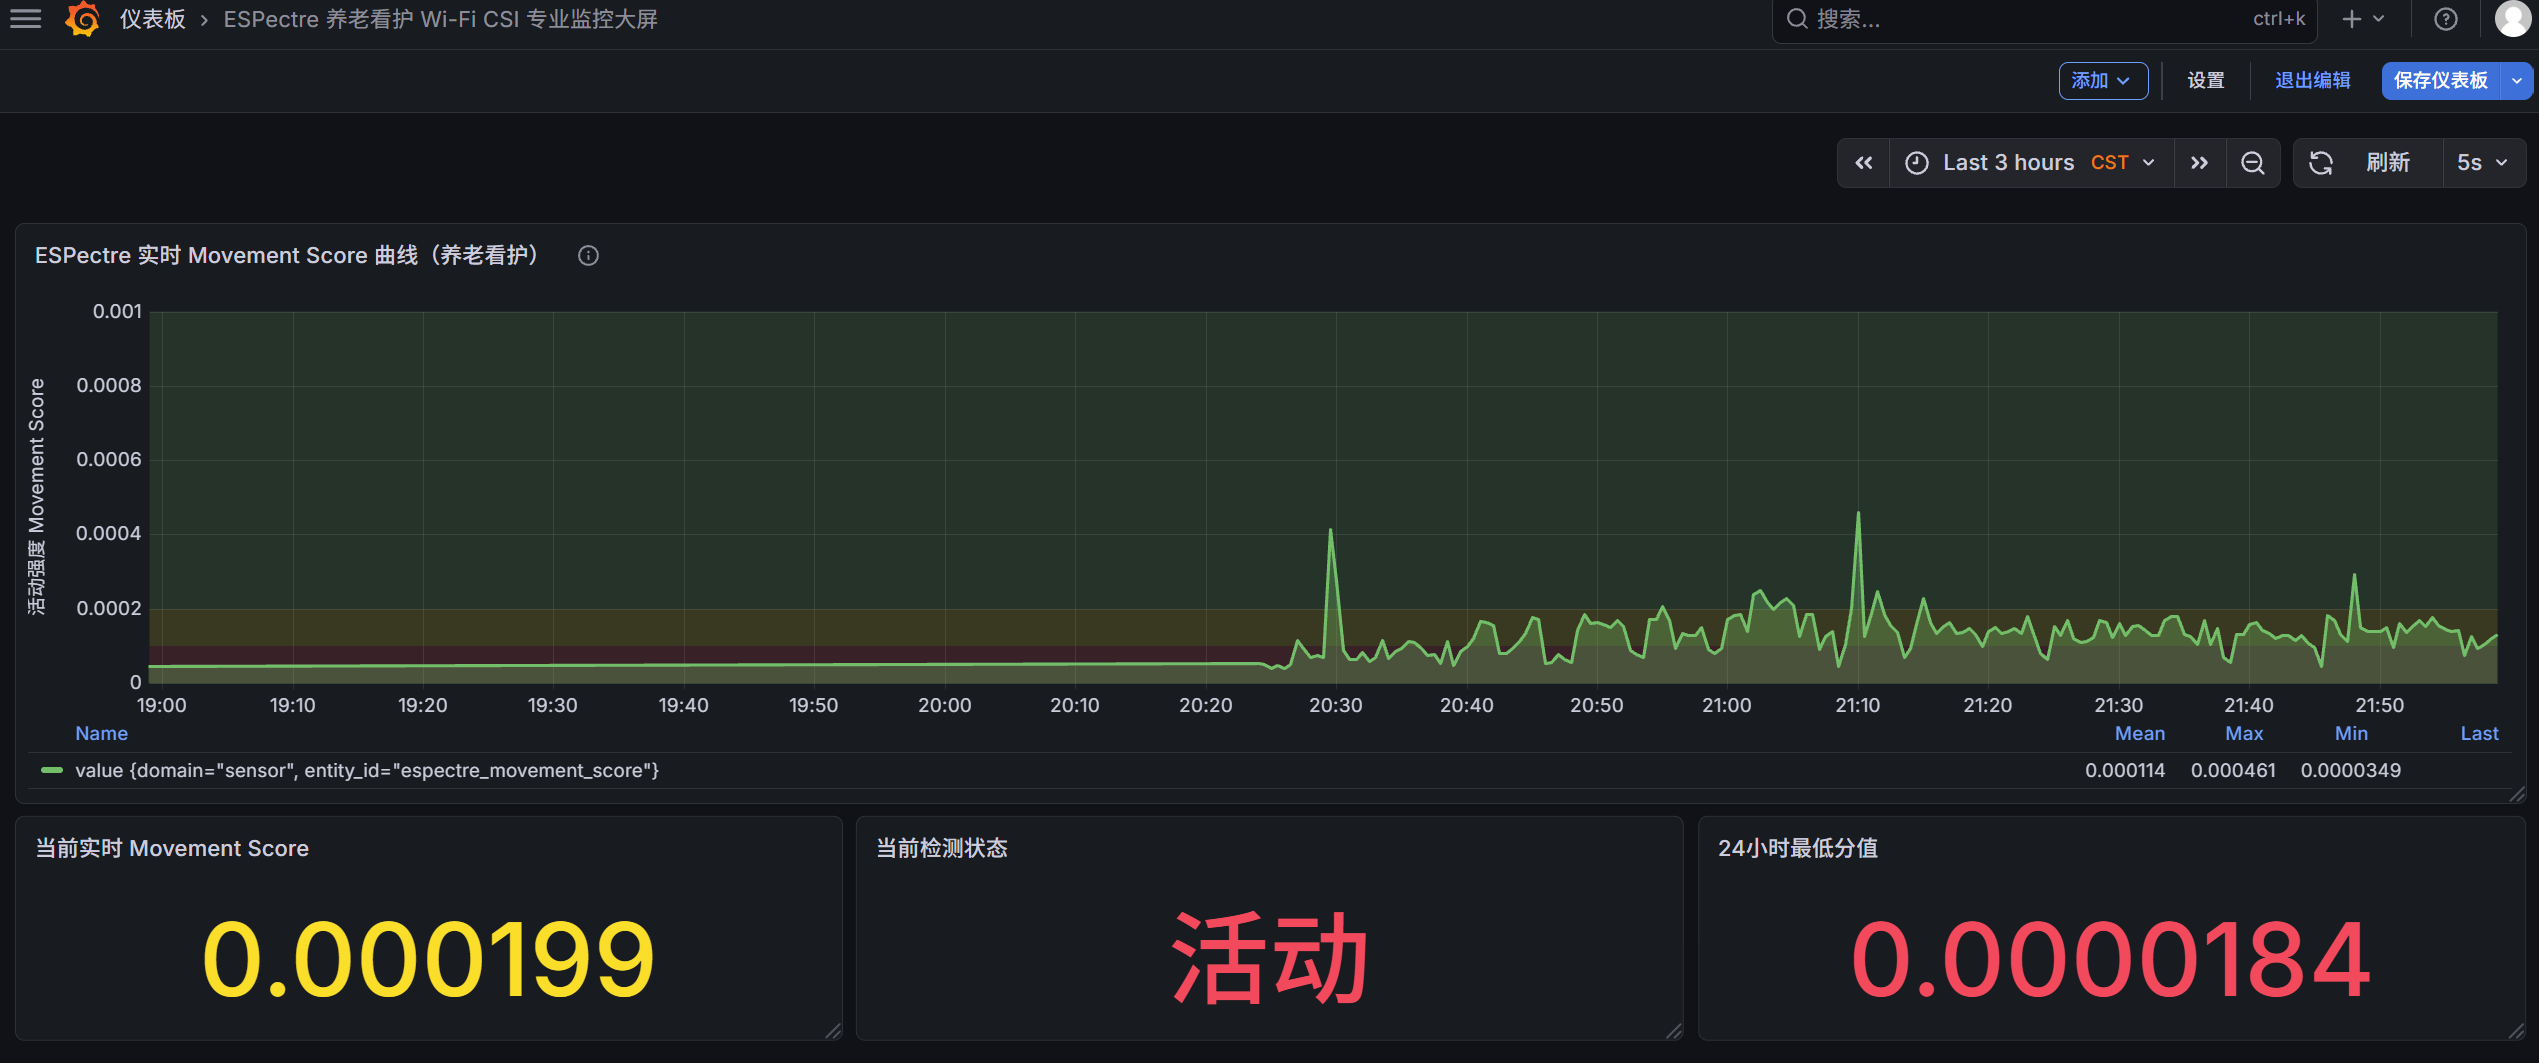
}2. 曲线解读
- 红色区域(<0.0001):长期静默,老人躺卧 / 不动,属于正常状态,可作为跌倒 / 异常告警的触发阈值
- 黄色区域(0.0001~0.0002):低活动,老人轻微动作
- 绿色区域(>0.0002):正常活动,老人走动 / 起身,20:20 后的峰值就是典型的活动信号
- 统计值:Mean (均值 0.000106)、Max (峰值 0.000461)、Min (最低 0.000181,修复后显示真实值)、Last (当前 0.0000636,静默状态)