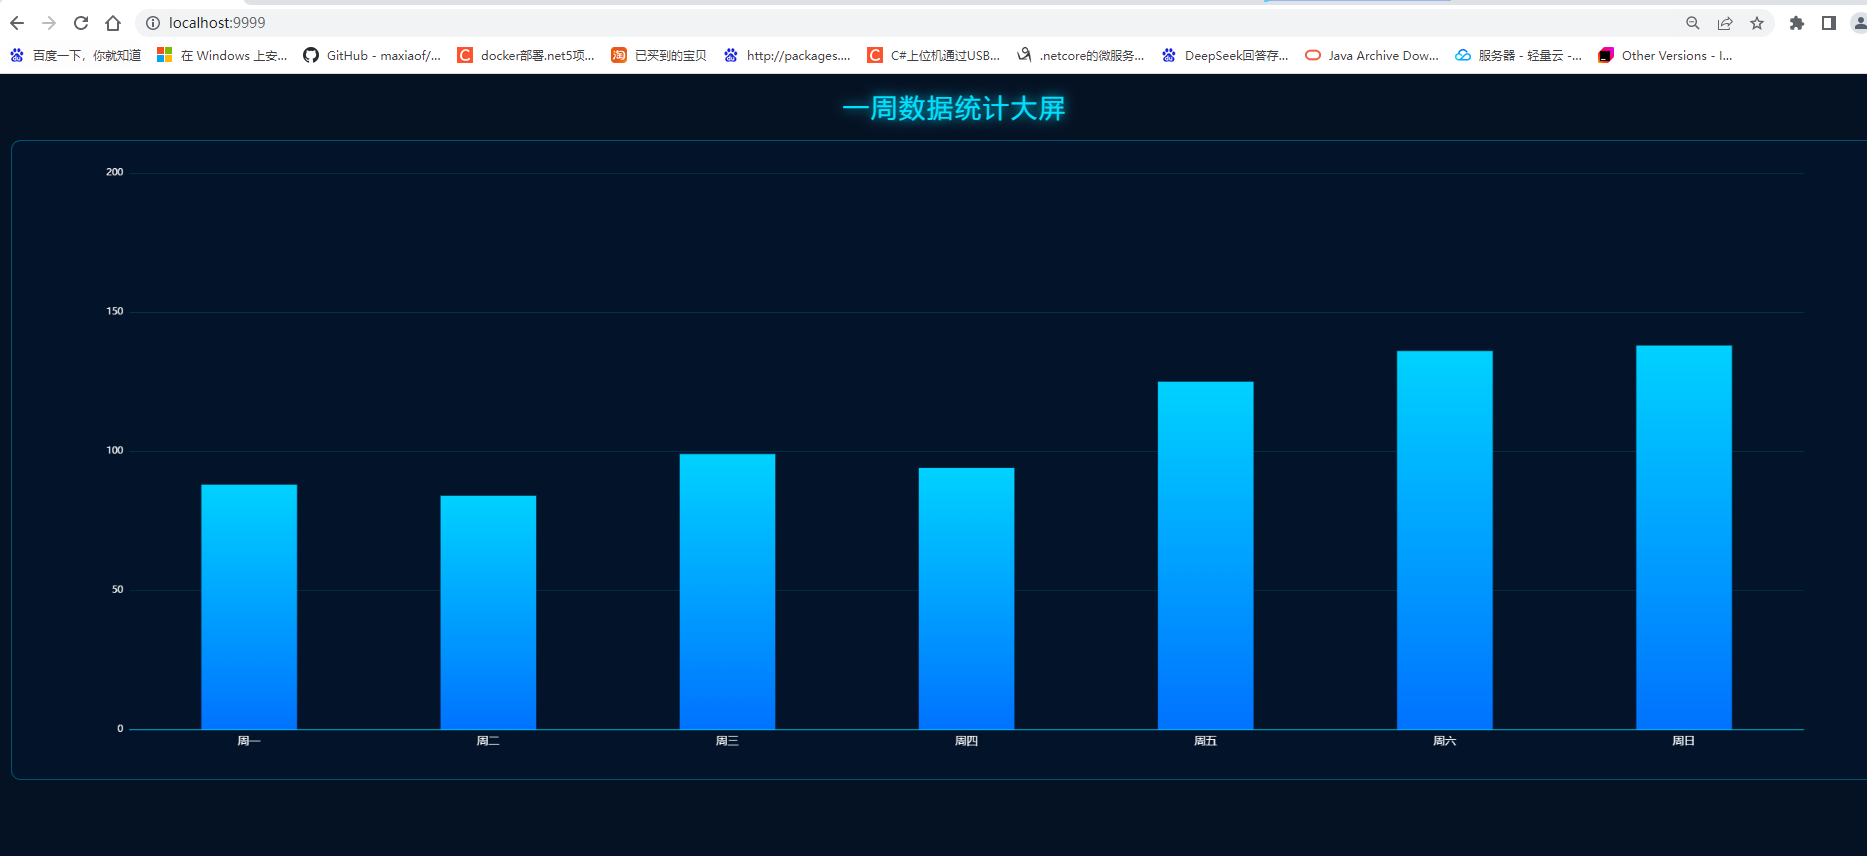
1.效果
2.代码html
<!DOCTYPE html>
<html lang="zh-CN">
<head>
  <meta charset="UTF-8" />
  <title>数据监控看板</title>
  <script src="https://cdn.jsdelivr.net/npm/echarts/dist/echarts.min.js"></script>
  <style>
    * {
      margin: 0;
      padding: 0;
      box-sizing: border-box;
    }

    body {
      background: #051224;
      padding: 20px;
      font-family: "Microsoft YaHei", sans-serif;
    }

    .title {
      text-align: center;
      font-size: 32px;
      color: #00e0ff;
      letter-spacing: 3px;
      margin-bottom: 20px;
      text-shadow: 0 0 15px #00e0ff;
    }

    #chart {
      width: 100%;
      height: 800px;
      border: 1px solid rgba(0, 224, 255, 0.3);
      border-radius: 12px;
      background: rgba(0, 20, 50, 0.4);
      backdrop-filter: blur(5px);
    }
  </style>
</head>

<body>
  <div class="title">一周数据统计大屏</div>
  <div id="chart"></div>

  <script>
    const myChart = echarts.init(document.getElementById('chart'));
    const week = ['周一', '周二', '周三', '周四', '周五', '周六', '周日'];

    // 生成80-160的随机数据
    function getRandomData() {
      return week.map(() => Math.floor(Math.random() * 80) + 80);
    }

    // 更新图表
    function updateChart() {
      const data = getRandomData();
      myChart.setOption({
        tooltip: {
          trigger: 'axis',
          backgroundColor: 'rgba(0, 10, 30, 0.9)',
          borderColor: '#00e0ff',
          textStyle: { color: '#fff' }
        },
        grid: {
          left: '5%',
          right: '5%',
          bottom: '5%',
          top: '5%',
          containLabel: true
        },
        xAxis: {
          type: 'category',
          data: week,
          axisLine: { lineStyle: { color: '#00e0ff' } },
          axisLabel: { color: '#fff', fontSize: 14 }
        },
        yAxis: {
          type: 'value',
          min: 0,
          max: 200,
          axisLine: { lineStyle: { color: '#00e0ff' } },
          splitLine: { lineStyle: { color: 'rgba(0,224,255,0.15)' } },
          axisLabel: { color: '#fff' }
        },
        series: [{
          type: 'bar',
          data: data,
          barWidth: '40%',
          itemStyle: {
            color: new echarts.graphic.LinearGradient(0, 0, 0, 1, [
              { offset: 0, color: '#00d2ff' },
              { offset: 1, color: '#0072ff' }
            ])
          }
        }]
      });
    }

    // 首次加载
    updateChart();
    // 每3秒自动刷新
    setInterval(updateChart, 3000);
  </script>
</body>
</html>
3.nginx.conf配置
#user  nobody;
worker_processes  1;

#error_log  logs/error.log;
#error_log  logs/error.log notice;
#error_log  logs/error.log info;

#pid        logs/nginx.pid;

events {
    worker_connections  1024;
}

http {
    include       mime.types;
    default_type  application/octet-stream;

    sendfile        on;
    keepalive_timeout  65;

    server {
        listen       9999;
        server_name  localhost;

        location / {
            root   html;
            index  index.html index.htm;
        }

        error_page   500 502 503 504  /50x.html;
        location = /50x.html {
            root   html;
        }
    }
}
4.Ngixn静默启动
@echo off
chcp 437 >nul
cd /d "%~dp0"

echo Closing old Nginx...
taskkill /f /im nginx.exe >nul 2>&1
timeout /t 1 /nobreak >nul

echo Starting Nginx...
start nginx.exe

echo ======================================
echo  SUCCESS! Nginx is running
echo  Open your browser:
echo  http://localhost:9999
echo ======================================
pause