前端数字孪生大屏,使用vue3+Elementplus+Echarts+TS实现智慧城市大屏,数字孪生,监控大屏展示,可下载作为课堂作业、界面模板、扩展开发,个人作品等。
若想系统学习Echarts开发,我的课程提供了完整的Echarts基础知识讲解并附加大量实战案例,系列课程地址如下:
1. CSDN课程:https://edu.csdn.net/course/detail/40842
2. 51学堂课程:https://edu.51cto.com/course/40414.html
3. B站课程:https://www.bilibili.com/cheese/play/ss456500998
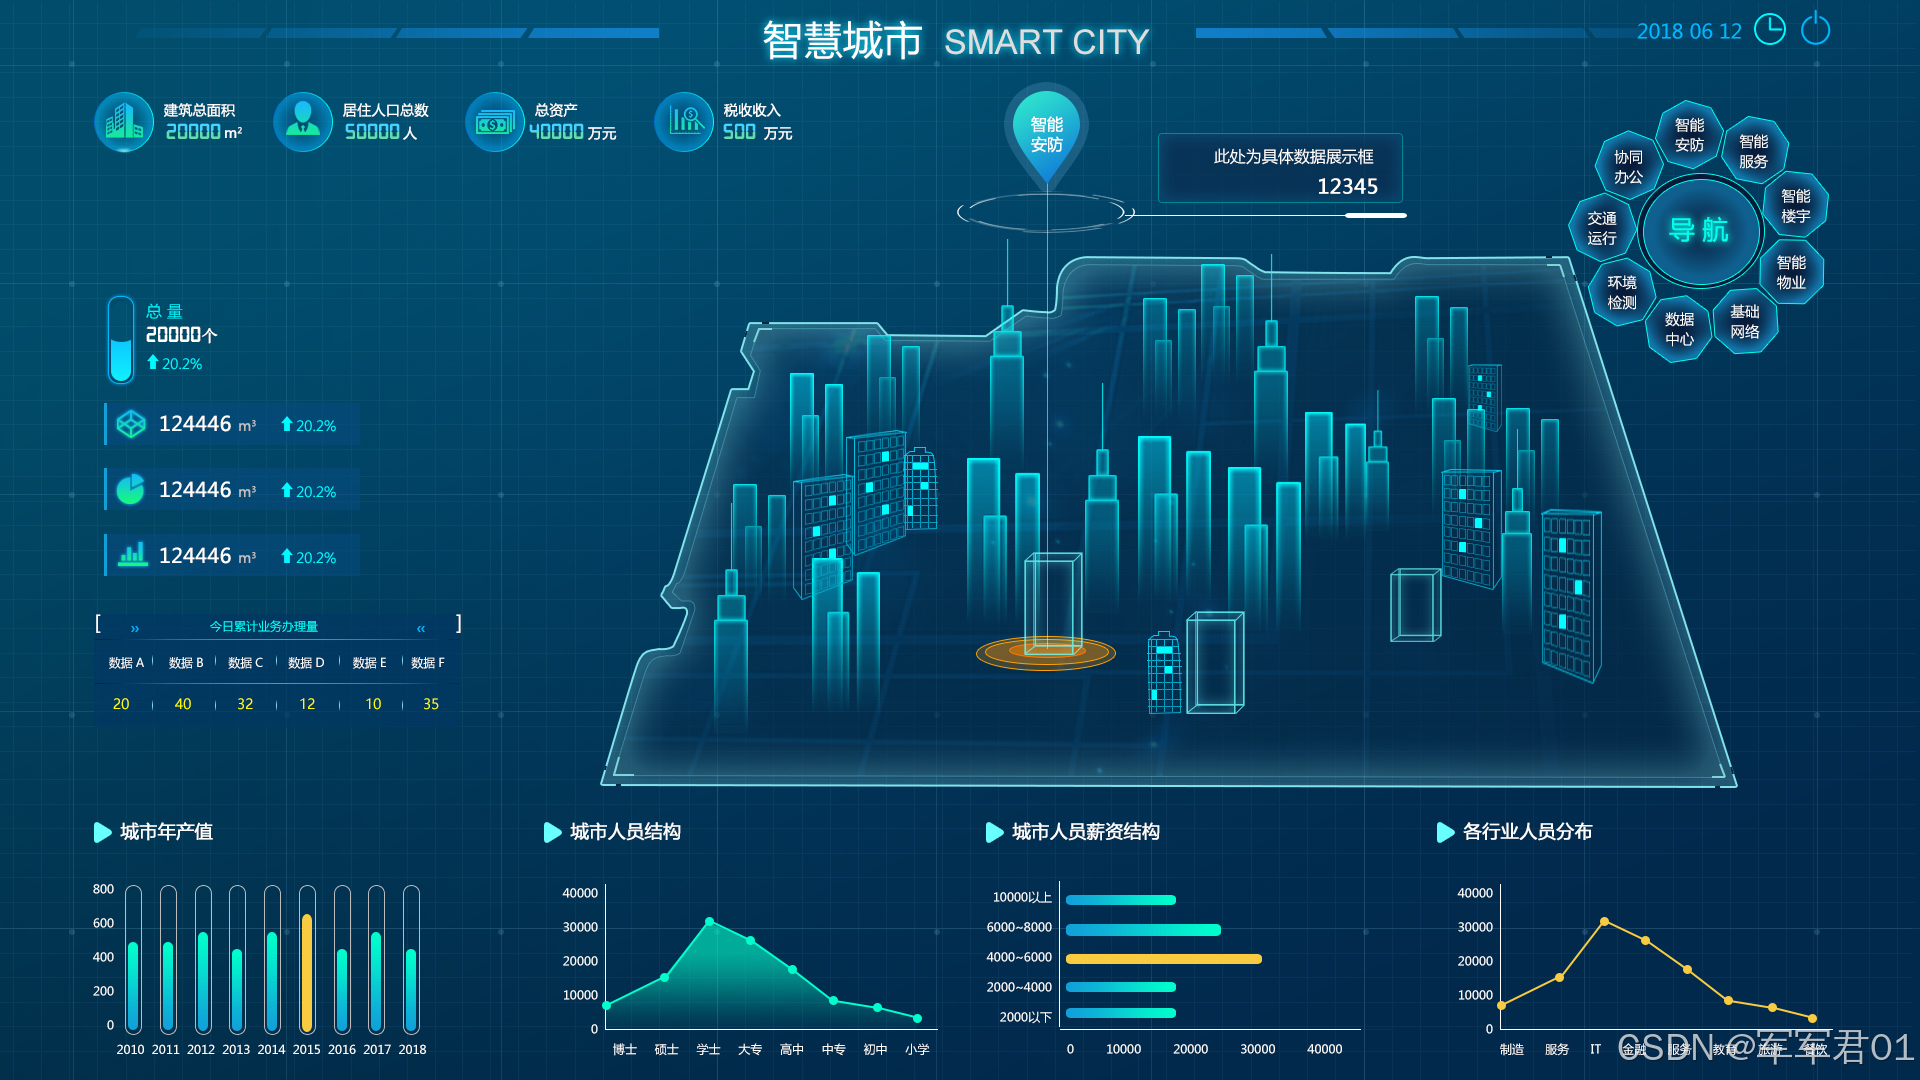
一.效果展示:

二.源码下载:
三.开发视频:
https://www.bilibili.com/video/BV1tmQpBgEsk/
四.实现明细:
4.1 开发环境
使用vscode开发,nodejs版本为v24.11.0,其它项目依赖如下:
1. "dayjs": "^1.11.20"
2. "echarts": "^6.0.0"
3. "element-plus": "^2.13.6"
4. "less": "^4.6.4"
5. "pinia": "^3.0.4"
6. "vue": "^3.5.31"
7. "vue-router": "^5.0.4"
4.2 实现明细
- main.ts
javascript
import { createApp } from 'vue'
import { createPinia } from 'pinia'

import App from './App.vue'
import router from './router'
import * as ElementPlusIconsVue from '@element-plus/icons-vue'
import ElementPlus from 'element-plus'
import 'element-plus/dist/index.css'

const app = createApp(App)
app.use(ElementPlus)
app.use(createPinia())
app.use(router)
for (const [key, component] of Object.entries(ElementPlusIconsVue)) {
  app.component(key, component)
}

app.mount('#app')- App.vue
javascript
<script setup lang="ts"></script>

<template>
  <RouterView></RouterView>
</template>

<style >
@import url("@/assets/main.css");
</style>- router/index.ts
javascript
import { createRouter, createWebHistory } from 'vue-router'
import HomeView from "@/views/HomeView.vue"
const router = createRouter({
  history: createWebHistory(import.meta.env.BASE_URL),
  routes: [{
    path:'',
    name:'主页',
    component:HomeView
  }],
})

export default router- HomeView.vue
javascript
<script setup lang="ts">
  import BaseInfoItem from '@/components/BaseInfoItem.vue';
import CenterMapItem from '@/components/CenterMapItem.vue';
import ChartItem from '@/components/ChartItem.vue';
import Header from '@/components/Header.vue';
import { onMounted, onUnmounted, reactive, ref } from 'vue';
import * as echarts from 'echarts';


const yearChartRef = ref();
const yearChart = ref();
const yearChartOptions = reactive({
  grid:{
    left:'5%',
    top:'5%',
    right:'5%',
    bottom:'5%',
    containLabel:true,
  },
  xAxis: {
    type: 'category',
    data: ['2015', '2016', '2017', '2018', '2019', '2020', '2021'],
    axisLabel:{
      color:'#fff'
    },
    splitLine:{
      show:false
    }
  },
  yAxis: {
    type: 'value',
    axisLabel:{
      color:'#fff'
    },
    splitLine:{
      show:false
    }
  },
  series: [
    {
      data: [120, 200, 150, 80, 70, 110, 130],
      type: 'bar',
      showBackground: true,
      backgroundStyle: {
        color: '#11a0d822',
        borderRadius:[20]
      },
      barWidth:20,
      itemStyle:{
        borderRadius:[20],
        color:new echarts.graphic.LinearGradient(0, 0, 0, 1, [
          {
            offset: 0,
            color: '#11a0d8'
          },
          {
            offset: 1,
            color: '#01fecc'
          }
        ])
      }
    }
  ]
});

const orgChartRef = ref();
const orgChart = ref();
const orgChartOptions = reactive({
  grid:{
    left:'5%',
    top:'5%',
    right:'5%',
    bottom:'5%',
    containLabel:true,
  },
  xAxis: {
    type: 'category',
    data: ['博士', '硕士', '学士', '大专', '高中', '中专', '初中','小学'],
    axisLabel:{
      color:'#fff'
    },
    splitLine:{
      show:false
    }
  },
  yAxis: {
    type: 'value',
    axisLabel:{
      color:'#fff'
    },
    splitLine:{
      show:false
    }
  },
  series: [
    {
      data: [120, 200, 150, 80, 70, 110, 130,434],
      type: 'line',
      itemStyle:{
        color:'#01fecc'
      },
      areaStyle: {
        color: new echarts.graphic.LinearGradient(0, 0, 0, 1, [
          {
            offset: 0,
            color: '#01fecc'
          },
          {
            offset: 1,
            color: '#01fecc00'
          }
        ])
      }
    }
  ]
});


const costChartRef = ref();
const costChart = ref();
const costChartOptions = reactive({
  grid:{
    left:'5%',
    top:'5%',
    right:'5%',
    bottom:'5%',
    containLabel:true,
  },
  yAxis: {
    type: 'category',
    data: ['2000以下', '2000-4000', '4000-6000', '6000-8000', '8000-10000', '10000以上'],
    axisLabel:{
      color:'#fff'
    },
    splitLine:{
      show:false
    }
  },
  xAxis: {
    type: 'value',
    axisLabel:{
      color:'#fff'
    },
    splitLine:{
      show:false
    }
  },
  series: [
    {
      data: [120, 200, 150, 80, 70, 110, 130],
      type: 'bar',
      showBackground: false,
      barWidth:10,
      itemStyle:{
        borderRadius:[20],
        color:new echarts.graphic.LinearGradient(0, 0, 0, 1, [
          {
            offset: 0,
            color: '#f9cb41'
          },
          {
            offset: 1,
            color: '#f9cb41'
          }
        ])
      }
    }
  ]
});


const typeChartRef = ref();
const typeChart = ref();
const typeChartOptions = reactive({
  grid:{
    left:'5%',
    top:'5%',
    right:'5%',
    bottom:'5%',
    containLabel:true,
  },
  xAxis: {
    type: 'category',
    data: ['制造', '服务', 'IT', '金融', '教育', '旅游', '餐饮','培训'],
    axisLabel:{
      color:'#fff'
    },
    splitLine:{
      show:false
    }
  },
  yAxis: {
    type: 'value',
    axisLabel:{
      color:'#fff'
    },
    splitLine:{
      show:false
    }
  },
  series: [
    {
      data: [120, 200, 150, 80, 70, 110, 130,434],
      type: 'line',
      itemStyle:{
        color:'#f9cb41'
      }
    }
  ]
});

onMounted(()=>{
  yearChart.value = echarts.init(yearChartRef.value);
  yearChart.value.setOption(yearChartOptions);

  orgChart.value = echarts.init(orgChartRef.value);
  orgChart.value.setOption(orgChartOptions);

  costChart.value = echarts.init(costChartRef.value);
  costChart.value.setOption(costChartOptions);

  typeChart.value = echarts.init(typeChartRef.value);
  typeChart.value.setOption(typeChartOptions);

})
</script>

<template>
  <div class="page">
      <Header></Header>
      <div class="center">
        <BaseInfoItem class="base-info"></BaseInfoItem>
        <CenterMapItem class="center-map"></CenterMapItem>
      </div>
      <div class="bottom">
        <el-row>
          <el-col :span="6">
            <ChartItem title="城市年产值" class="chart-item">
              <div class="chart-panel" ref="yearChartRef"></div>
            </ChartItem>
          </el-col>
          <el-col :span="6">
            <ChartItem title="城市人员结构" class="chart-item">
              <div class="chart-panel" ref="orgChartRef"></div>
            </ChartItem>
          </el-col>
          <el-col :span="6">
            <ChartItem title="城市人员薪资结构" class="chart-item">
              <div class="chart-panel" ref="costChartRef"></div>
            </ChartItem>
          </el-col>
          <el-col :span="6">
            <ChartItem title="各行业人员分布" class="chart-item">
              <div class="chart-panel" ref="typeChartRef"></div>
            </ChartItem>
          </el-col>
        </el-row>
      </div>
  </div>
</template>
<style lang="less" scoped>
  .page{
    background: url("@/assets/images/bj2.png") 100% 100% no-repeat;
    height: 100vh;
    width: 100vw;

    .center,.bottom{
      padding: 0 40px;
    }
    .center{
      height: calc(75vh - 60px  );
      .base-info{
        width:40vw;
      }
      .center-map{
        height: calc(75vh - 60px - 79px );
      }
    }
    .chart-panel{
      height: calc(25vh - 30px);
    }
  }
</style>- BaseInfoItem.vue
javascript
<template>
    <div class="base-info">
          <div class="base-info-item">
            <div class="icon">
              <img src="@/assets/images/icon-001.png">
            </div>
            <div class="content">
              <div class="text">建筑总面积</div>
              <div class="value-item">
                <div class="value">{{ value1 }}</div>
                <div class="unit">㎡</div>
              </div>
            </div>
          </div>
          <div class="base-info-item">
            <div class="icon">
              <img src="@/assets/images/icon-002.png">
            </div>
            <div class="content">
              <div class="text">居住人口总数</div>
              <div class="value-item">
                <div class="value">{{ value2 }}</div>
                <div class="unit">人</div>
              </div>
            </div>
          </div>
          <div class="base-info-item">
            <div class="icon">
              <img src="@/assets/images/icon-003.png">
            </div>
            <div class="content">
              <div class="text">总资产</div>
              <div class="value-item">
                <div class="value">{{ value3 }}</div>
                <div class="unit">万元</div>
              </div>
            </div>
          </div>
          <div class="base-info-item">
            <div class="icon">
              <img src="@/assets/images/icon-004.png">
            </div>
            <div class="content">
              <div class="text">税收收入</div>
              <div class="value-item">
                <div class="value">{{ value4 }}</div>
                <div class="unit">万元</div>
              </div>
            </div>
          </div>
        </div>
</template>
<script setup lang="ts">
import { ref } from 'vue';

const value1 = ref(4324);
const value2 = ref(5436);
const value3 = ref(7656);
const value4 = ref(43243);
</script>
<style lang="less" scoped>
    .base-info{
        display: flex;

        .base-info-item{
            flex: 1;
            color: #fff;
            display: flex;

            .icon{
                width:69px;
                height: 69px;
                text-align: center;
                background: url("@/assets/images/icon-012.png") 100% 100% no-repeat;
                border-radius: 50%;
                display: flex;
                justify-content: center;
                justify-items: center;
                align-items: center;
                align-content: center;
            }
            .content{
                padding-left: 10px;
                .text{
                    line-height: 40px;
                }
                .value-item{
                    display: flex;

                    .value{
                        font-size: 1.2rem;
                        line-height: 20px;
                        color:#61ddb1;
                        font-weight: bold;
                    }
                    .unit{
                        margin-left: 10px;
                    }
                }
            }
        }
    }
</style>- CenterMapItem.vue
javascript
<template>
<div class="city">
<div class="left">
<div class="content-panel">
<div class="total">
<div class="icon">
<div class="inner">
<div class="value" :style="{'height':value2+'%'}"></div>
</div>
</div>
<div class="content">
<div class="title">总量</div>
<div class="value">{{ value1 }}<text class="unit">个</text></div>
<div class="percent">
<div><el-icon><Top /></el-icon>{{ value2 }}%</div>
</div>
</div>
</div>
<div class="infos">
<div class="item">
<div class="icon">
<el-icon><Files /></el-icon>
</div>
<div class="value">{{ infos[0].value1 }}<text class="unit">㎡</text></div>
<div class="percent"><el-icon><Top /></el-icon>{{ infos[0].value2 }}%</div>
</div>
<div class="item">
<div class="icon">
<el-icon><Reading /></el-icon>
</div>
<div class="value">{{ infos[1].value1 }}<text class="unit">㎡</text></div>
<div class="percent"><el-icon><Top /></el-icon>{{ infos[1].value2 }}%</div>
</div>
<div class="item">
<div class="icon">
<el-icon><DataAnalysis /></el-icon>
</div>
<div class="value">{{ infos[2].value1 }}<text class="unit">㎡</text></div>
<div class="percent"><el-icon><Top /></el-icon>{{ infos[2].value2 }}%</div>
</div>
</div>
<div class="today">
<div class="title">
<div class="left">[</div>
<div class="left"><el-icon><DArrowRight /></el-icon></div>
<div class="center">
今日累计业务办理量
</div>
<div class="right"><el-icon><DArrowLeft /></el-icon></div>
<div class="right">]</div>
</div>
<div class="line"></div>
<div class="tr">
<div class="th">数据A</div>
<div class="th">数据B</div>
<div class="th">数据C</div>
<div class="th">数据D</div>
<div class="th">数据E</div>
<div class="th">数据F</div>
</div>
<template v-for="(item,index) in todayDatas">
<div class="line" ></div>
<div class="tr" >
<div class="td">{{ item[0] }}</div>
<div class="td">{{ item[1] }}</div>
<div class="td">{{ item[2] }}</div>
<div class="td">{{ item[3] }}</div>
<div class="td">{{ item[4] }}</div>
<div class="td">{{ item[5] }}</div>
</div>
</template>
</div>
</div>
</div>
<div class="city-map">
<div class="map">
<img src="@/assets/images/icon-008.png" class="bg">
<div class="">
<img src="@/assets/images/icon-007.png" class="bottom-img">
<img src="@/assets/images/icon-006.png" class="top-img">
<div class="v-line"></div>
<div class="h-line">
<div class="empty"></div>
<div class="right-line"></div>
</div>
<div class="device-info">
<img src="@/assets/images/icon-013.png" class="info-img">
<div class="text">智能安防</div>
</div>
<div class="value-info">
<div class="text">智能设备数量</div>
<div class="value">{{ value }}</div>
</div>
</div>
</div>
<div class="navgative-panel">
<div class="center">
<div class="center-inner">
导航
</div>
</div>
<div class="item item1">智能安防</div>
<div class="item item2">智能服务</div>
<div class="item item3">智能楼宇</div>
<div class="item item4">智能物业</div>
<div class="item item5">基础网站</div>
<div class="item item6">数据中心</div>
<div class="item item7">环境检测</div>
<div class="item item8">交通运行</div>
<div class="item item9">协同办公</div>
</div>
</div>
</div>
</template>
<script setup lang="ts">
import { reactive, ref } from 'vue';
const value = ref(323213);
const value1 = ref(323213);
const value2 = ref(65);
const infos = reactive([{
value1:23321365,
value2:43,
},{
value1:32132132,
value2:76,
},{
value1:21321322,
value2:23,
}])
const todayDatas = reactive([[
432,654,543,315,465,343
],[
432,654,543,315,465,343
],[
432,654,543,315,465,343
]])
</script>
<style lang="less" scoped>
.city {
display: flex;
.left {
width: 30%;
display: flex;
justify-content: center;
justify-items: center;
align-items: center;
align-content: center;
text-align: center;
.content-panel{
flex: 1;
.total{
display: flex;
color: #fff;
.icon{
width:40px;
.inner{
width:30px;
height: 80px;
margin: 0 auto;
border-radius: 30px;
border: 2px solid #00b7ff;
position: relative;
.value{
margin: 5px;
width: 17px;
height: 20%;
background: linear-gradient(1deg, #10edff, #0ccbff);
border-radius: 20px;
position: absolute;
bottom: 0px;
}
}
}
.content{
padding-left: 10px;
text-align: left;
.title{
line-height: 30px;
color: #00f8fe;
}
.value{
color: #fff;
line-height: 30px;
font-size: 1.2rem;
.unit{
font-size: 0.6rem;
margin-left: 10px;
}
}
.percent{
color:#00b8c7;
:deep(.el-icon){
position: relative;
top: 3px;
}
}
}
}
.infos{
.item{
display: flex;
color: #fff;
border-left: 2px solid #11a0d8;
padding:5px;
margin: 20px 0px;
padding-bottom: 0;
background: #044975;
.icon{
width:30px;
text-align: center;
color: #16ee89;
font-size: 1.2rem;
position: relative;
top: 0px;
}
.value{
flex: 1;
font-size: 1.2rem;
.unit{
font-size: 0.6rem;
margin-left: 10px;
}
}
.percent{
color: #16ee89;
:deep(.el-icon){
position: relative;
top: 3px;
}
}
}
}
.today{
margin-top: 20px;
background: #013962;
.title{
display: flex;
color: #fff;
margin-bottom: 10px;
.left,.right{
width:20px;
text-align: center;
:deep(.el-icon){
position: relative;
top: 3px;
color:#0087c6
}
}
.center{
flex: 1;
text-align: center;
color: #03aeb6;
}
}
.line{
height: 1px;
width:100%;
background: linear-gradient(465deg,#00030000,#17a4ff,#00030000);
}
.tr{
display: flex;
line-height: 30px;
text-align: center;
.th,.td{
flex: 1;
color: #fff;
}
.td{
color: #ffff01;
}
}
}
}
}
.city-map {
flex: 1;
height: calc(75vh - 60px - 79px);
position: relative;
.map {
height: calc(75vh - 60px - 79px);
position: relative;
.bg {
position: absolute;
left: 0px;
top: 10%;
// width:80%;
height: 90%;
}
.bottom-img {
position: absolute;
left: 26%;
bottom: 18%;
}
.top-img {
position: absolute;
left: 25%;
top: 1%;
}
.v-line {
position: absolute;
left: 31.5%;
width: 1px;
height: 74%;
background: #ffffff52;
top: 4%;
}
.h-line {
width: 14%;
height: 1px;
background: #fff;
position: absolute;
left: 38%;
top: 5%;
display: flex;
.empty {
flex: 1
}
.right-line {
height: 3px;
position: relative;
top: -1px;
background: #fff;
z-index: 1;
width: 40px;
border-radius: 4px;
}
}
.device-info {
position: absolute;
left: 28%;
top: -14%;
display: flex;
justify-content: center;
justify-items: center;
align-items: center;
align-content: center;
text-align: center;
width: 90px;
.info-img {
position: absolute;
left: 0%;
top: 0%;
}
.text {
color: #fff;
width: 40px;
margin: 0 auto;
margin-top: 30px;
z-index: 1;
line-height: 20px;
}
}
.value-info {
position: absolute;
right: 48%;
top: -10%;
border: 1px solid #00ffec88;
width: 160px;
text-align: right;
padding: 10px 20px;
color: #fff;
border-radius: 5px;
box-shadow: inset 0 0 9px 0px #00ffec40;
}
}
.navgative-panel {
position: absolute;
width: 250px;
height: 250px;
top: 2%;
right: 4%;
color: #fff;
.center {
width: 80px;
height: 80px;
border-radius: 50%;
border: 1px solid #00ffec40;
display: flex;
justify-items: center;
align-items: center;
.center-inner {
width: 70px;
height: 70px;
border-radius: 50%;
border: 1px solid #00ffec40;
text-align: center;
line-height: 70px;
font-size: 1.2rem;
font-weight: bold;
letter-spacing: 2px;
color: #00ffec;
text-shadow: 0px 0px 20px #00ffec;
margin: 0 auto;
}
}
.item {
position: absolute;
background: url("@/assets/images/icon-009.png") 100% 100% no-repeat;
background-size: 100% 100%;
width: 50px;
height: 50px;
text-align: center;
line-height: 50px;
font-size: 0.5rem;
cursor: pointer;
}
item:hover{
color: #00ffec;
}
.item1 {
top: -22%;
}
.item2 {
top: -18%;
right: 61%;
}
.item3 {
top: -5%;
right: 46%;
}
.item4 {
top: 15%;
right: 48%;
}
.item5 {
top: 32%;
right: 57%;
}
.item6 {
top: 35%;
right: 77%;
}
.item7 {
top: 27%;
right: 95%;
}
.item8 {
top: 8%;
right: 101%;
}
.item9 {
top: -12%;
right: 98%;
}
}
}
}
</style>- ChartItem.vue
javascript
<template>
    <div class="chart-item">
        <div class="title">
            <div class="icon">
                <img src="@/assets/images/icon-005.png">
            </div>
            <div class="text">{{ title }}</div>
        </div>
        <slot></slot>
    </div>
</template>
<script setup lang="ts">

const props = defineProps({
    title:String
})
</script>
<style lang="less" scoped>
    .chart-item{
        .title{
            display: flex;
            .icon{
                width:30px;
                text-align: center;
                position: relative;
                top: 2px;
            }
            .text{
                flex: 1;
                color: #fff;
                font-weight: bold;
            }
        }
    }
</style>- Header.vue
javascript
<template>
    <div class="header">
        <div class="left">
            <div class="empty"></div>
            <div class="icon">
                <img src="@/assets/images/icon-010.png">
            </div>
        </div>
        <div class="title">
            智慧城市
        </div>
        <div class="right">
            <div class="icon">
                <img src="@/assets/images/icon-010.png">
            </div>
            <div class="empty">
                <div class="time">
                    {{ time }}
                </div>
                <div class="btns">
                    <el-button type="danger">退出</el-button>
                </div>
            </div>
        </div>
    </div>
</template>
<script lang="ts" setup>
import { onUnmounted, ref } from 'vue';
import dayjs  from 'dayjs'

const time = ref(dayjs(new Date()).format('YYYY-MM-DD HH:mm:ss'));
const timer = setInterval(() => {
    time.value = dayjs(new Date()).format('YYYY-MM-DD HH:mm:ss');
});
onUnmounted(() => {
    clearInterval(timer)
})
</script>
<style lang="less" scoped>
.header {
    display: flex;
    height:60px;

    .left,
    .right {
        flex: 1;
        display: flex;

        .empty {
            width: 10%
        }

        .icon {
            text-align: right;
            flex: 1;

            img {
                position: relative;
                top: 20px
            }
        }
    }

    .right {
        .icon {
            text-align: left;
        }
        .empty{
            width:200px;
            display: flex;

            .time{
                font-size: 0.8rem;
                color: #fff;
                line-height: 60px;
                flex: 1;
            }

            .btns{
                width:80px;
                text-align: center;
                position: relative;
                top: 15px;
            }
        }
    }

    .title {
        width: 400px;
        text-align: center;
        font-size: 1.8rem;
        color: #fff;
        letter-spacing: 4px;
        font-weight: 400;
        line-height: 60px;
        text-shadow: -2px 1px 4px #009688;
    }
}
</style>