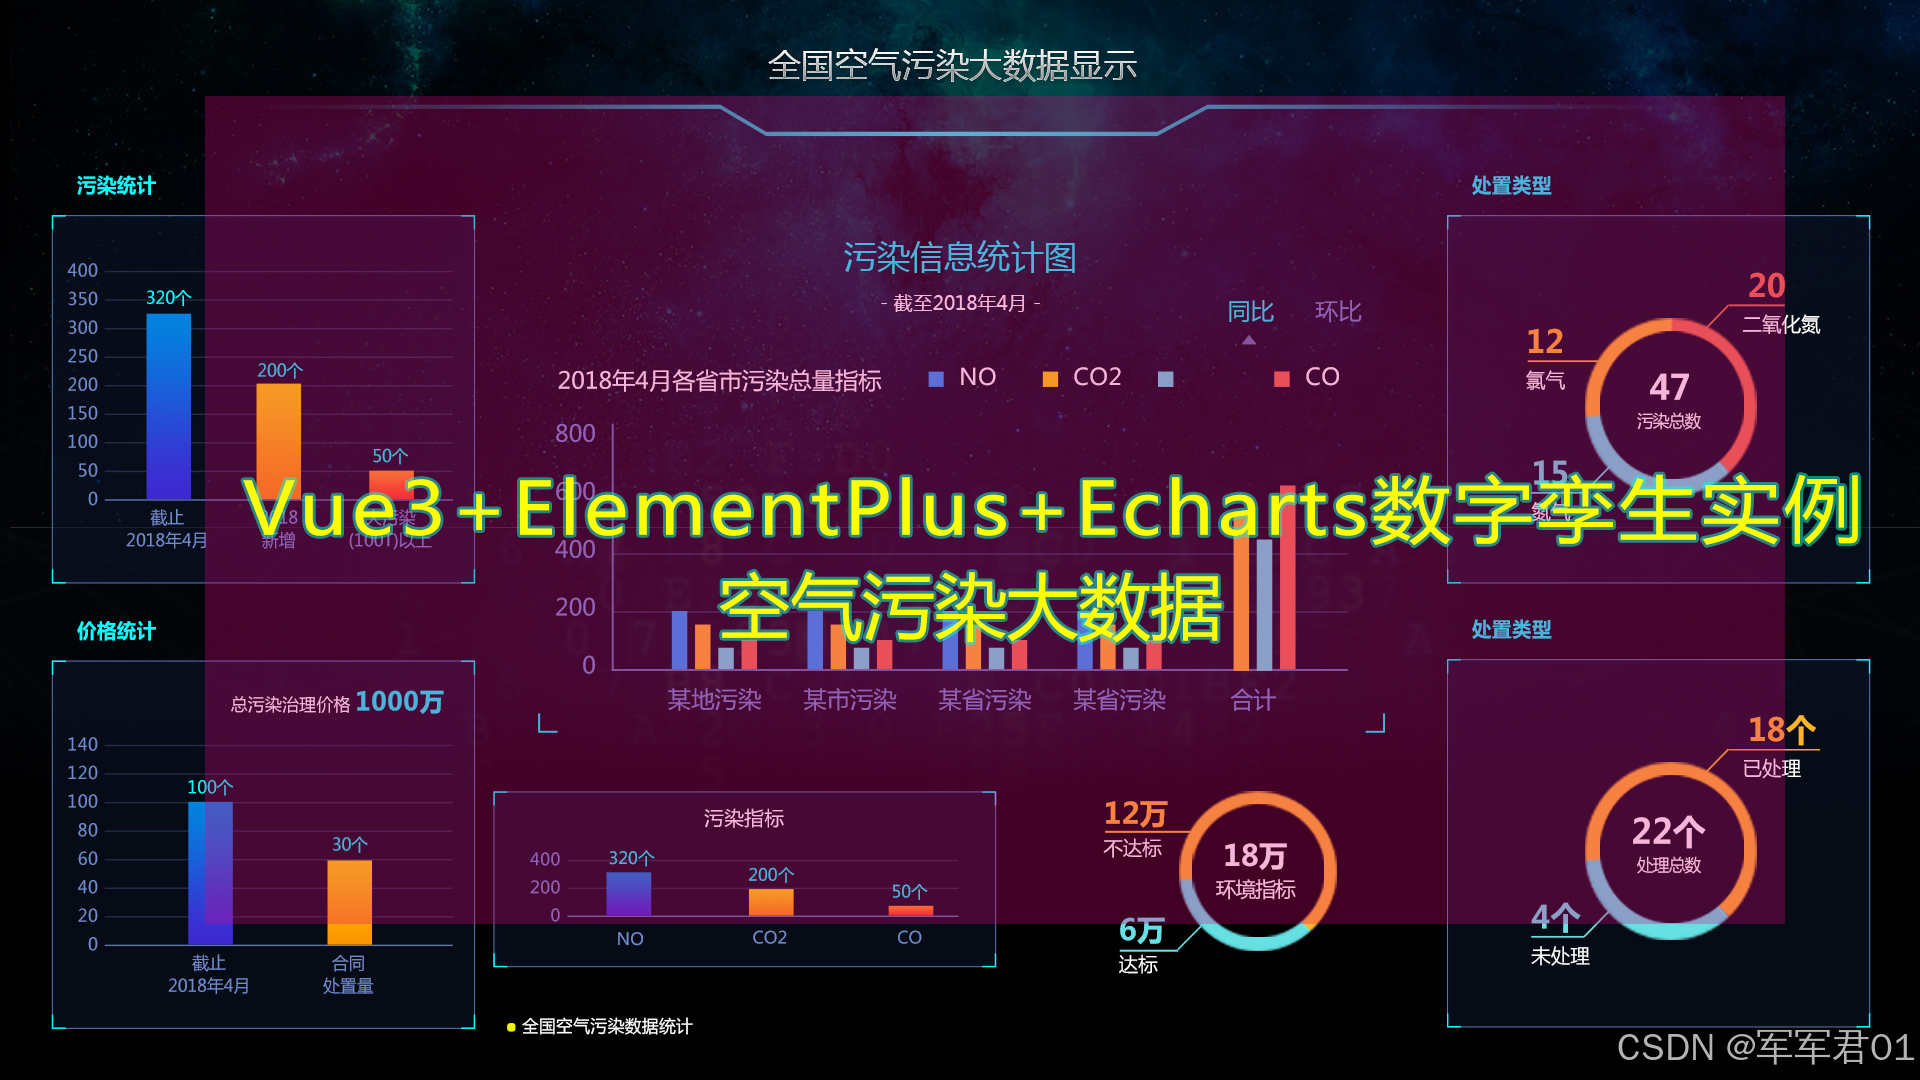
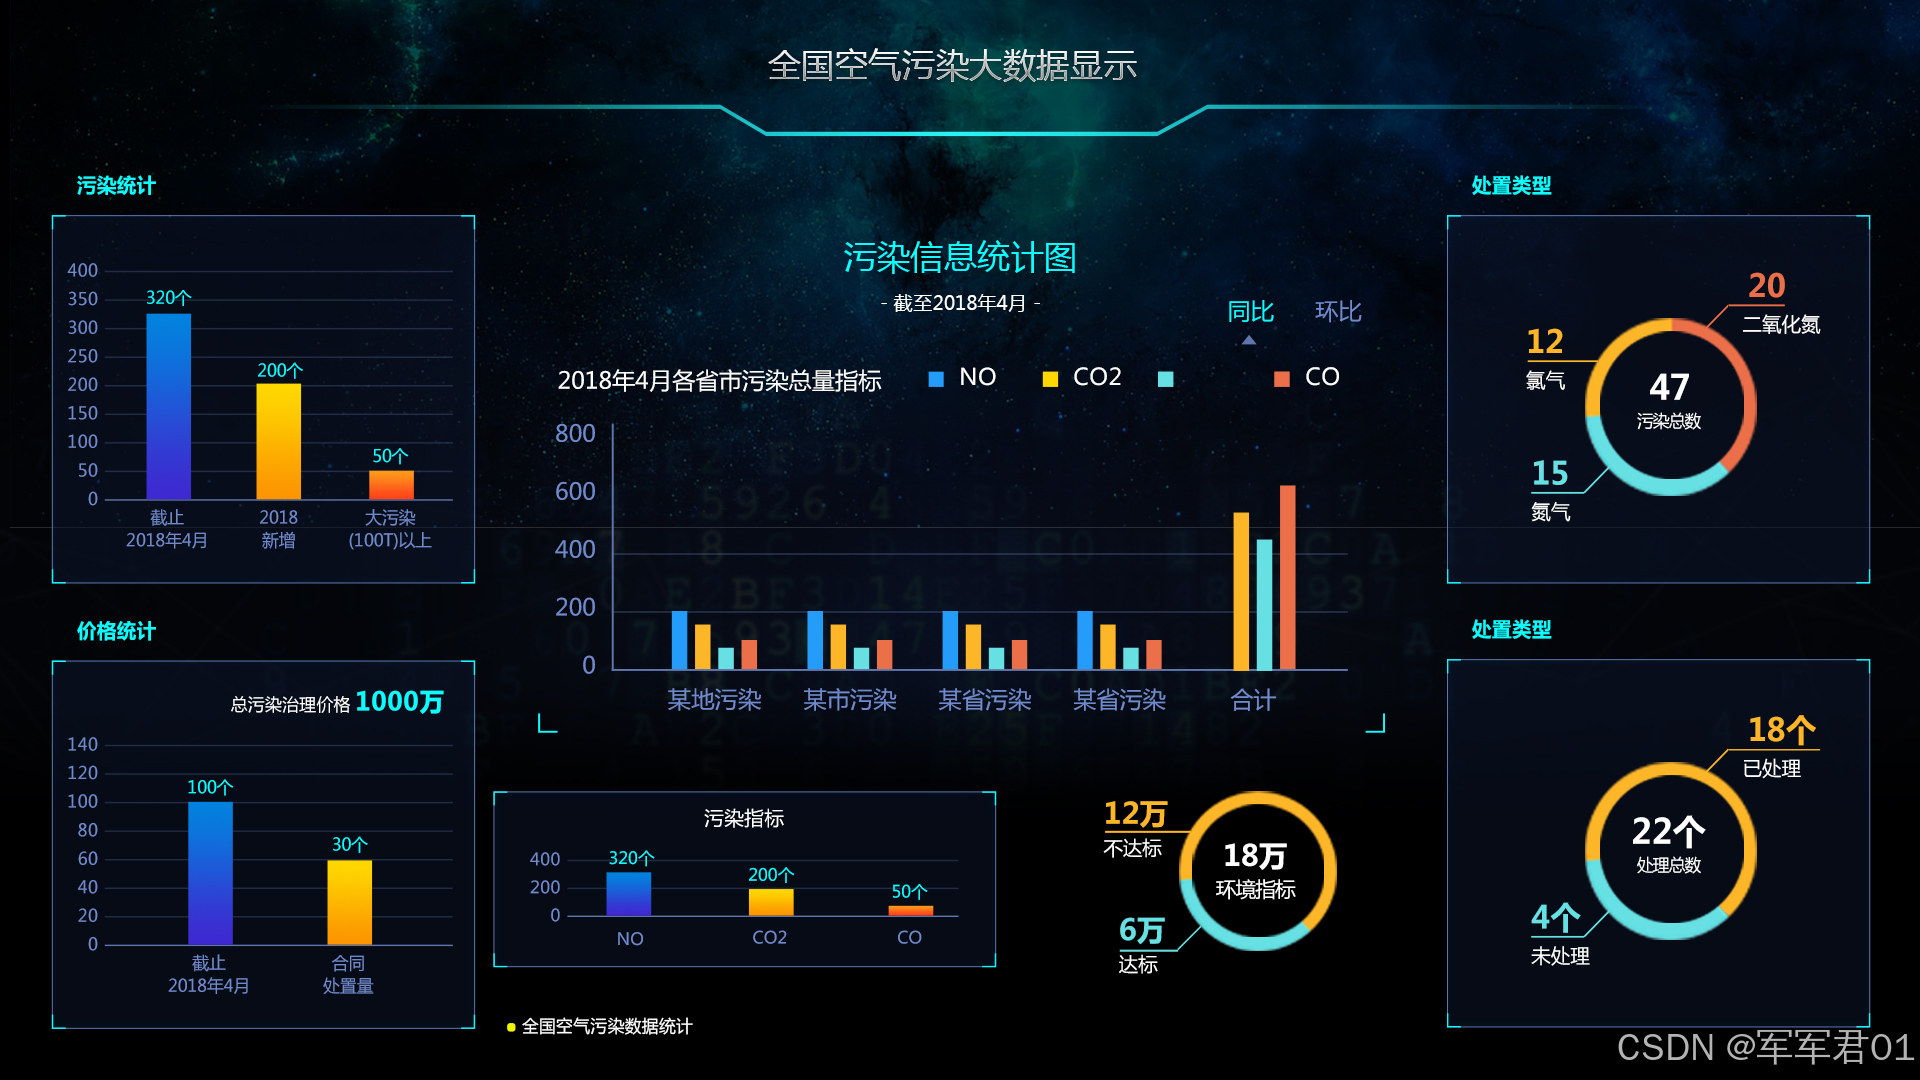
前端数字孪生大屏,使用vue3+Elementplus+Echarts+TS实现智慧城市大屏,数字孪生,监控大屏展示,可下载作为课堂作业、界面模板、扩展开发,个人作品等。
若想系统学习Echarts开发,我的课程提供了完整的Echarts基础知识讲解并附加大量实战案例,系列课程地址如下:
1. CSDN课程:https://edu.csdn.net/course/detail/40842
2. 51学堂课程:https://edu.51cto.com/course/40414.html
3. B站课程:https://www.bilibili.com/cheese/play/ss456500998
一.效果展示:
二.源码下载:
三.开发视频:
https://www.bilibili.com/video/BV1v1Q7BTEqh/
四.实现明细:
4.1 开发环境
使用vscode开发,nodejs版本为v24.11.0,其它项目依赖如下:
1. "dayjs": "^1.11.20"
2. "echarts": "^6.0.0"
3. "element-plus": "^2.13.6"
4. "less": "^4.6.4"
5. "pinia": "^3.0.4"
6. "vue": "^3.5.31"
7. "vue-router": "^5.0.4"
4.2 实现明细
- main.ts
javascript
import { createApp } from 'vue'
import { createPinia } from 'pinia'
import ElementPlus from 'element-plus'
import 'element-plus/dist/index.css'
import App from './App.vue'
import router from './router'
import * as ElementPlusIconsVue from '@element-plus/icons-vue'

const app = createApp(App)

app.use(createPinia())
app.use(router)
app.use(ElementPlus)
for (const [key, component] of Object.entries(ElementPlusIconsVue)) {
  app.component(key, component)
}

app.mount('#app')- App.vue
javascript
<script setup lang="ts"></script>

<template>
  <RouterView></RouterView>
</template>

<style >
@import url("@/assets/main.css");
</style>- HomeView.vue
javascript
<script setup lang="ts">
import Header from '@/components/Header.vue';
import ChartItem from '@/components/ChartItem.vue';
import { onMounted, reactive, ref } from 'vue';
import * as echarts from "echarts"
const pollutionChartRef = ref();
const pollutionChart = ref();
const pollutionChartOptions = reactive({
grid: {
left: '5%',
top: '5%',
right: '5%',
bottom: '5%',
containLabel: true
},
xAxis: {
type: 'category',
data: ['1990', '1991', '1992', '1993', '1994', '1995'],
axisLabel: {
color: '#708acc'
}
},
yAxis: {
type: 'value',
axisLabel: {
color: '#708acc'
},
splitLine: {
lineStyle: {
color: '#6076ad'
}
}
},
series: [
{
data: [{
value: 233,
itemStyle: {
color: {
type: 'linear',
x: 0,
y: 0,
x2: 0,
y2: 1,
colorStops: [{
offset: 0, color: '#0381de' // 0% 处的颜色
}, {
offset: 1, color: '#3f29d0' // 100% 处的颜色
}],
global: false // 缺省为 false
}
}
},{
value: 543,
itemStyle: {
color: {
type: 'linear',
x: 0,
y: 0,
x2: 0,
y2: 1,
colorStops: [{
offset: 0, color: '#fc9701' // 0% 处的颜色
}, {
offset: 1, color: '#fc9701' // 100% 处的颜色
}],
global: false // 缺省为 false
}
}
},{
value: 423,
itemStyle: {
color: {
type: 'linear',
x: 0,
y: 0,
x2: 0,
y2: 1,
colorStops: [{
offset: 0, color: '#fe991a' // 0% 处的颜色
}, {
offset: 1, color: '#fe4a1b' // 100% 处的颜色
}],
global: false // 缺省为 false
}
}
},{
value: 765,
itemStyle: {
color: {
type: 'linear',
x: 0,
y: 0,
x2: 0,
y2: 1,
colorStops: [{
offset: 0, color: '#f5a931' // 0% 处的颜色
}, {
offset: 1, color: '#8f5802' // 100% 处的颜色
}],
global: false // 缺省为 false
}
}
},{
value: 645,
itemStyle: {
color: {
type: 'linear',
x: 0,
y: 0,
x2: 0,
y2: 1,
colorStops: [{
offset: 0, color: '#57ffb6' // 0% 处的颜色
}, {
offset: 1, color: '#009655' // 100% 处的颜色
}],
global: false // 缺省为 false
}
}
},{
value: 645,
itemStyle: {
color: {
type: 'linear',
x: 0,
y: 0,
x2: 0,
y2: 1,
colorStops: [{
offset: 0, color: '#ec6bff' // 0% 处的颜色
}, {
offset: 1, color: '#89009d' // 100% 处的颜色
}],
global: false // 缺省为 false
}
}
}],
type: 'bar',
barWidth:20,
itemStyle:{
borderRadius:20
},
label:{
show:true,
position:'top',
color:'#0efcff'
}
}
]
})
const costChartRef = ref();
const costChart = ref();
const costChartOptions = reactive({
grid: {
left: '5%',
top: '5%',
right: '5%',
bottom: '5%',
containLabel: true
},
xAxis: {
type: 'category',
data: ['1990', '1991', '1992', '1993', '1994'],
axisLabel: {
color: '#708acc'
}
},
yAxis: {
type: 'value',
axisLabel: {
color: '#708acc'
},
splitLine: {
lineStyle: {
color: '#6076ad'
}
}
},
series: [
{
data: [{
value: 233,
itemStyle: {
color: {
type: 'linear',
x: 0,
y: 0,
x2: 0,
y2: 1,
colorStops: [{
offset: 0, color: '#0381de' // 0% 处的颜色
}, {
offset: 1, color: '#3f29d0' // 100% 处的颜色
}],
global: false // 缺省为 false
}
}
},{
value: 543,
itemStyle: {
color: {
type: 'linear',
x: 0,
y: 0,
x2: 0,
y2: 1,
colorStops: [{
offset: 0, color: '#fc9701' // 0% 处的颜色
}, {
offset: 1, color: '#fc9701' // 100% 处的颜色
}],
global: false // 缺省为 false
}
}
},{
value: 765,
itemStyle: {
color: {
type: 'linear',
x: 0,
y: 0,
x2: 0,
y2: 1,
colorStops: [{
offset: 0, color: '#f5a931' // 0% 处的颜色
}, {
offset: 1, color: '#8f5802' // 100% 处的颜色
}],
global: false // 缺省为 false
}
}
},{
value: 423,
itemStyle: {
color: {
type: 'linear',
x: 0,
y: 0,
x2: 0,
y2: 1,
colorStops: [{
offset: 0, color: '#fe991a' // 0% 处的颜色
}, {
offset: 1, color: '#fe4a1b' // 100% 处的颜色
}],
global: false // 缺省为 false
}
}
},{
value: 645,
itemStyle: {
color: {
type: 'linear',
x: 0,
y: 0,
x2: 0,
y2: 1,
colorStops: [{
offset: 0, color: '#ec6bff' // 0% 处的颜色
}, {
offset: 1, color: '#89009d' // 100% 处的颜色
}],
global: false // 缺省为 false
}
}
}],
type: 'bar',
barWidth:20,
itemStyle:{
borderRadius:20
},
label:{
show:true,
position:'top',
color:'#0efcff'
}
}
]
})
const typeChartRef = ref();
const typeChart = ref();
const typeChartOptions = reactive({
tooltip: {
trigger: 'item'
},
title:{
text:'34',
subtext:'污染总数',
left:'center',
top:'44%',
textStyle:{
color:'#fff',
fontSize:24,
lineHeight:20
},
subtextStyle:{
color:'#fff',
fontSize:18,
lineHeight:20
},
},
series: [
{
name: '污染总数',
type: 'pie',
radius: ['40%', '60%'],
avoidLabelOverlap: false,
label: {
show: true,
textStyle:{
color:'inherit'
}
},
labelLine: {
show: true
},
data: [
{ value: 1048, name: '氮气' },
{ value: 735, name: '氯气' },
{ value: 580, name: '二氧化碳' },
{ value: 484, name: '封尘' },
{ value: 300, name: '甲烷' }
]
}
]
})
const countChartRef = ref();
const countChart = ref();
const countChartOptions = reactive({
tooltip: {
trigger: 'item'
},
title:{
text:'54',
subtext:'处理数量',
left:'center',
top:'44%',
textStyle:{
color:'#fff',
fontSize:24,
lineHeight:20
},
subtextStyle:{
color:'#fff',
fontSize:18,
lineHeight:20
},
},
series: [
{
name: '处理数量',
type: 'pie',
radius: ['40%', '60%'],
avoidLabelOverlap: false,
label: {
show: true,
textStyle:{
color:'inherit'
}
},
labelLine: {
show: true
},
data: [
{ value: 1048, name: '已处理' },
{ value: 735, name: '未处理' }
]
}
]
})
const areaChartRef = ref();
const areaChart = ref();
const areaChartOptions = reactive({
grid: {
left: '2%',
top: '15%',
right: '1%',
bottom: '5%',
containLabel: true
},
title:{
text:'污染信息统计图',
subtext:'截止1000年2月',
left:'center',
top:'2%',
textStyle:{
color:'#0efcff',
fontSize:24,
lineHeight:20
},
subtextStyle:{
color:'#fff',
fontSize:18,
lineHeight:20
},
},
legend: {
left:'right',
top:'5%',
textStyle:{
color:'#fff'
}
},
xAxis: {
type: 'category',
data: ['A省', 'B省', 'C省', 'D省', 'E省', 'F省'],
axisLabel: {
color: '#708acc'
}
},
yAxis: {
type: 'value',
axisLabel: {
color: '#708acc'
},
splitLine: {
lineStyle: {
color: '#6076ad'
}
}
},
series: [
{
name:'二氧化碳',
data: [434,465,767,342,764,433],
type: 'bar',
barWidth:20,
itemStyle:{
borderRadius:20
},
label:{
show:true,
position:'top',
color:'#0efcff'
}
},{
name:'氯气',
data: [876,543,543,766,232,343],
type: 'bar',
barWidth:20,
itemStyle:{
borderRadius:20
},
label:{
show:true,
position:'top',
color:'#0efcff'
}
},{
name:'一氧化碳',
data: [963,675,754,455,356,232],
type: 'bar',
barWidth:20,
itemStyle:{
borderRadius:20
},
label:{
show:true,
position:'top',
color:'#0efcff'
}
},{
name:'粉尘',
data: [546,324,323,765,432,655],
type: 'bar',
barWidth:20,
itemStyle:{
borderRadius:20
},
label:{
show:true,
position:'top',
color:'#0efcff'
}
}
]
})
const targetChartRef = ref();
const targetChart = ref();
const targetChartOptions =reactive({
title:{
text:'污染指标',
left:'center',
top:'5%',
textStyle:{
color:'#fff'
}
},
grid: {
left: '5%',
top: '20%',
right: '5%',
bottom: '5%',
containLabel: true
},
xAxis: {
type: 'category',
data: ['1990', '1991', '1992', '1993', '1994', '1995'],
axisLabel: {
color: '#708acc'
}
},
yAxis: {
type: 'value',
axisLabel: {
color: '#708acc'
},
splitLine: {
lineStyle: {
color: '#6076ad'
}
}
},
series: [
{
data: [{
value: 233,
itemStyle: {
color: {
type: 'linear',
x: 0,
y: 0,
x2: 0,
y2: 1,
colorStops: [{
offset: 0, color: '#0381de' // 0% 处的颜色
}, {
offset: 1, color: '#3f29d0' // 100% 处的颜色
}],
global: false // 缺省为 false
}
}
},{
value: 543,
itemStyle: {
color: {
type: 'linear',
x: 0,
y: 0,
x2: 0,
y2: 1,
colorStops: [{
offset: 0, color: '#fc9701' // 0% 处的颜色
}, {
offset: 1, color: '#fc9701' // 100% 处的颜色
}],
global: false // 缺省为 false
}
}
},{
value: 423,
itemStyle: {
color: {
type: 'linear',
x: 0,
y: 0,
x2: 0,
y2: 1,
colorStops: [{
offset: 0, color: '#fe991a' // 0% 处的颜色
}, {
offset: 1, color: '#fe4a1b' // 100% 处的颜色
}],
global: false // 缺省为 false
}
}
},{
value: 765,
itemStyle: {
color: {
type: 'linear',
x: 0,
y: 0,
x2: 0,
y2: 1,
colorStops: [{
offset: 0, color: '#f5a931' // 0% 处的颜色
}, {
offset: 1, color: '#8f5802' // 100% 处的颜色
}],
global: false // 缺省为 false
}
}
},{
value: 645,
itemStyle: {
color: {
type: 'linear',
x: 0,
y: 0,
x2: 0,
y2: 1,
colorStops: [{
offset: 0, color: '#57ffb6' // 0% 处的颜色
}, {
offset: 1, color: '#009655' // 100% 处的颜色
}],
global: false // 缺省为 false
}
}
},{
value: 645,
itemStyle: {
color: {
type: 'linear',
x: 0,
y: 0,
x2: 0,
y2: 1,
colorStops: [{
offset: 0, color: '#ec6bff' // 0% 处的颜色
}, {
offset: 1, color: '#89009d' // 100% 处的颜色
}],
global: false // 缺省为 false
}
}
}],
type: 'bar',
barWidth:20,
itemStyle:{
borderRadius:20
},
label:{
show:true,
position:'top',
color:'#0efcff'
}
}
]
})
const scopeChartRef =ref();
const scopeChart = ref();
const scopeChartOptions = reactive({
tooltip: {
trigger: 'item'
},
title:{
text:'65',
subtext:'环境指数',
left:'center',
top:'44%',
padding:0,
textStyle:{
color:'#fff',
fontSize:16,
lineHeight:10
},
subtextStyle:{
color:'#fff',
fontSize:14,
lineHeight:10
},
},
series: [
{
name: '环境指数',
type: 'pie',
radius: ['30%', '50%'],
avoidLabelOverlap: false,
label: {
show: true,
textStyle:{
color:'inherit'
}
},
labelLine: {
show: true
},
data: [
{ value: 1048, name: '达标' },
{ value: 735, name: '不达标' },
]
}
]
})
onMounted(() => {
pollutionChart.value = echarts.init(pollutionChartRef.value);
pollutionChart.value.setOption(pollutionChartOptions);
costChart.value = echarts.init(costChartRef.value);
costChart.value.setOption(costChartOptions);
typeChart.value = echarts.init(typeChartRef.value);
typeChart.value.setOption(typeChartOptions);
countChart.value = echarts.init(countChartRef.value);
countChart.value.setOption(countChartOptions);
areaChart.value = echarts.init(areaChartRef.value);
areaChart.value.setOption(areaChartOptions);
targetChart.value = echarts.init(targetChartRef.value);
targetChart.value.setOption(targetChartOptions);
scopeChart.value = echarts.init(scopeChartRef.value);
scopeChart.value.setOption(scopeChartOptions);
})
</script>
<template>
<div class="page">
<Header></Header>
<el-row>
<el-col :span="6">
<ChartItem title="污染统计">
<div class="chart-panel" ref="pollutionChartRef"></div>
</ChartItem>
<ChartItem title="价格统计">
<div class="chart-panel" ref="costChartRef"></div>
</ChartItem>
</el-col>
<el-col :span="12">
<ChartItem title="" >
<div class="chart-panel-1" ref="areaChartRef"></div>
</ChartItem>
<el-row>
<el-col :span="16">
<ChartItem title="" >
<div class="chart-panel-2" ref="targetChartRef"></div>
</ChartItem>
</el-col>
<el-col :span="8">
<ChartItem title="" >
<div class="chart-panel-2" ref="scopeChartRef"></div>
</ChartItem>
</el-col>
</el-row>
</el-col>
<el-col :span="6">
<ChartItem title="处置类型">
<div class="chart-panel" ref="typeChartRef"></div>
</ChartItem>
<ChartItem title="处置数量">
<div class="chart-panel" ref="countChartRef"></div>
</ChartItem>
</el-col>
</el-row>
</div>
</template>
<style lang="less" scoped>
.page {
width: 100vw;
height: 100vh;
;
background: url(@/assets/images/bg.jpg);
background-size: 100% 100%;
.chart-panel {
height: calc((100vh - 160px) / 2);
}
.chart-panel-1{
height: calc((100vh - 160px) / 2 + 20vh);
}
.chart-panel-2{
height: calc((100vh - 160px) / 2 - 14.5vh);
}
}
</style>- router/index.ts
javascript
import HomeView from '@/views/HomeView.vue'
import { createRouter, createWebHistory } from 'vue-router'

const router = createRouter({
  history: createWebHistory(import.meta.env.BASE_URL),
  routes: [{
    path:'',
    component:HomeView
  }],
})

export default router- Header.vue
javascript
<template>
    <div class="header">
      <img src="@/assets/images/icon-001.png">
      <div class="title">
        空气污染大数据
      </div>
    </div>
</template>
<script setup lang="ts">
</script>
<style lang="less" scoped>
    .header{
        height: 60px;
        position: relative;
        display: flex;
        line-height: 60px;
        text-align: center;

        img{
            position: absolute;
            left: calc((100vw - 1436px) /2);
            bottom: 0;
        }
        .title{
            flex:1;
            font-size: 1.8rem;
            color: #fff;
            letter-spacing: 5px;
        }
    }
</style>- ChartItem.vue
javascript
<template>
    <div class="chart-item">
        <div class="title" v-if="title">
            <div class="icon">
                <el-icon><CaretRight /></el-icon>
            </div>
            <div class="text">{{ title }}</div>
        </div>
        <div class="content">
            <div class="left-top-1"></div>
            <div class="left-top-2"></div>

            <div class="left-bottom-1"></div>
            <div class="left-bottom-2"></div>

            <div class="right-top-1"></div>
            <div class="right-top-2"></div>

            <div class="right-bottom-1"></div>
            <div class="right-bottom-2"></div>

            <slot></slot>
        </div>
    </div>
</template>
<script setup lang="ts">
    const props = defineProps({
        title:String
    })
</script>
<style lang="less" scoped>
    .chart-item{
        margin: 10px;

        .title{
            line-height: 30px;
            color: #0efcff;
            display: flex;
            .icon{
                position: relative;
                top:2px
            }
            .text{
                flex:1;
                margin-left: 5px;
            }
        }
        .content{
            position: relative;
            border:1px solid #6076ad;
            background: #0b152c55;
            .left-top-1{
                position: absolute;
                width:10px;
                height: 3px;
                top:-1px;
                left:0px;
                background: #0efcff;
            }
            .left-top-2{
                position: absolute;
                height:10px;
                width: 3px;
                left:-1px;
                top:0px;
                background: #0efcff;
            }
            .left-bottom-1{
                position: absolute;
                width:10px;
                height: 3px;
                bottom:-1px;
                left:0px;
                background: #0efcff;
            }
            .left-bottom-2{
                position: absolute;
                height:10px;
                width: 3px;
                left:-1px;
                bottom:0px;
                background: #0efcff;
            }
            .right-top-1{
                position: absolute;
                width:10px;
                height: 3px;
                top:-1px;
                right:0px;
                background: #0efcff;
            }
            .right-top-2{
                position: absolute;
                height:10px;
                width: 3px;
                right:-1px;
                top:0px;
                background: #0efcff;
            }
            .right-bottom-1{
                position: absolute;
                width:10px;
                height: 3px;
                bottom:-1px;
                right:0px;
                background: #0efcff;
            }
            .right-bottom-2{
                position: absolute;
                height:10px;
                width: 3px;
                right:-1px;
                bottom:0px;
                background: #0efcff;
            }
        }
    }
</style>- base.css
javascript
/* color palette from <https://github.com/vuejs/theme> */
:root {
  --vt-c-white: #ffffff;
  --vt-c-white-soft: #f8f8f8;
  --vt-c-white-mute: #f2f2f2;

  --vt-c-black: #181818;
  --vt-c-black-soft: #222222;
  --vt-c-black-mute: #282828;

  --vt-c-indigo: #2c3e50;

  --vt-c-divider-light-1: rgba(60, 60, 60, 0.29);
  --vt-c-divider-light-2: rgba(60, 60, 60, 0.12);
  --vt-c-divider-dark-1: rgba(84, 84, 84, 0.65);
  --vt-c-divider-dark-2: rgba(84, 84, 84, 0.48);

  --vt-c-text-light-1: var(--vt-c-indigo);
  --vt-c-text-light-2: rgba(60, 60, 60, 0.66);
  --vt-c-text-dark-1: var(--vt-c-white);
  --vt-c-text-dark-2: rgba(235, 235, 235, 0.64);
}

/* semantic color variables for this project */
:root {
  --color-background: var(--vt-c-white);
  --color-background-soft: var(--vt-c-white-soft);
  --color-background-mute: var(--vt-c-white-mute);

  --color-border: var(--vt-c-divider-light-2);
  --color-border-hover: var(--vt-c-divider-light-1);

  --color-heading: var(--vt-c-text-light-1);
  --color-text: var(--vt-c-text-light-1);

  --section-gap: 160px;
}

@media (prefers-color-scheme: dark) {
  :root {
    --color-background: var(--vt-c-black);
    --color-background-soft: var(--vt-c-black-soft);
    --color-background-mute: var(--vt-c-black-mute);

    --color-border: var(--vt-c-divider-dark-2);
    --color-border-hover: var(--vt-c-divider-dark-1);

    --color-heading: var(--vt-c-text-dark-1);
    --color-text: var(--vt-c-text-dark-2);
  }
}

*,
*::before,
*::after {
  box-sizing: border-box;
  margin: 0;
  font-weight: normal;
}

body {
  padding: 0px;
  margin: 0px;
  color: var(--color-text);
  background: var(--color-background);
  transition:
    color 0.5s,
    background-color 0.5s;
  line-height: 1.6;
  font-family:
    Inter,
    -apple-system,
    BlinkMacSystemFont,
    'Segoe UI',
    Roboto,
    Oxygen,
    Ubuntu,
    Cantarell,
    'Fira Sans',
    'Droid Sans',
    'Helvetica Neue',
    sans-serif;
  font-size: 15px;
  text-rendering: optimizeLegibility;
  -webkit-font-smoothing: antialiased;
  -moz-osx-font-smoothing: grayscale;
}- main.css
javascript
@import './base.css';

#app {
  font-weight: normal;
}

a,
.green {
  text-decoration: none;
  color: hsla(160, 100%, 37%, 1);
  transition: 0.4s;
  padding: 0px;
}

@media (hover: hover) {
  a:hover {
    background-color: hsla(160, 100%, 37%, 0.2);
  }
}

@media (min-width: 1024px) {
  body {
  }

  #app {
  }
}