传统 Perfetto 使用方式的局限
用过 Perfetto 的人都懂这个流程:
adb shell perfetto -c - --txt采集 trace- 打开 ui.perfetto.dev,拖入
.pb文件 - 在花花绿绿的时间轴上找红色帧(jank)
- 人肉点开每个 slice,看调用栈,猜问题
这个流程最大的痛点是:你看到了问题,但不知道为什么。
一个卡顿帧,Perfetto 告诉你 dispatchLayoutStep2 耗时 229ms。然后呢?你得手动搜源码、对方法名、看上下文,才能定位到 DemoAdapter.onBindViewHolder 里那个主线程做了 100000 次 Math.sqrt() 的 for 循环。
而且这是分析一个帧的成本。如果你的 trace 里有 50 个 jank 帧,你得重复 50 次。
设计思路:不重新造轮子
我做了个决定:不自己画 UI。
Perfetto UI 已经是最好的 trace 可视化工具------时间轴、slice 展开、SQL 查询面板、帧分析视图,该有的都有。重做一个没意义。
但 Perfetto UI 支持自定义插件(TypeScript)。所以方案很清晰:
arduino
自托管 Perfetto UI + SI Bridge 插件 + WebSocket 桥接回 Python 后端用户框选时间范围 → 插件拿到 ts 和 dur → 通过 WebSocket 发给 Python 后端 → 后端调用 frame_analyzer agent → 结果回传 Perfetto UI 展示。
scss
用户框选时间范围 → SI Bridge Plugin (TypeScript)
    → WebSocket → BridgeServer (Python)
    → frame_analyzer agent → 结果回传 Perfetto UI
这样用户不需要离开 Perfetto UI,不需要复制粘贴任何数据,框选即分析。
插件实现:SI Bridge Plugin
插件的核心就三件事:注册面板、监听框选、WebSocket 通信。
用 Perfetto 的 registerAreaSelectionTab API 注册一个右侧面板。用户在时间轴上拖选一段范围后,面板自动显示选中区域的时间信息:
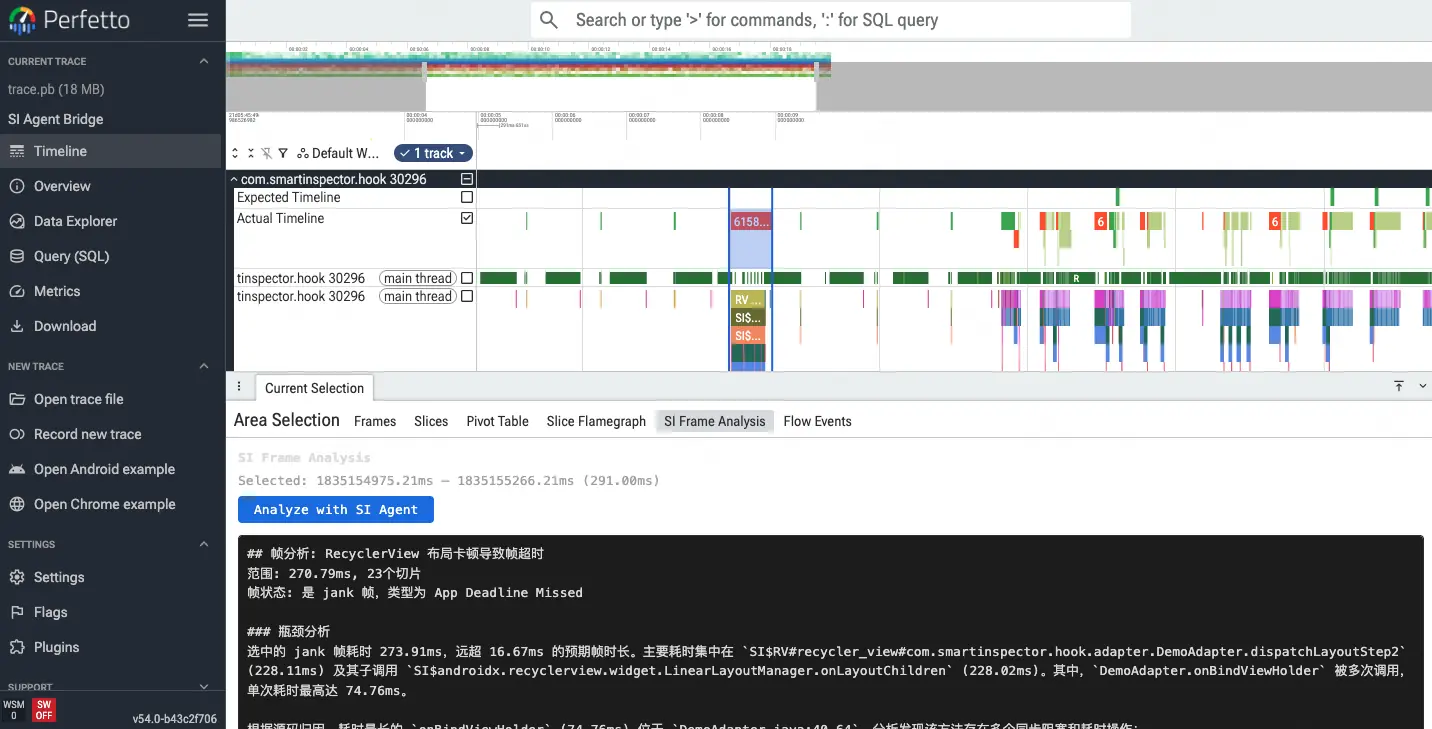 用户在时间轴上拖选一段范围后,面板自动显示选中区域的时间信息:
typescript
// perfetto-plugin/com.smartinspector.Bridge/index.ts

export default class SIBridgePlugin implements PerfettoPlugin {
  static readonly id = 'com.smartinspector.Bridge';

  async onTraceLoad(trace: Trace): Promise<void> {
    connectWS();

    trace.selection.registerAreaSelectionTab({
      id: 'si_frame_analysis',
      name: 'SI Frame Analysis',
      render: (selection) => renderAreaSelectionTab(selection),
    });

    // 快捷键 Ctrl+Shift+A
    trace.commands.registerCommand({
      id: 'com.smartinspector.Bridge#analyzeSelection',
      name: 'SI Agent: Analyze Selected Area',
      callback: () => { /* ... */ },
    });
  }
}
用户点击 "Analyze with SI Agent" 按钮后,插件通过 WebSocket 把 ts(纳秒时间戳)和 dur(纳秒持续时间)发给后端:
typescript
function sendAnalysis(ts: number, dur: number): void {
  if (!ws || ws.readyState !== WebSocket.OPEN) {
    state.status = 'error';
    state.error = 'SI Agent not connected. Is /open running?';
    return;
  }

  state.status = 'analyzing';
  state.progressLog = ['Sending to SI Agent...'];

  ws.send(JSON.stringify({
    type: 'frame_selected',
    payload: {ts, dur},
  }));
}
插件还有个断线自动重连机制------3 秒一次。因为 Perfetto UI 页面刷新或后端重启时,连接会断:
typescript
ws.onclose = () => {
  console.log('[SI Bridge] Disconnected, reconnecting in 3s...');
  ws = null;
  reconnectTimer = setTimeout(connectWS, 3000);
};
BridgeServer:WebSocket 桥接层
插件运行在浏览器里,但分析逻辑在 Python 后端。中间需要一个桥接服务。
BridgeServer 用 websockets 库实现,干两件事:静态文件服务 (Perfetto UI 的 HTML/JS/WASM)和 WebSocket 桥接 (/bridge 端点)。
python
# src/smartinspector/ws/bridge_server.py

class BridgeServer:
    def __init__(self, port=9877, on_frame_selected=None, trace_path=None):
        self.port = port
        self.on_frame_selected = on_frame_selected
        self.trace_path = trace_path

    async def _ws_handler(self, ws):
        self._ws_clients.add(ws)
        async for raw in ws:
            msg = json.loads(raw)
            if msg.get("type") == "frame_selected":
                await self._handle_frame_selected(ws, msg["payload"])

    async def _handle_frame_selected(self, ws, payload):
        ts = payload.get("ts", 0)
        dur = payload.get("dur", 0)

        async def send_progress(step, detail=""):
            await ws.send(json.dumps({
                "type": "analysis_progress",
                "payload": {"step": step, "detail": detail},
            }))

        # 调用 frame_analyzer agent
        result = await self.on_frame_selected(payload, send_progress)

        await ws.send(json.dumps({
            "type": "analysis_result",
            "payload": result,
        }))
这里有个细节:分析过程可能要 10-30 秒(查询 trace + 源码归因 + LLM 分析),如果用户等这么久看不到任何反馈会很焦虑。所以加了 send_progress 回调,每一步都把进度推给前端:
ini
Sending to SI Agent...
  [frame] 查询 trace 切片 (ts=123456, dur=789012)...
  [frame] 找到 15 切片, 3 帧
  [attributor] Found 4 slices, searching source code...
    145.23ms  DemoAdapter.onBindViewHolder  (java)
    32.10ms   ImageLoader.execute  (java)
  [attributor] Done: 3 attributed, 1 system classes
  [frame] 调用 LLM 分析...
这些进度日志会实时显示在 Perfetto UI 右侧面板里。
另外 BridgeServer 还做了个巧妙的设计:用 /trace.pb 路由自动加载 trace 文件。Perfetto UI 支持 ?url= 参数自动加载远端 trace,所以 /open 命令打开的 URL 是:
perl
http://127.0.0.1:9877/#!/?url=http://127.0.0.1:9877/trace.pb用户不需要手动拖文件了。
frame_analyzer Agent:框选即分析
这是核心分析逻辑。输入就是用户框选的 ts_ns 和 dur_ns(纳秒),输出是一份 Markdown 分析报告。
处理流程:
python
# src/smartinspector/agents/frame_analyzer.py

def analyze_frame(trace_path, ts_ns, dur_ns, existing_summary="",
                  cached_attribution="", on_progress=None) -> str:
    # 1. 查询 trace 切片
    frame_data = query_frame_slices(trace_path, ts_ns, dur_ns)

    # 2. 构建确定性预计算结论(不让 LLM 算数)
    hints = _build_frame_hints(frame_data, existing_summary)

    # 3. 对 SI$ 切片做源码归因
    source_section = _run_source_attribution(
        frame_data, existing_summary, cached_attribution, on_progress
    )

    # 4. LLM 组织最终报告
    response = llm.invoke([SystemMessage(content=prompt), HumanMessage(content=user_content)])
    return response.content
确定性预计算:不让 LLM 算数
_build_frame_hints 做的是确定性预计算------根据帧预算(16.67ms)自动分类严重度等级:
python
p0_threshold = frame_budget_ms  # 通常 16.67ms
for s in si_slices:
    sdur = s["dur_ms"]
    if sdur > p0_threshold:
        level = "P0"    # 超过一帧预算
    elif sdur >= p0_threshold * 0.25:
        level = "P1"    # 占帧预算 25%+
    else:
        level = "P2"    # 轻微
这些结论直接以结构化文本的形式喂给 LLM,LLM 只需要"组织语言",不需要判断"145ms 算不算严重卡顿"。
源码归因:从 SI$ 切片到源码行号
_run_source_attribution 从框选范围里提取 SI$ 前缀的 trace 切片,走三步搜索:
- Glob :搜索包含类名的文件(
DemoAdapter.java) - Grep:在文件中搜索方法签名,定位行号
- Read:读取方法体,LLM 分析具体问题
系统类(android.*、androidx.*)会被自动过滤掉。
还有个优化:如果用户先跑了 /full(全量分析),归因结果会被缓存。框选分析时直接复用,只对新出现的 slice 做搜索,省掉重复的源码检索开销。
实时进度推送
整个分析过程通过 on_progress 回调逐步推送:
python
if on_progress:
    on_progress(f"  [frame] 查询 trace 切片 (ts={ts_ns}, dur={dur_ns})...")
# ... 查询 ...
if on_progress:
    on_progress(f"  [frame] 找到 {n_slices} 切片, {n_frames} 帧")
# ... 归因 ...
if on_progress:
    on_progress(f"  [attributor] Found {len(attributable)} slices, searching source code...")
这些消息通过 WebSocket → 插件 → Perfetto UI 面板,实时显示给用户。
构建和部署
构建过程封装在 perfetto-plugin/build.sh 里,5 步搞定:
bash
#!/usr/bin/env bash
# Step 1: Clone Perfetto 仓库(shallow clone)
git clone --depth 1 https://github.com/google/perfetto.git perfetto-build/

# Step 2: 复制插件到 Perfetto 插件目录
cp -r perfetto-plugin/com.smartinspector.Bridge perfetto-build/ui/src/plugins/

# Step 3: 注册到 default_plugins.ts
# 在默认插件列表中加入 'com.smartinspector.Bridge'

# Step 4: 编译(含依赖安装 + TypeScript 编译 + WASM)
cd perfetto-build && ui/build

# Step 5: 产物输出到 perfetto-build/ui/out/dist/
第一次编译大概 5 分钟(要下载 npm 依赖 + 编译 WASM)。后续改了插件代码,用 --skip-clone 只需 1-2 分钟。
使用时在 SmartInspector CLI 里输入 /open:
csharp
you> /open
  [bridge] Starting trace_processor_shell on :9001...
  [bridge] Server ready on :9877
  Opening Perfetto UI: http://127.0.0.1:9877/#!/?url=http://127.0.0.1:9877/trace.pb

  Trace will load automatically. Then:
    1. Drag to select a time range on the timeline
    2. Click 'SI Frame Analysis' tab in the details panel
    3. Click 'Analyze with SI Agent'
浏览器自动打开,trace 自动加载,插件自动连接。
对比:交互式 vs 全量分析
SmartInspector 有两种分析模式,互补而非替代:
/full(全量分析) |
/open(交互分析) |
|
|---|---|---|
| 触发方式 | CLI 命令 | Perfetto UI 框选 |
| 分析范围 | 整个 trace | 用户选中的时间范围 |
| 适用场景 | 第一次看 trace,不知道问题在哪 | 已经定位了大致区域,想深入分析 |
| 源码归因 | 全量扫描 | 只扫描选中范围的 SI$ 切片 |
| 输出 | 完整 Markdown 报告文件 | 面板内嵌报告 |
典型工作流:先跑 /full 看全局,发现某个时间段有问题,再 /open 打开 Perfetto UI,框选那段区域做定点分析。
也可以直接用 /frame ts=X dur=Y 在 CLI 里指定时间范围分析,不依赖 UI。
小结
给 Perfetto UI 加 AI 分析能力,核心思路就三个字:不造轮子。
Perfetto 已经是最好的 trace 可视化工具了,我要做的是把 AI 分析能力无缝嵌入它------通过 TypeScript 插件注册面板、WebSocket 桥接 Python 后端、frame_analyzer agent 处理分析逻辑。
最终效果:用户在 Perfetto 时间轴上框选一段卡顿,点一个按钮,AI 帮你查切片、搜源码、定位到行号、给出优化建议。整个过程不需要离开 Perfetto UI。
下篇我们聊聊 SmartInspector 最核心的技术------SI$ Tag 归因体系:怎么通过运行时 Hook 给每个业务方法调用贴上"GPS 坐标",让 trace 数据从"看不懂"变成"看到源码行号"。
开源地址 :github.com/mufans/Smar...(示例,以实际地址为准) 系列回顾: