前言
在工业测量、数据可视化、信号处理等领域,我们经常面临这样的问题:原始数据点太多,无法直接用于绘图或传输,但又要保留数据的关键特征(极值、趋势)。
分享一个我在实际项目中优化的降采样算法,最终实现了 内存占用从 3000B 降至 12B(减少 99.6%),同时将遍历次数从 2 次降为 1 次。
一、问题背景
工业传感器每秒可能产生上万甚至更多的数据点:
传感器数据流:10000 点/秒
绘图显示:    500 点(屏幕分辨率限制)
网络传输:    1000 点(带宽限制)
核心需求 :从 N 个点中提取 M 个点(M << N),同时保留每个区间的最大值和最小值,确保原始曲线的形状不失真。
二、Max-Min 降采样原理
2.1 核心思想
将 X 轴均匀划分为若干区间(桶),每个桶记录该区间内的最大值 和最小值:
原始数据(10000点):
●●●●●●●●●●●●●●●●●●●●●●●●●●●●●●●●●●●●●●●●●●●●●●●●●●●●●●●●●●●●●●●●●●●●●●●●●●●●●

划分桶(每个桶2000点):
[桶0 ●●●●] [桶1 ●●●●] [桶2 ●●●●] [桶3 ●●●●] [桶4 ●●●●]

每个桶提取极值:
[min,max] [min,max] [min,max] [min,max] [min,max]

结果(10点):
▲▼▲▼▲▼▲▼▲▼
2.2 算法流程
- 计算 X 轴范围 :
range = x_max - x_min - 计算缩放因子 :
scale = bucket_count / range - 遍历数据:将每点分配到对应桶,记录极值索引
- 输出结果:按 X 轴顺序输出每个桶的 min 和 max
三、迭代优化历程
3.1 v1.0:初版实现
cpp
// 桶结构:存储值和坐标
struct Bucket {
    double minVal{0.0};
    double maxVal{0.0};
    double minX{0.0};
    double maxX{0.0};
    bool hasData{false};
};

std::vector<Bucket> buckets(target_width / 2);  // 预分配桶数组

// 两次遍历
for (const auto& point : data) {           // 第一次:填桶
    // 计算桶索引,更新极值...
}
for (const auto& b : buckets) {            // 第二次:输出
    if (b.hasData) output(b);
}问题:
- 内存占用大:
bucket结构体 40 字节 - 遍历两次:O(2N)
3.2 v2.0:存索引代替存值
cpp
// 桶结构:只存索引
struct Bucket {
    int minIdx{0};
    int maxIdx{0};
    bool hasData{false};
};

// 比较时通过索引访问
if (y < data[b.minIdx].y) {
    b.minIdx = i;
}改进:
- 内存减少:40B → 12B(减少 70%)
- 数据一致性保证:始终从原始数据读取
3.3 v3.0:去掉 buckets 数组(最终版)
cpp
// 只用 3 个变量记录当前桶状态
int cur_bucket = -1;
int min_idx = 0;
int max_idx = 0;

// 桶结束时输出
auto flush_bucket = [&](int bucket_idx) {
    const auto& p_min = data[min_idx];
    const auto& p_max = data[max_idx];
    result.push_back(p_min.x <= p_max.x ? p_min : p_max);
    result.push_back(p_min.x <= p_max.x ? p_max : p_min);
};

// 单次遍历,边读边输出
for (int i = 0; i < data.size(); ++i) {
    int bucket_idx = calc_bucket(data[i].x);

    // 桶发生变化,输出前一个桶
    if (bucket_idx != cur_bucket) {
        flush_bucket(cur_bucket);
        cur_bucket = bucket_idx;
        min_idx = max_idx = i;  // 新桶初始化
    } else {
        // 更新当前桶极值
        if (y < data[min_idx].y) min_idx = i;
        if (y > data[max_idx].y) max_idx = i;
    }
}
flush_bucket(cur_bucket);  // 输出最后一个桶
四、优化效果对比
4.1 内存占用
| 版本 | 桶结构 | 单桶大小 | 500桶总内存 | 节省 |
|---|---|---|---|---|
| v1.0 | minVal, maxVal, minX, maxX, hasData | 40B | 20,000B | - |
| v2.0 | minIdx, maxIdx, hasData | 12B | 6,000B | 70% |
| v3.0 | cur_bucket, min_idx, max_idx | 12B | 12B | 99.94% |
4.2 时间复杂度
| 版本 | 遍历次数 | 复杂度 |
|---|---|---|
| v1.0 | 2 次 | O(2N) |
| v2.0 | 2 次 | O(2N) |
| v3.0 | 1 次 | O(N) |
4.3 完整代码
cpp
#include <vector>

struct PointF2D {
    double x{};
    double y{};
};

/**
 * 最大最小值降采样
 *
 * @param data 原始数据,必须按 X 轴升序排列
 * @param target_width 目标采样点数
 * @return 降采样后的数据集合
 */
std::vector<PointF2D> max_min_downsample_linear(const std::vector<PointF2D>& data, int target_width) {
    if (target_width <= 1) {
        return {};
    }

    if (data.size() <= target_width) {
        return data; // 数据点数不足,无需降采样
    }

    // 计算缩放因子
    const double x_min = data.front().x;
    const double x_max = data.back().x;
    const double range = x_max - x_min;
    const int bucket_count = target_width / 2;
    const double scale = static_cast<double>(bucket_count) / range;

    std::vector<PointF2D> result;
    result.reserve(target_width);

    // 当前桶状态
    int cur_bucket = -1;
    int min_idx = 0;
    int max_idx = 0;

    // 桶结束时输出结果
    auto flush_bucket = [&](int bucket_idx) {
        if (bucket_idx < 0) {
            return;
        }
        const PointF2D& p_min = data[min_idx];
        const PointF2D& p_max = data[max_idx];
        if (p_min.x <= p_max.x) {
            result.push_back(p_min);
            result.push_back(p_max);
        } else {
            result.push_back(p_max);
            result.push_back(p_min);
        }
    };

    // 遍历数据
    for (int i = 0; i < static_cast<int>(data.size()); ++i) {
        const double x = data[i].x;
        const double y = data[i].y;

        // 计算当前点属于哪个桶
        int bucket_idx = static_cast<int>((x - x_min) * scale);
        if (bucket_idx >= bucket_count) {
            bucket_idx = bucket_count - 1;
        }

        // 桶发生变化,输出前一个桶
        if (bucket_idx != cur_bucket) {
            flush_bucket(cur_bucket);

            // 更新当前桶
            cur_bucket = bucket_idx;
            min_idx = max_idx = i;
        } else {
            if (y < data[min_idx].y) {
                min_idx = i;
            }
            if (y > data[max_idx].y) {
                max_idx = i;
            }
        }
    }

    // 输出最后一个桶
    flush_bucket(cur_bucket);

    return result;
}
五、效果展示
测试用例:
cpp
#include <fstream>
#include <iostream>
#include <string>
#include "SampleLinear.hpp"
int main() {
// 1. 读取 CSV 文件
const std::string csv_path = "./raw_data.csv";
std::vector<PointF2D> data;
try {
std::ifstream file(csv_path);
if (!file.is_open()) {
std::cerr << "Failed to open file: " << csv_path << std::endl;
return -1;
}
std::string line;
// 跳过表头
std::getline(file, line);
while (std::getline(file, line)) {
if (line.empty())
continue;
// 解析 x,y 格式
size_t comma_pos = line.find(',');
if (comma_pos != std::string::npos) {
PointF2D point;
point.x = std::stof(line.substr(0, comma_pos));
point.y = std::stof(line.substr(comma_pos + 1));
data.push_back(point);
}
}
file.close();
std::cout << "Read " << data.size() << " data points from CSV" << std::endl;
} catch (const std::exception& e) {
std::cerr << "Error reading CSV: " << e.what() << std::endl;
return -1;
}
// 2. 调用 max_min_downsample_linear 进行降采样
const int target_width = 1000; // 目标采样点数
auto result = max_min_downsample_linear(data, target_width);
std::cout << "Downsampled to " << result.size() << " points (target: " << target_width << ")" << std::endl;
// 3. 输出结果
std::ofstream outFile("./downsampled_output.csv");
outFile << "x,y" << std::endl; // 写入表头
for (int i = 0; i < result.size(); ++i) {
outFile << result[i].x << "," << result[i].y << std::endl;
}
outFile.close();
return 0;
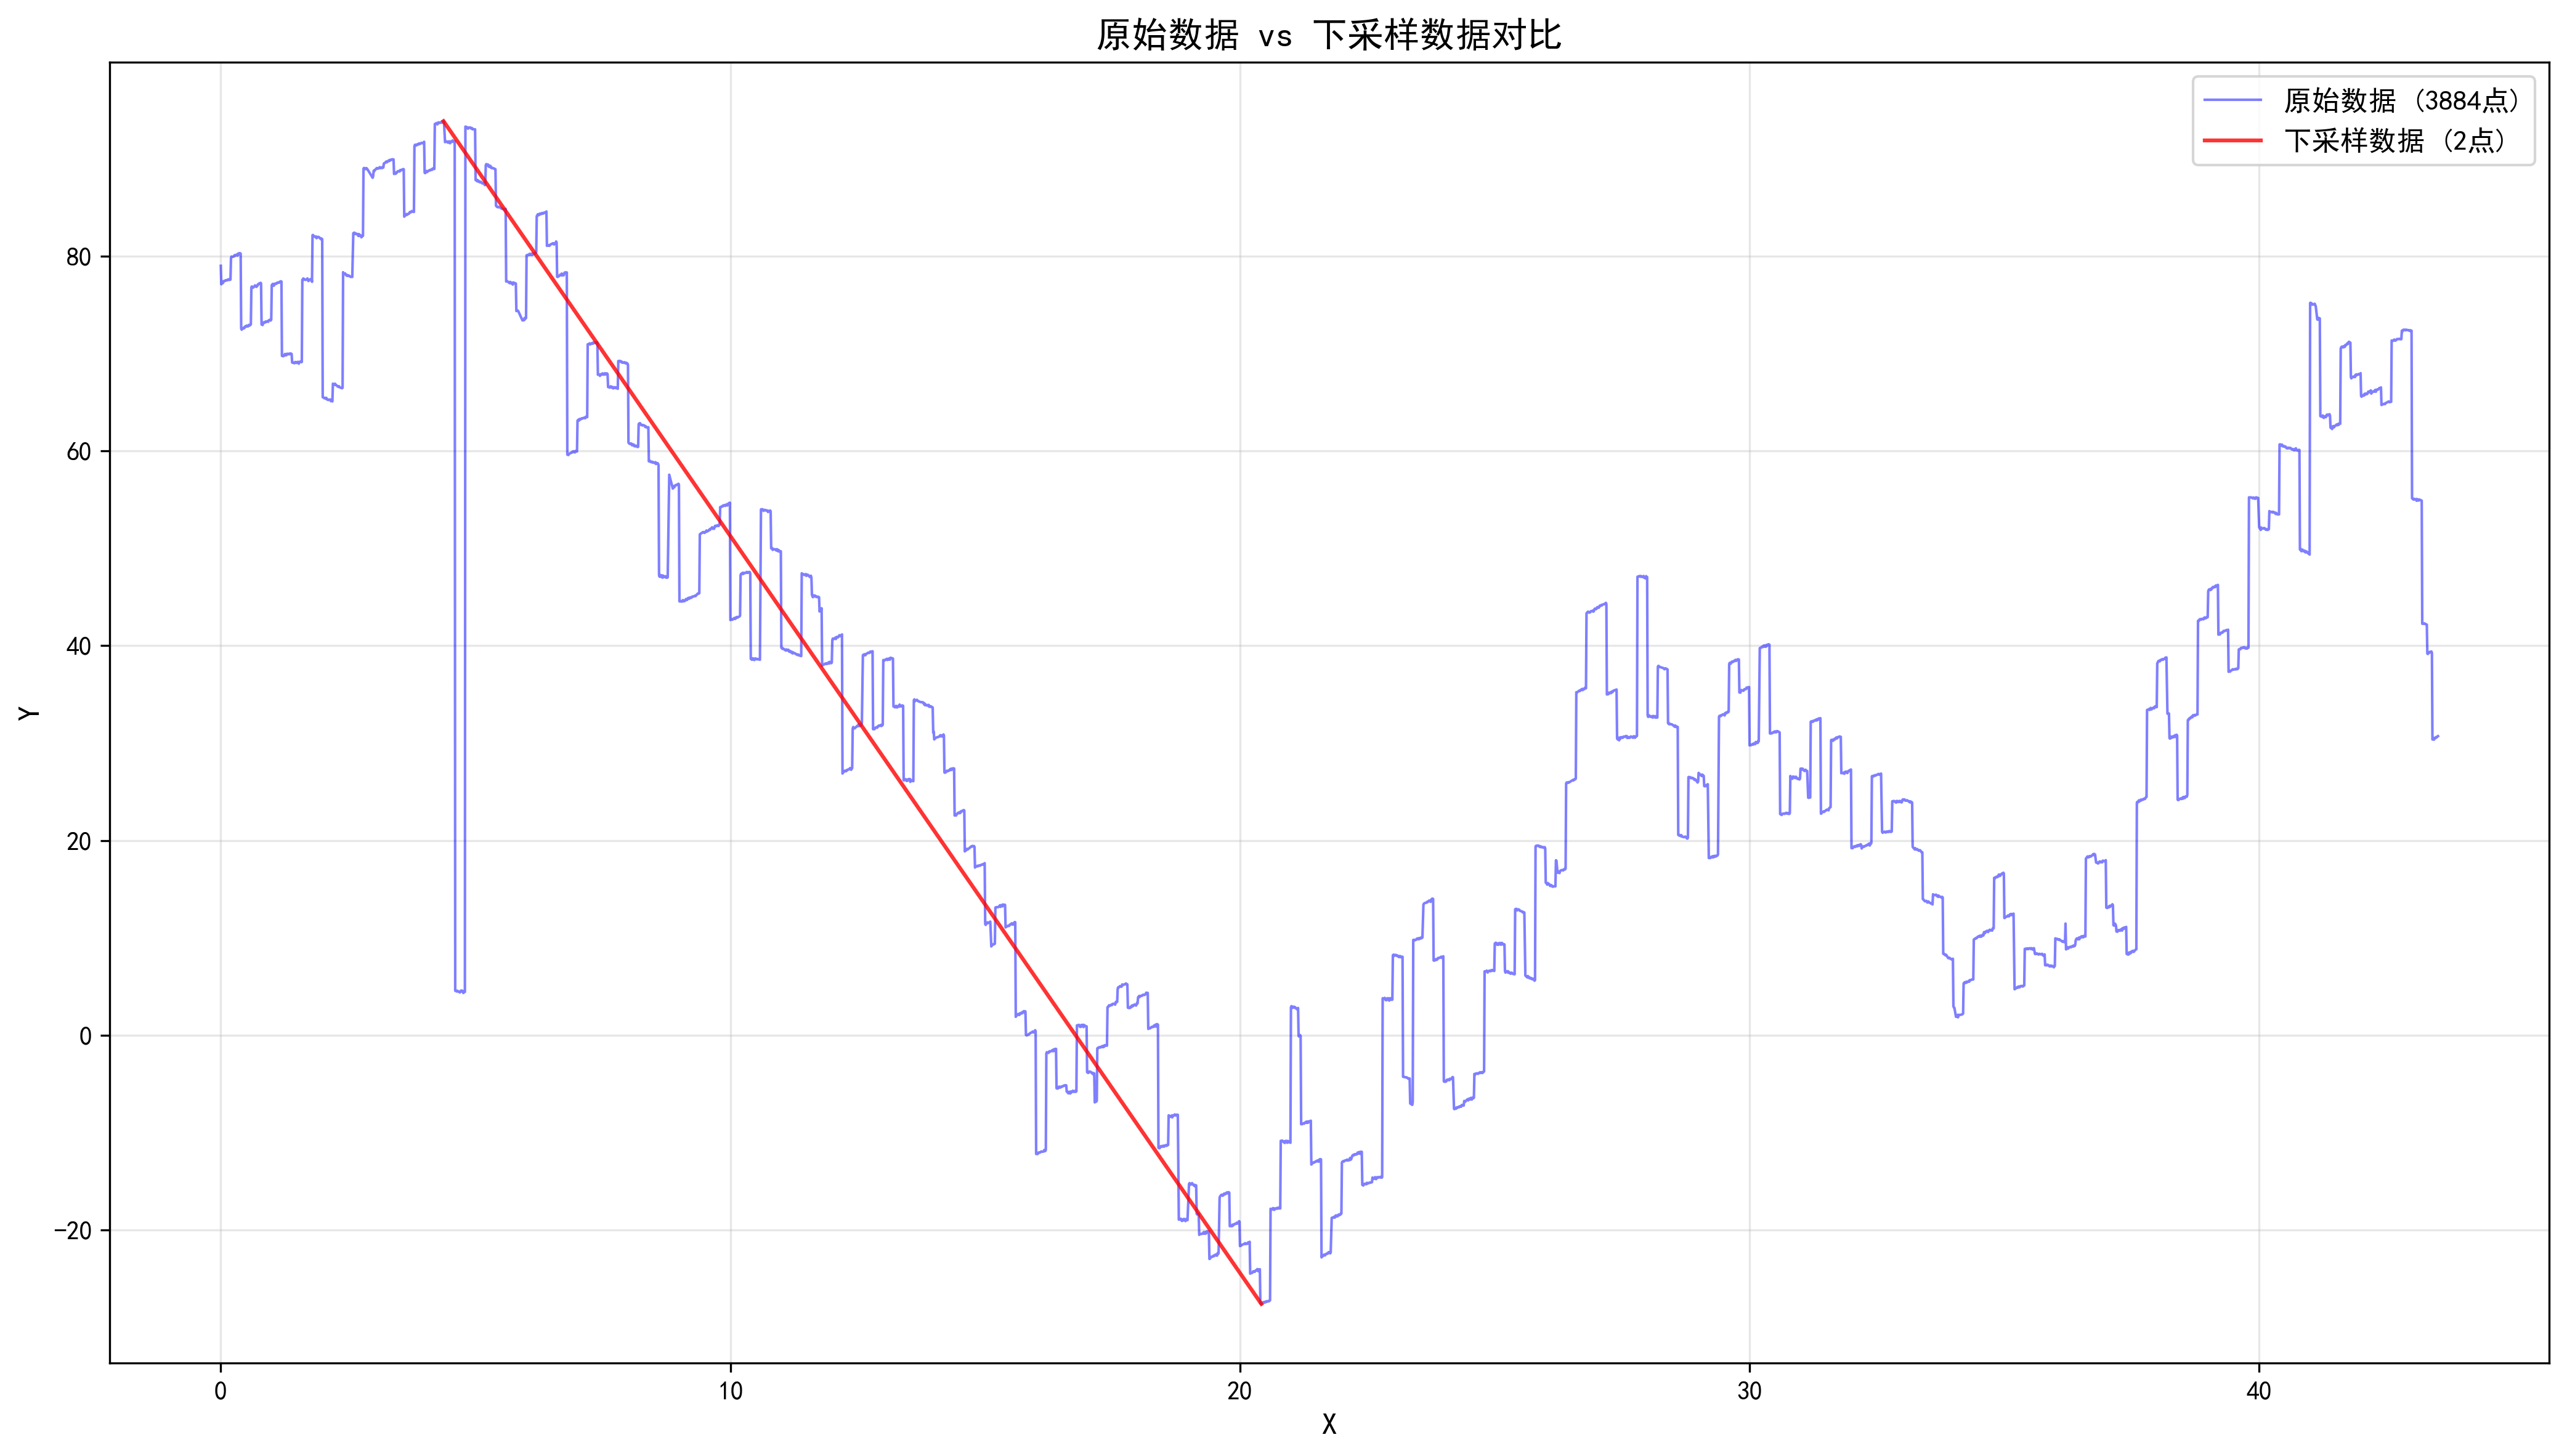
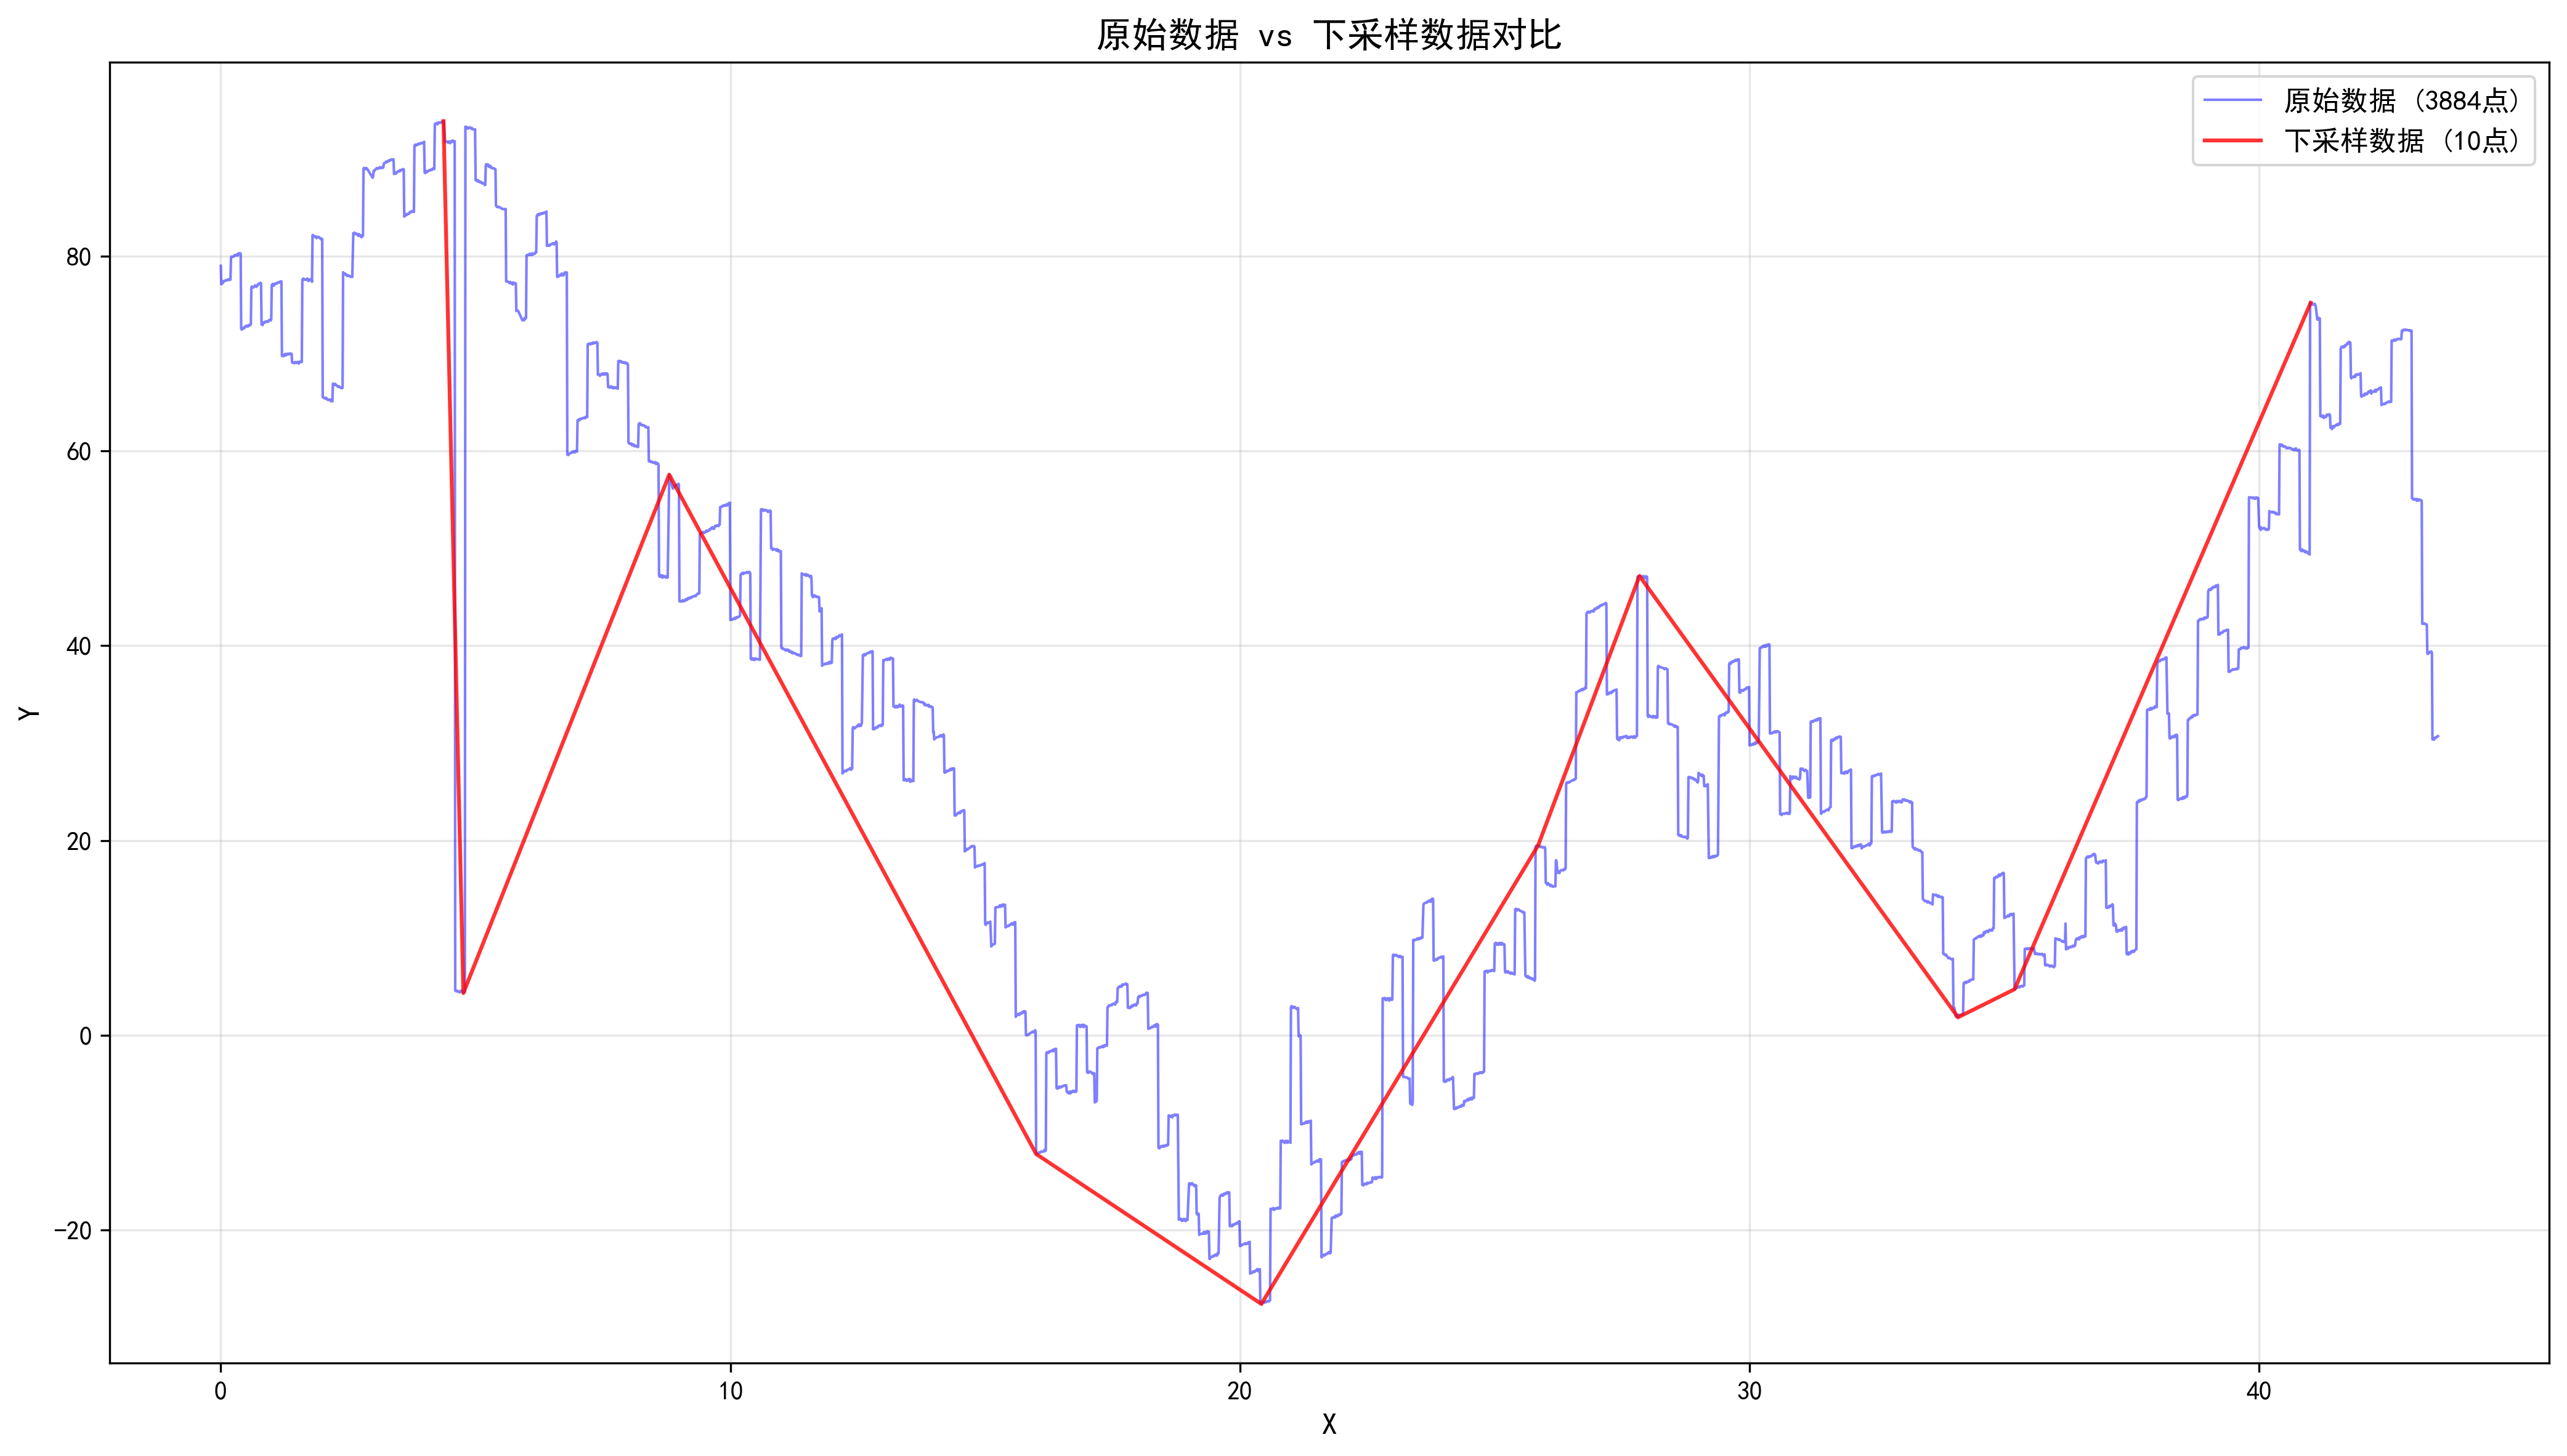
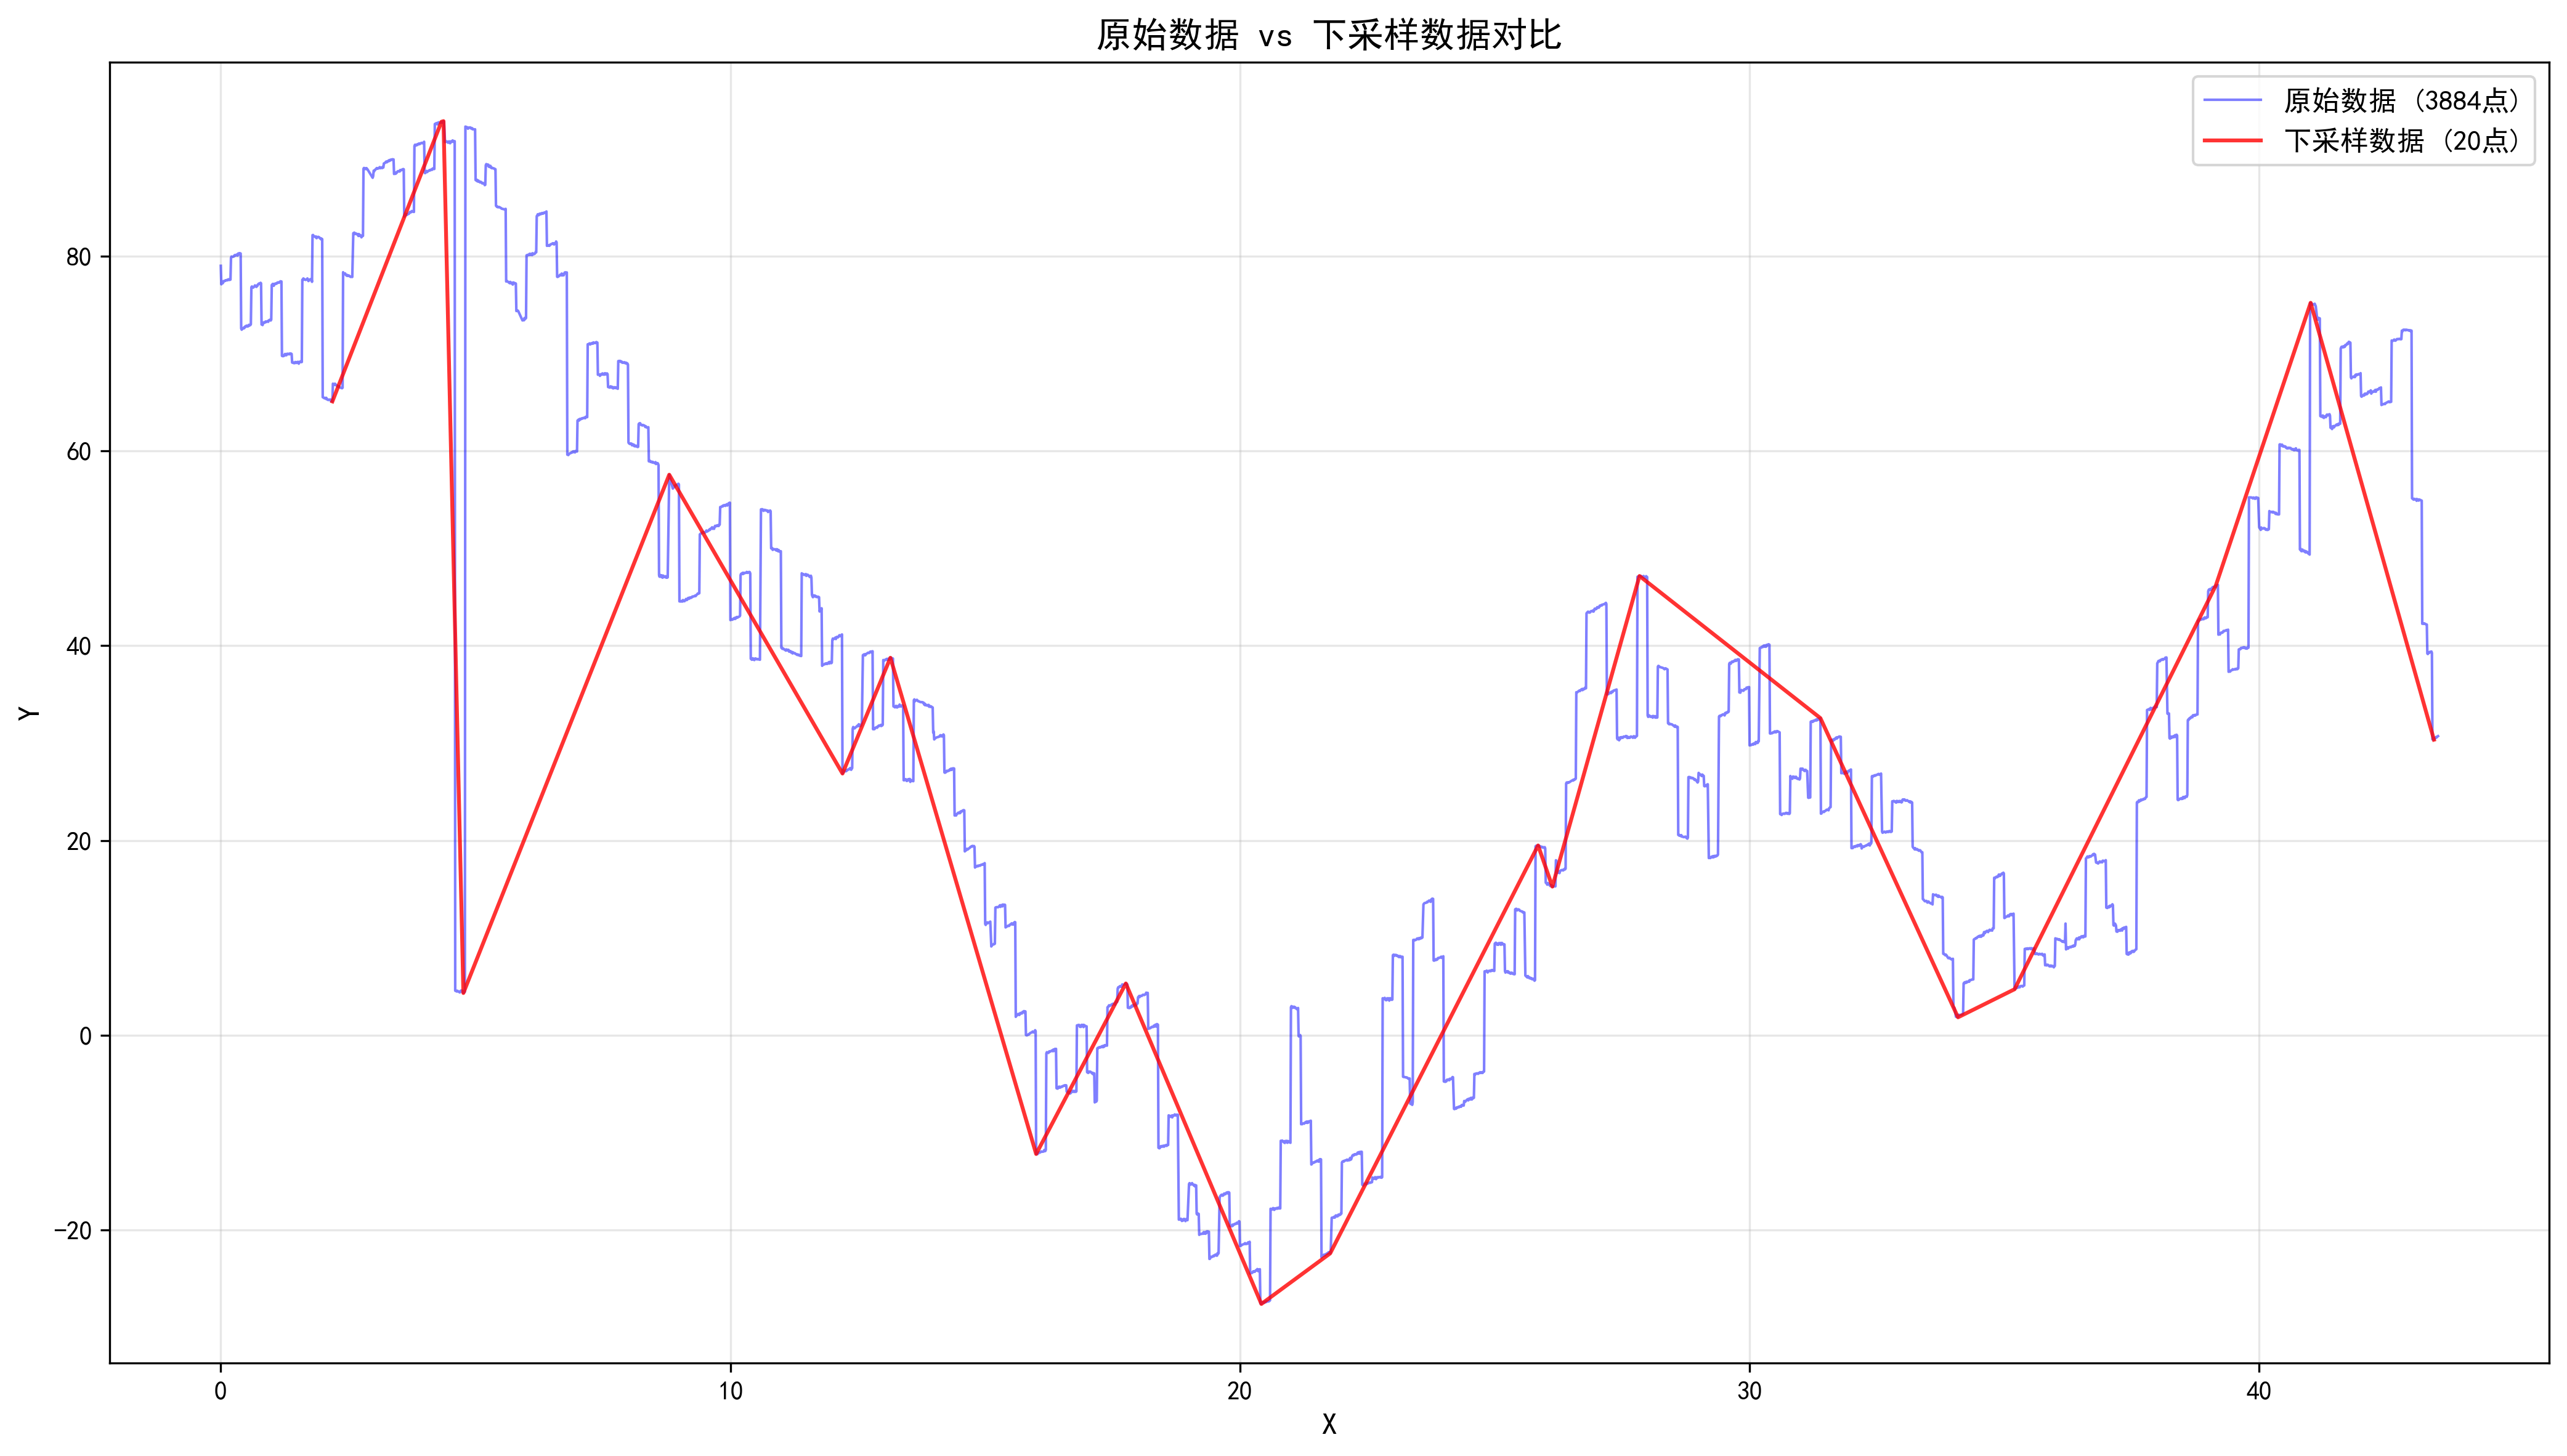
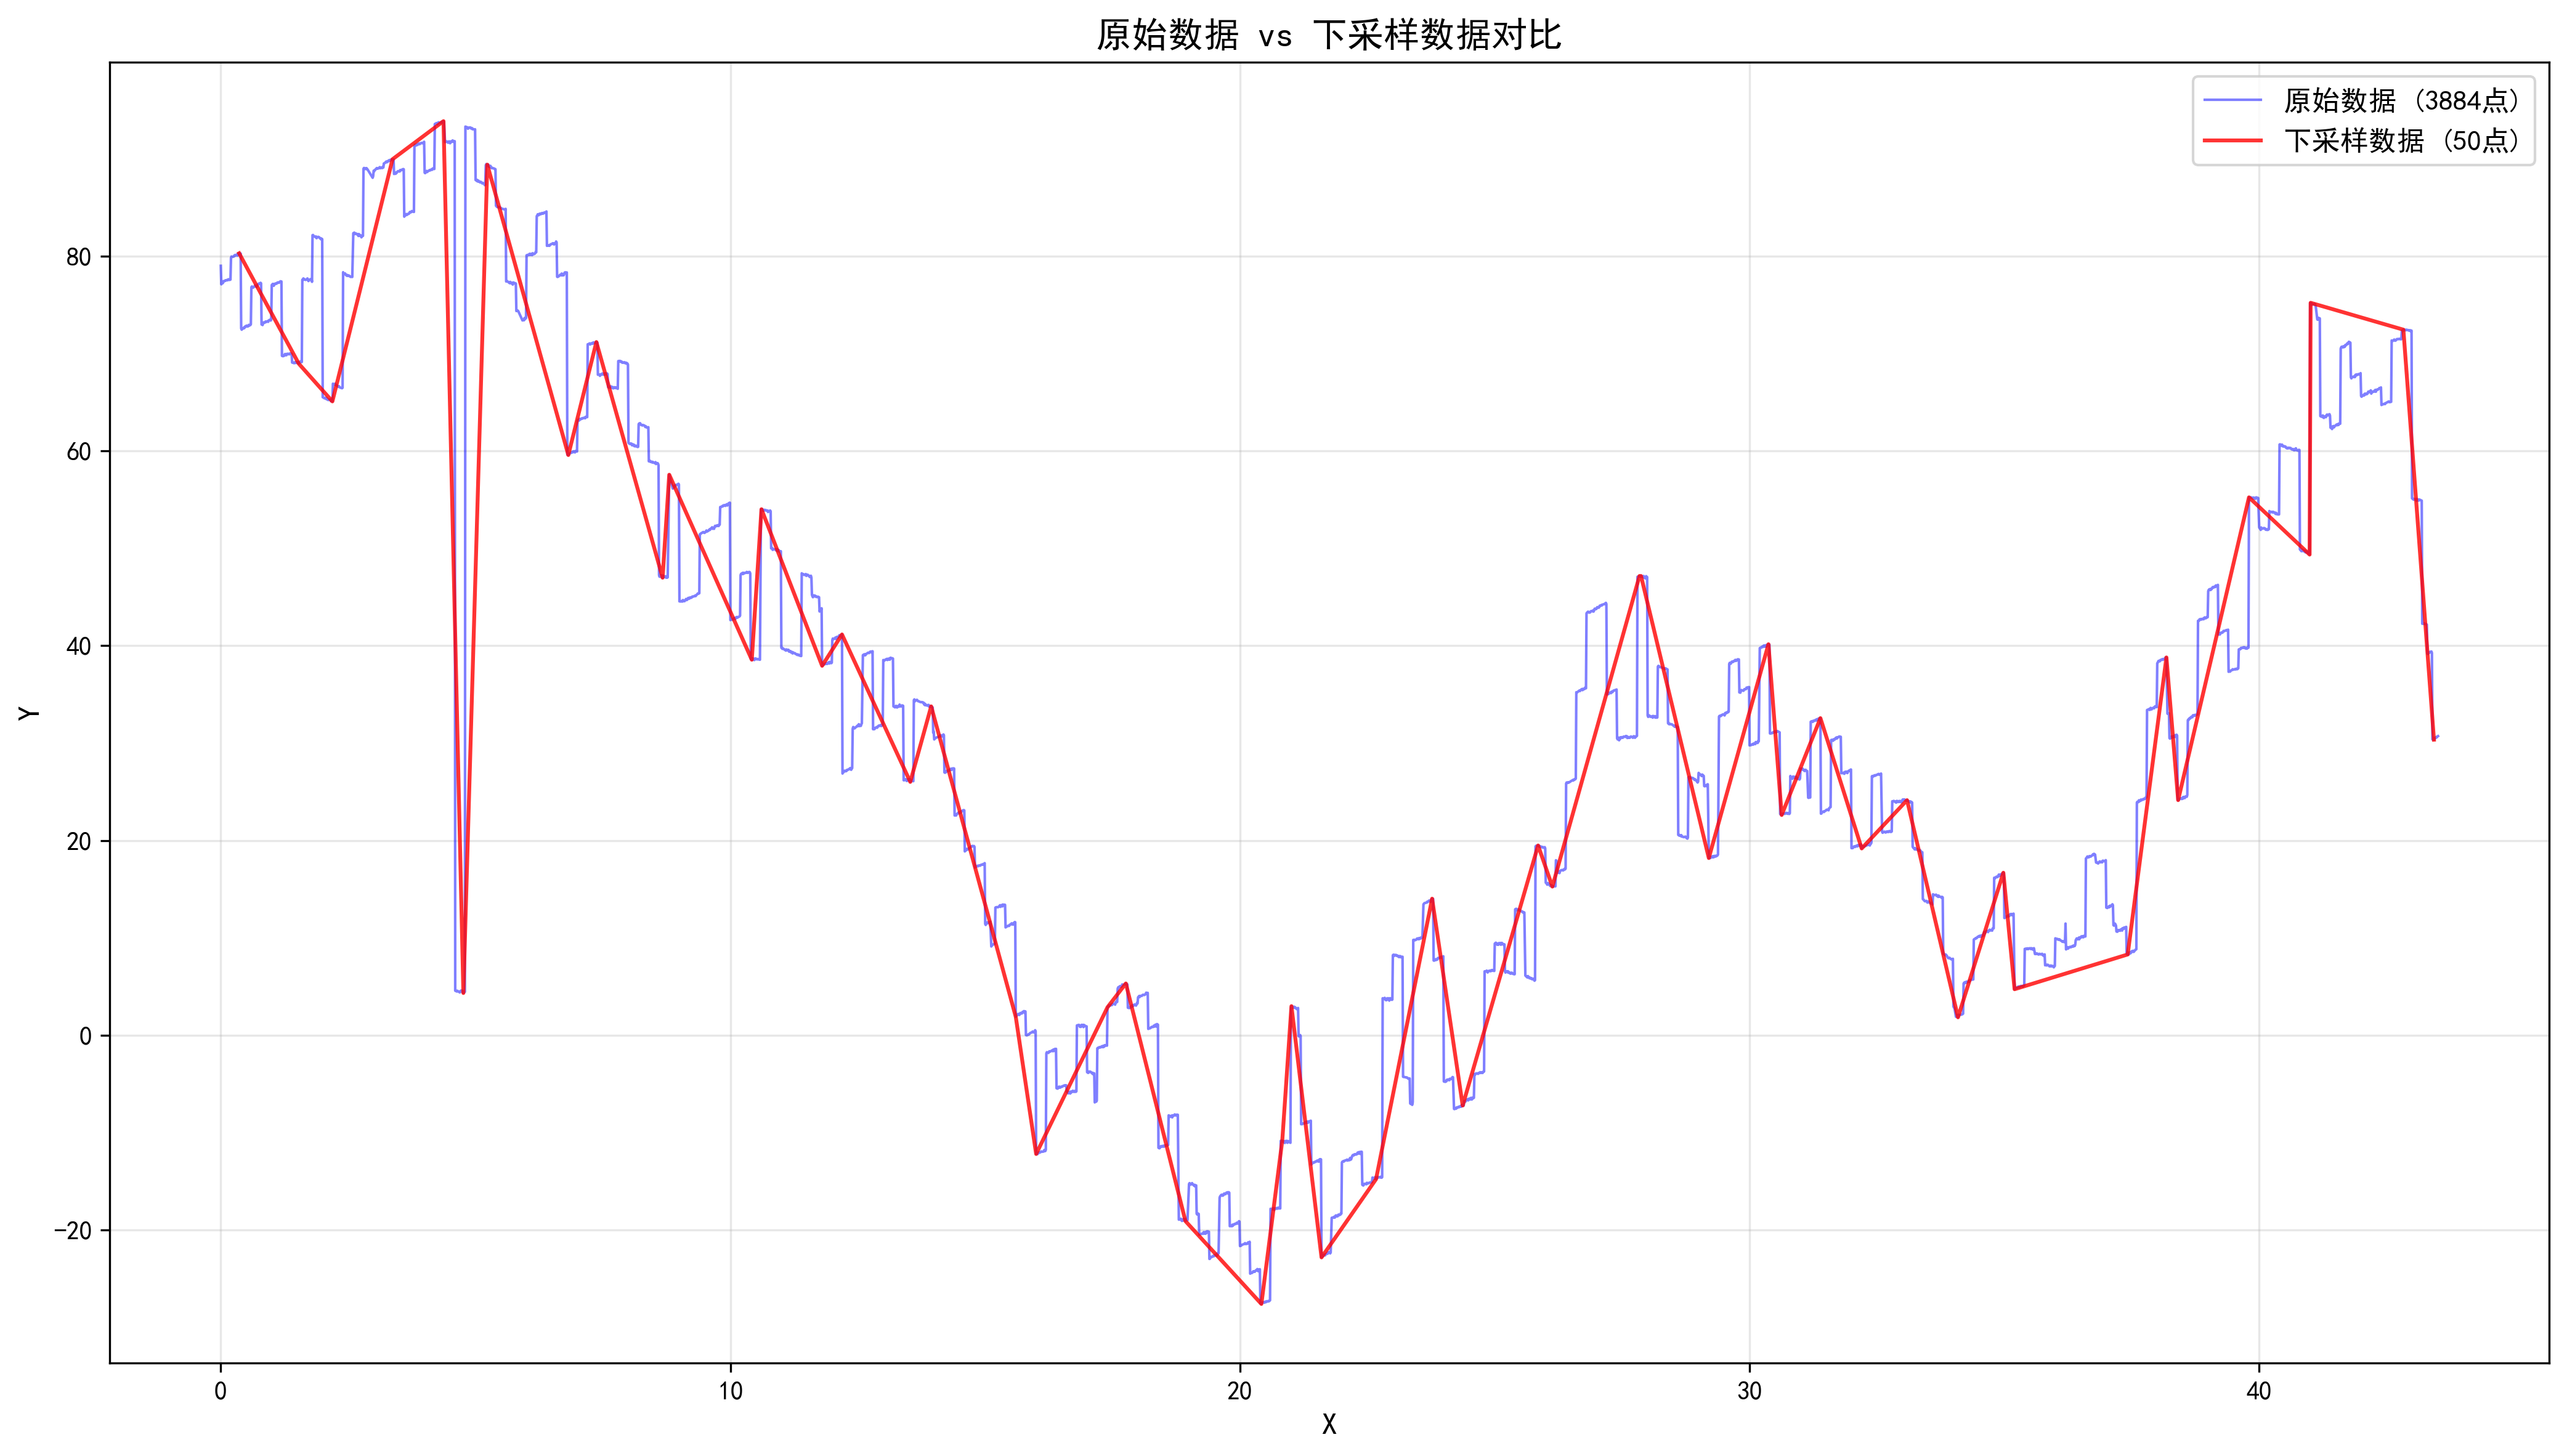
}使用 Python 可视化降采样效果:
python
import pandas as pd
import matplotlib
matplotlib.use('Agg') # 使用非交互式后端
import matplotlib.pyplot as plt
# 设置中文字体
matplotlib.rcParams['font.sans-serif'] = ['SimHei', 'Microsoft YaHei', 'Arial Unicode MS']
matplotlib.rcParams['axes.unicode_minus'] = False
# 读取两个CSV文件
df_original = pd.read_csv('./raw_data.csv')
df_downsampled = pd.read_csv('./downsampled_output.csv')
print(f"data.csv 数据行数: {len(df_original)}")
print(f"downsampled_output.csv 数据行数: {len(df_downsampled)}")
# 创建叠加对比图
fig2, ax3 = plt.subplots(1, 1, figsize=(14, 8))
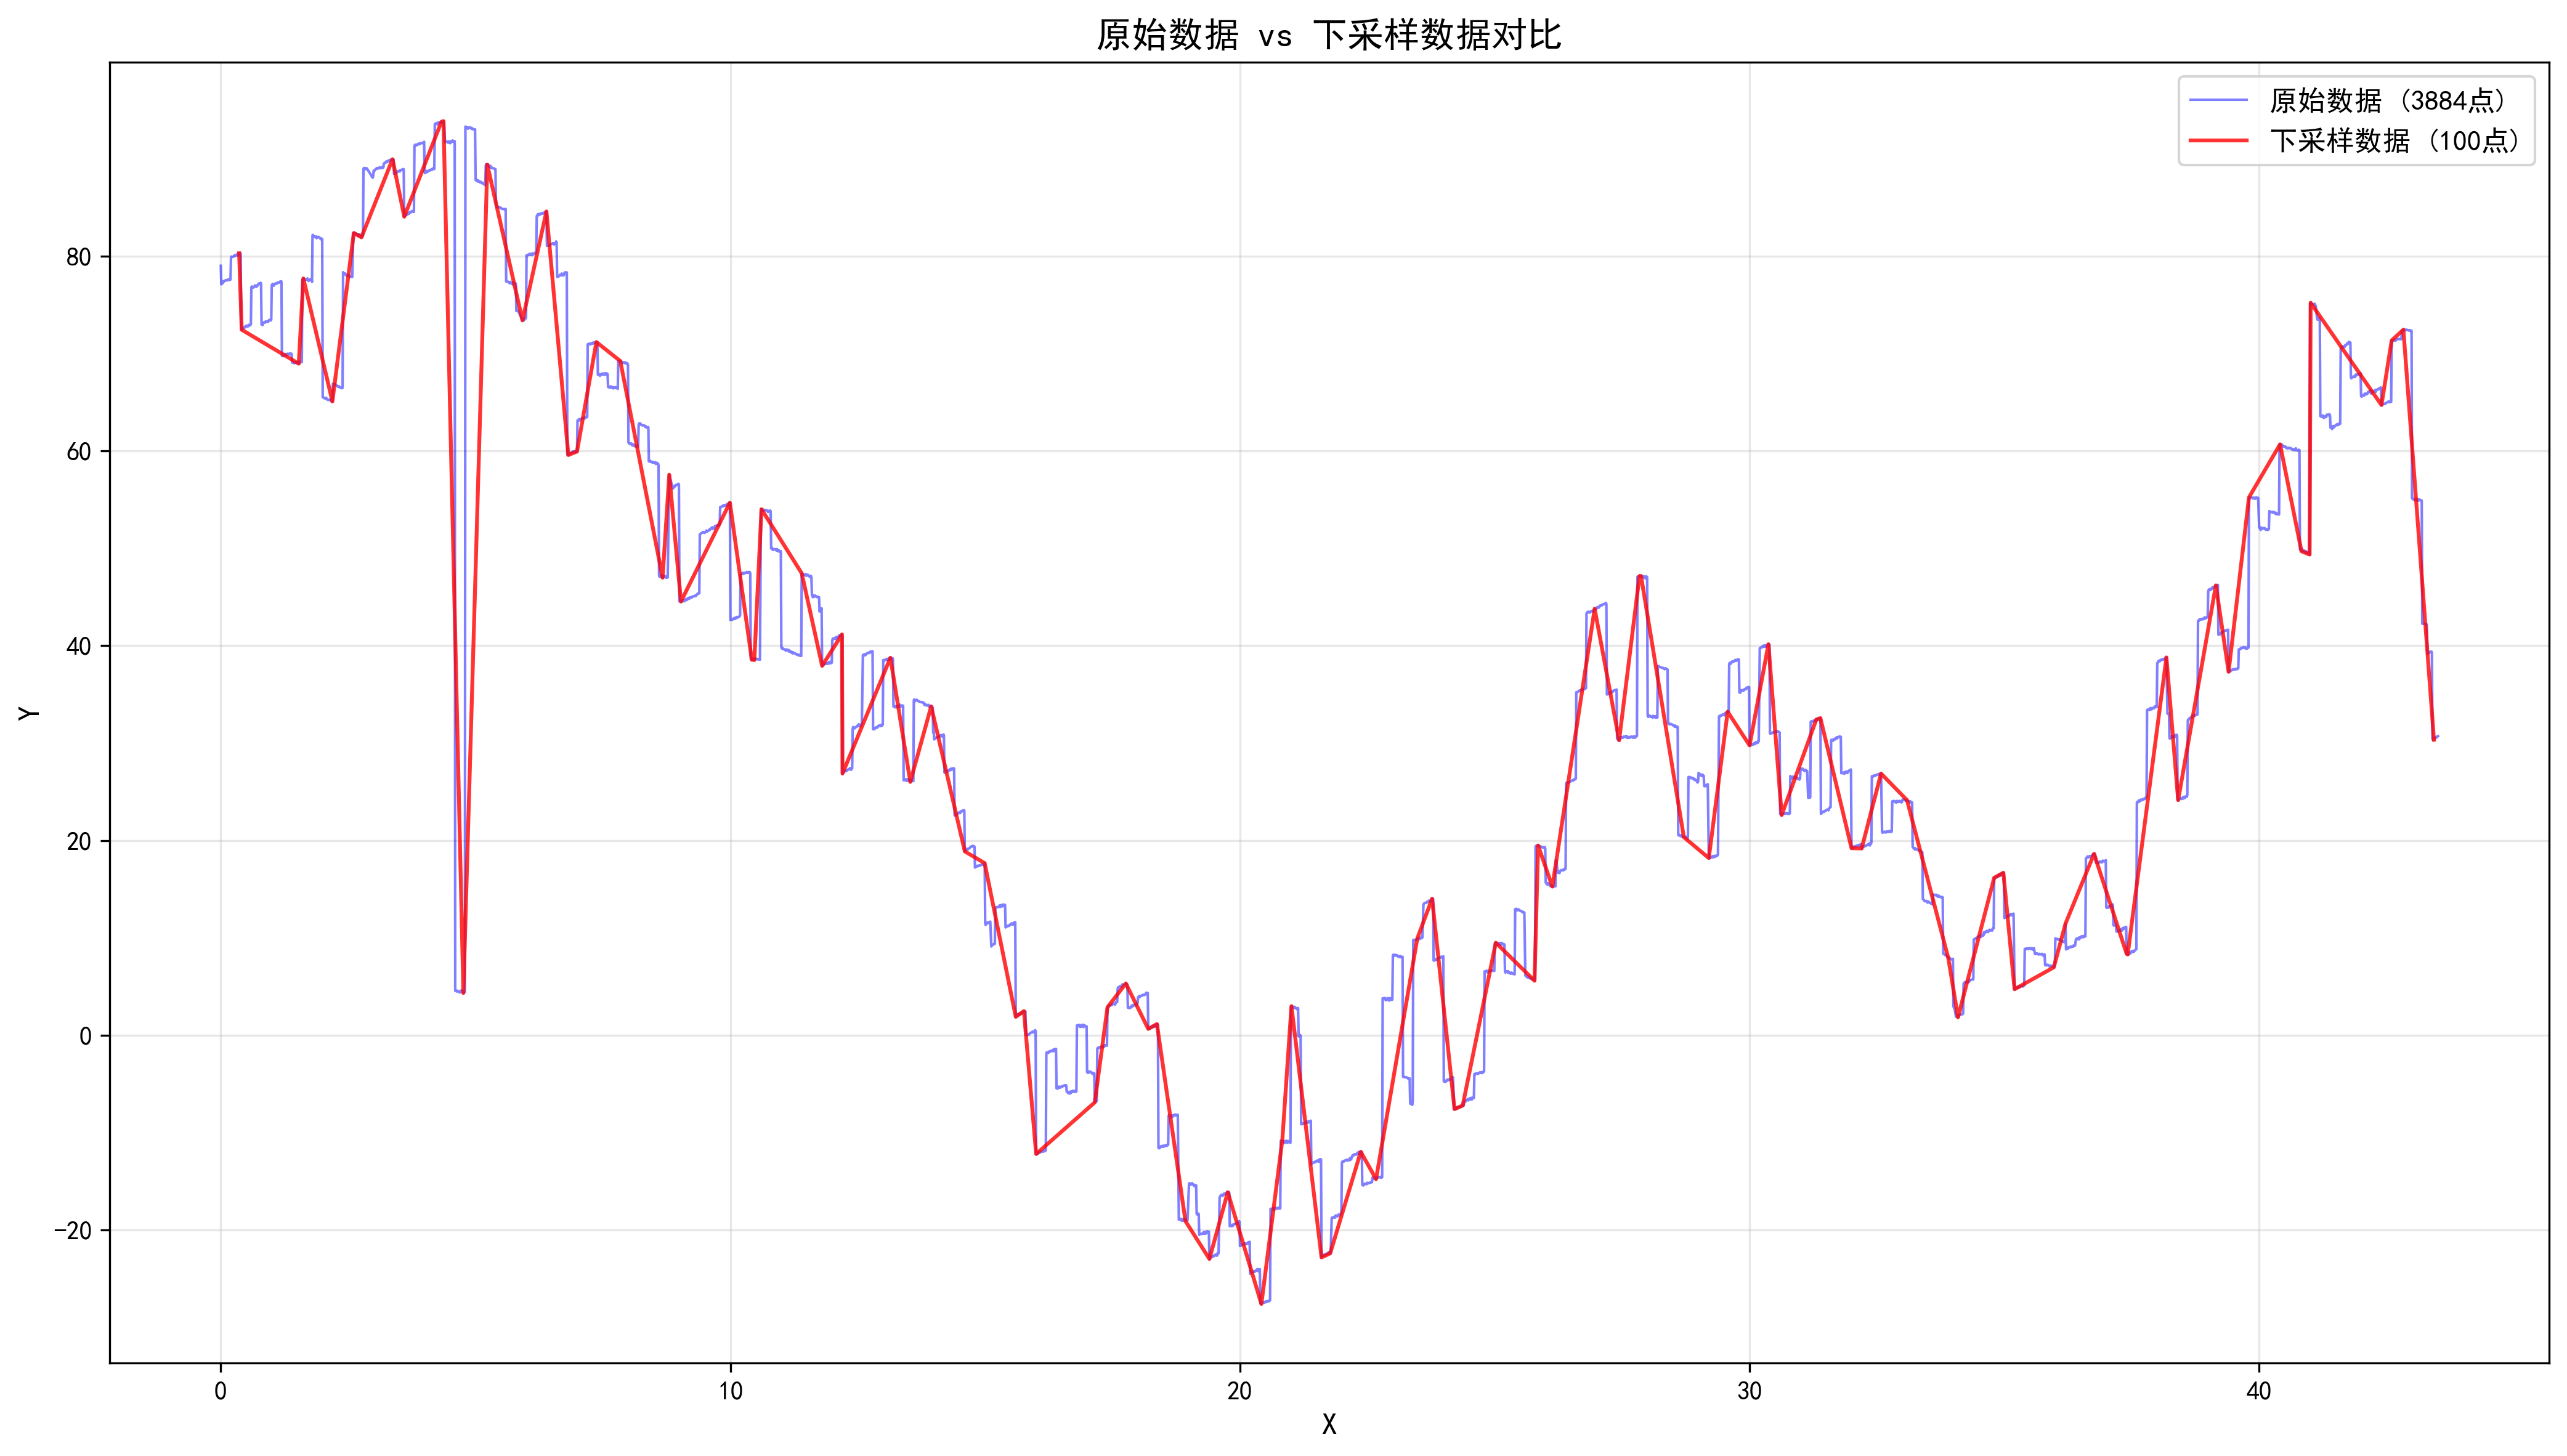
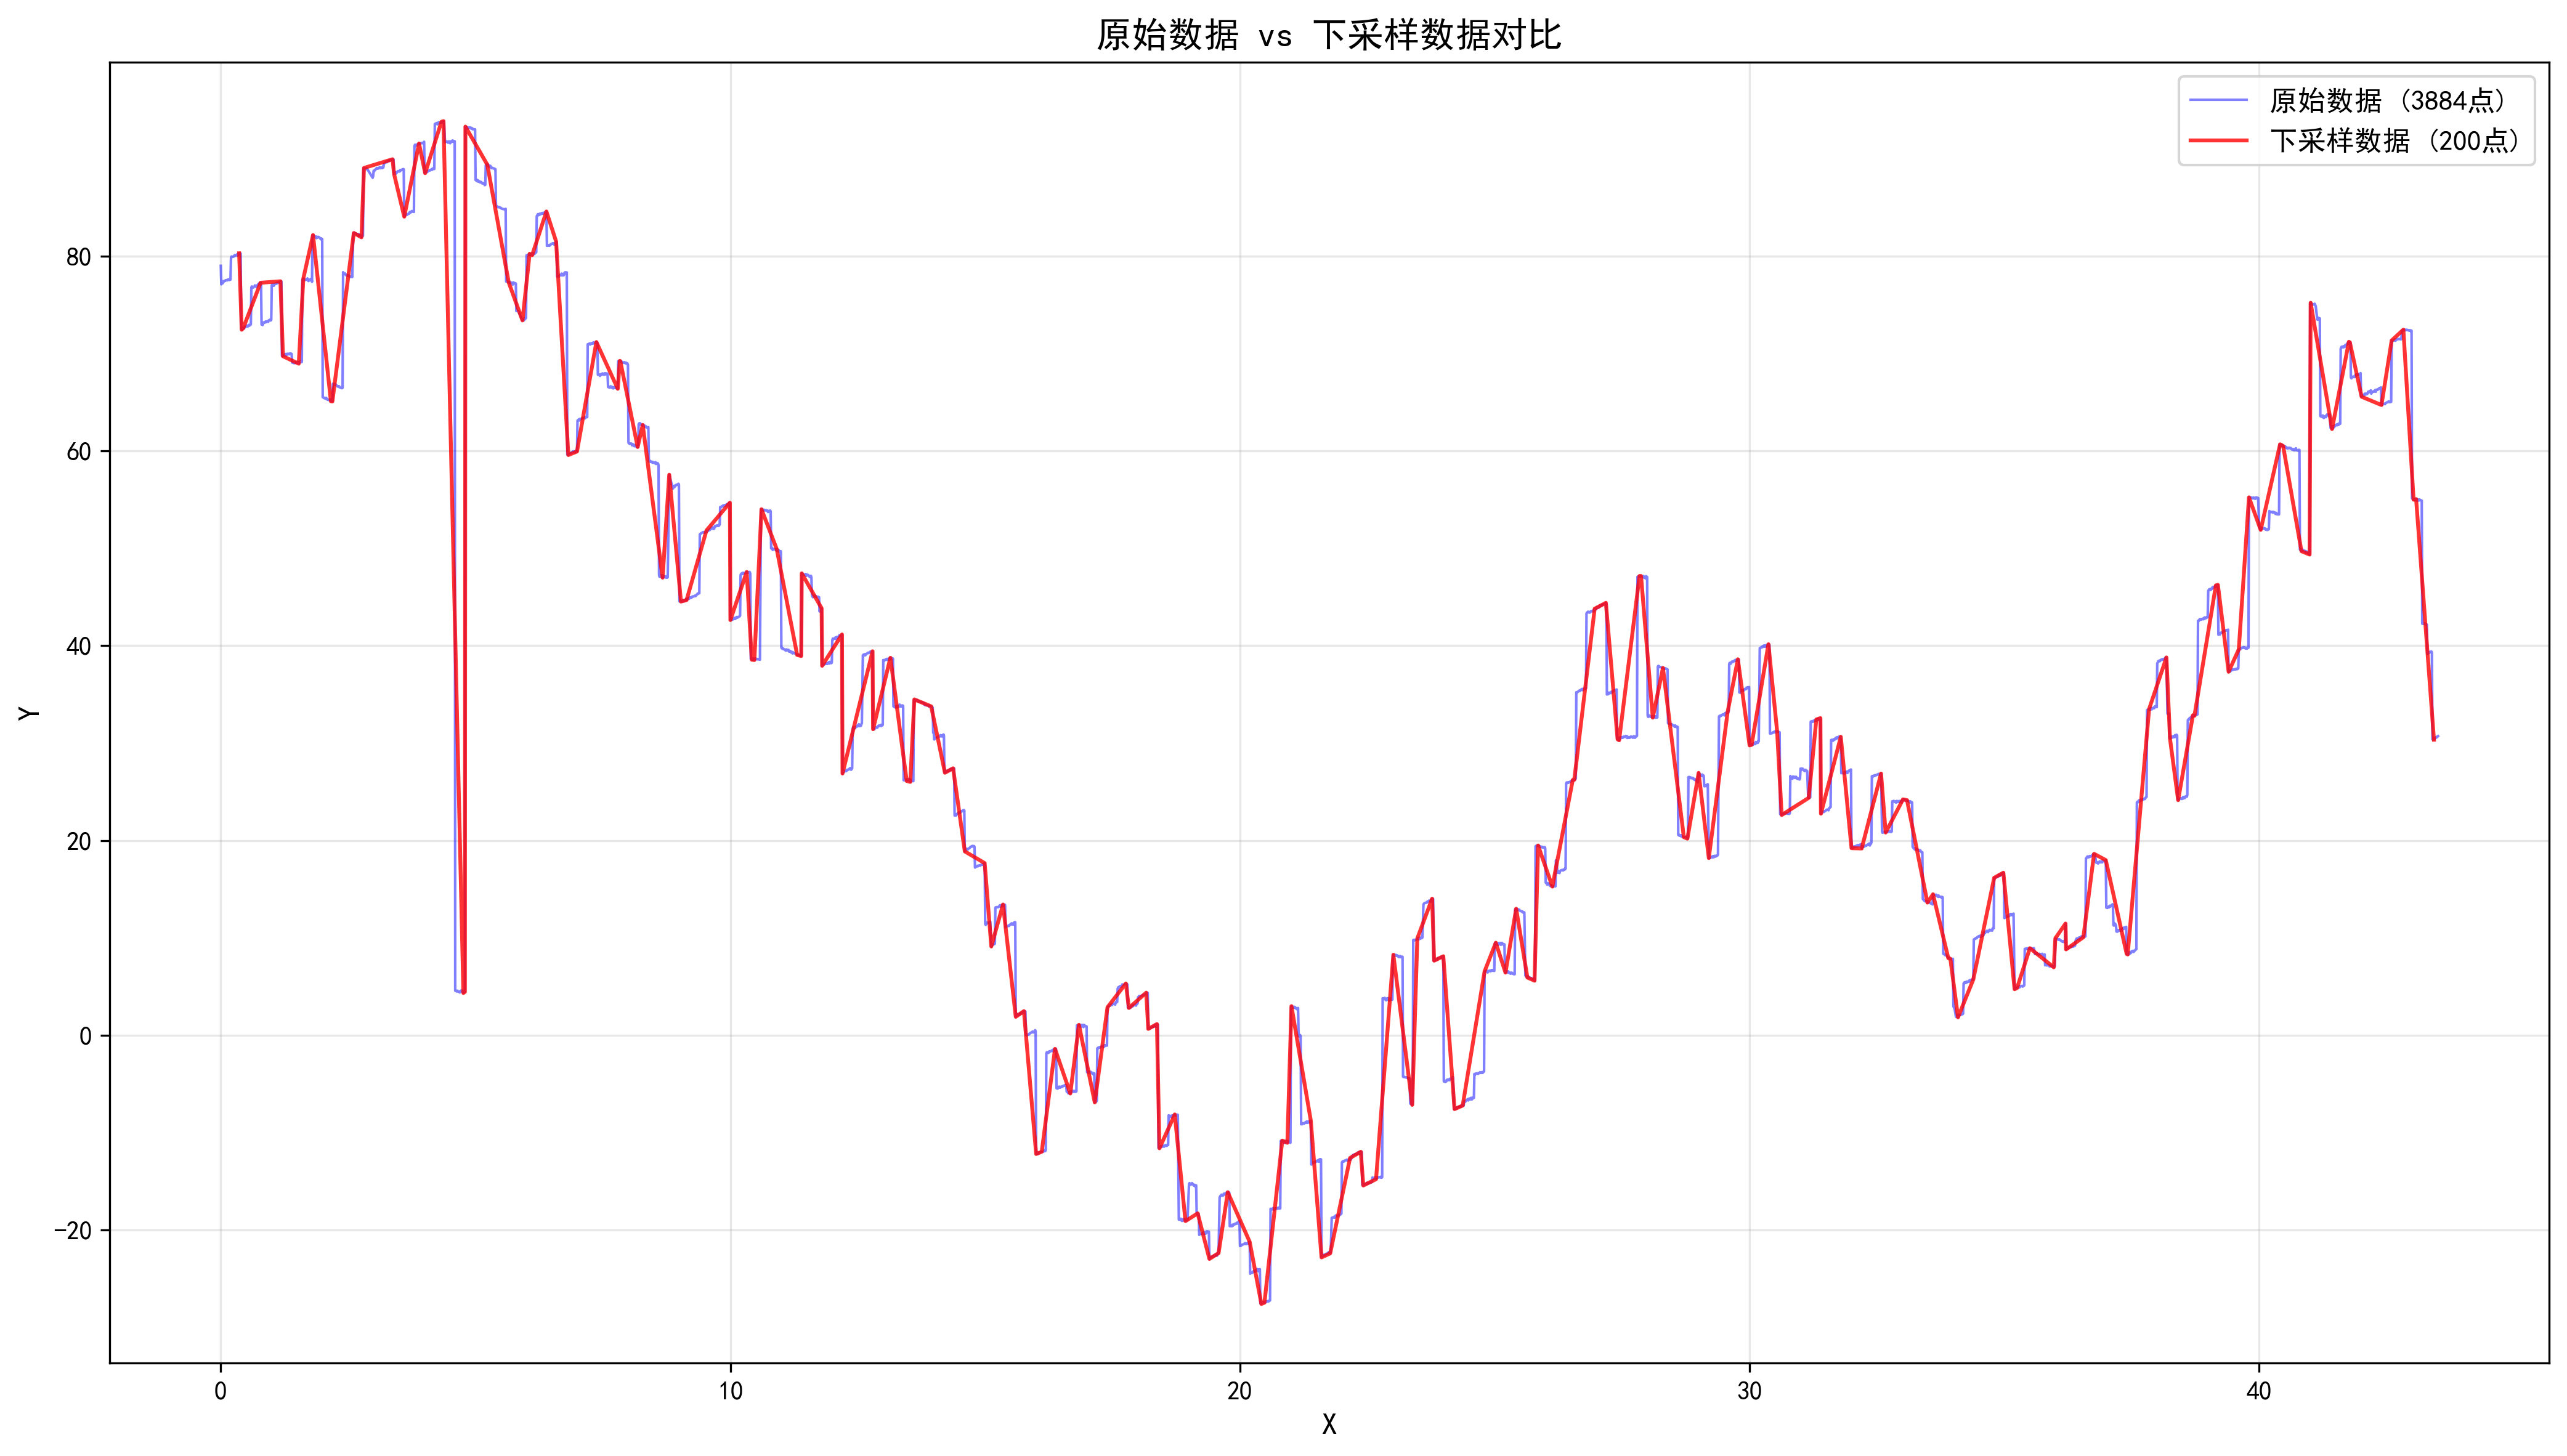
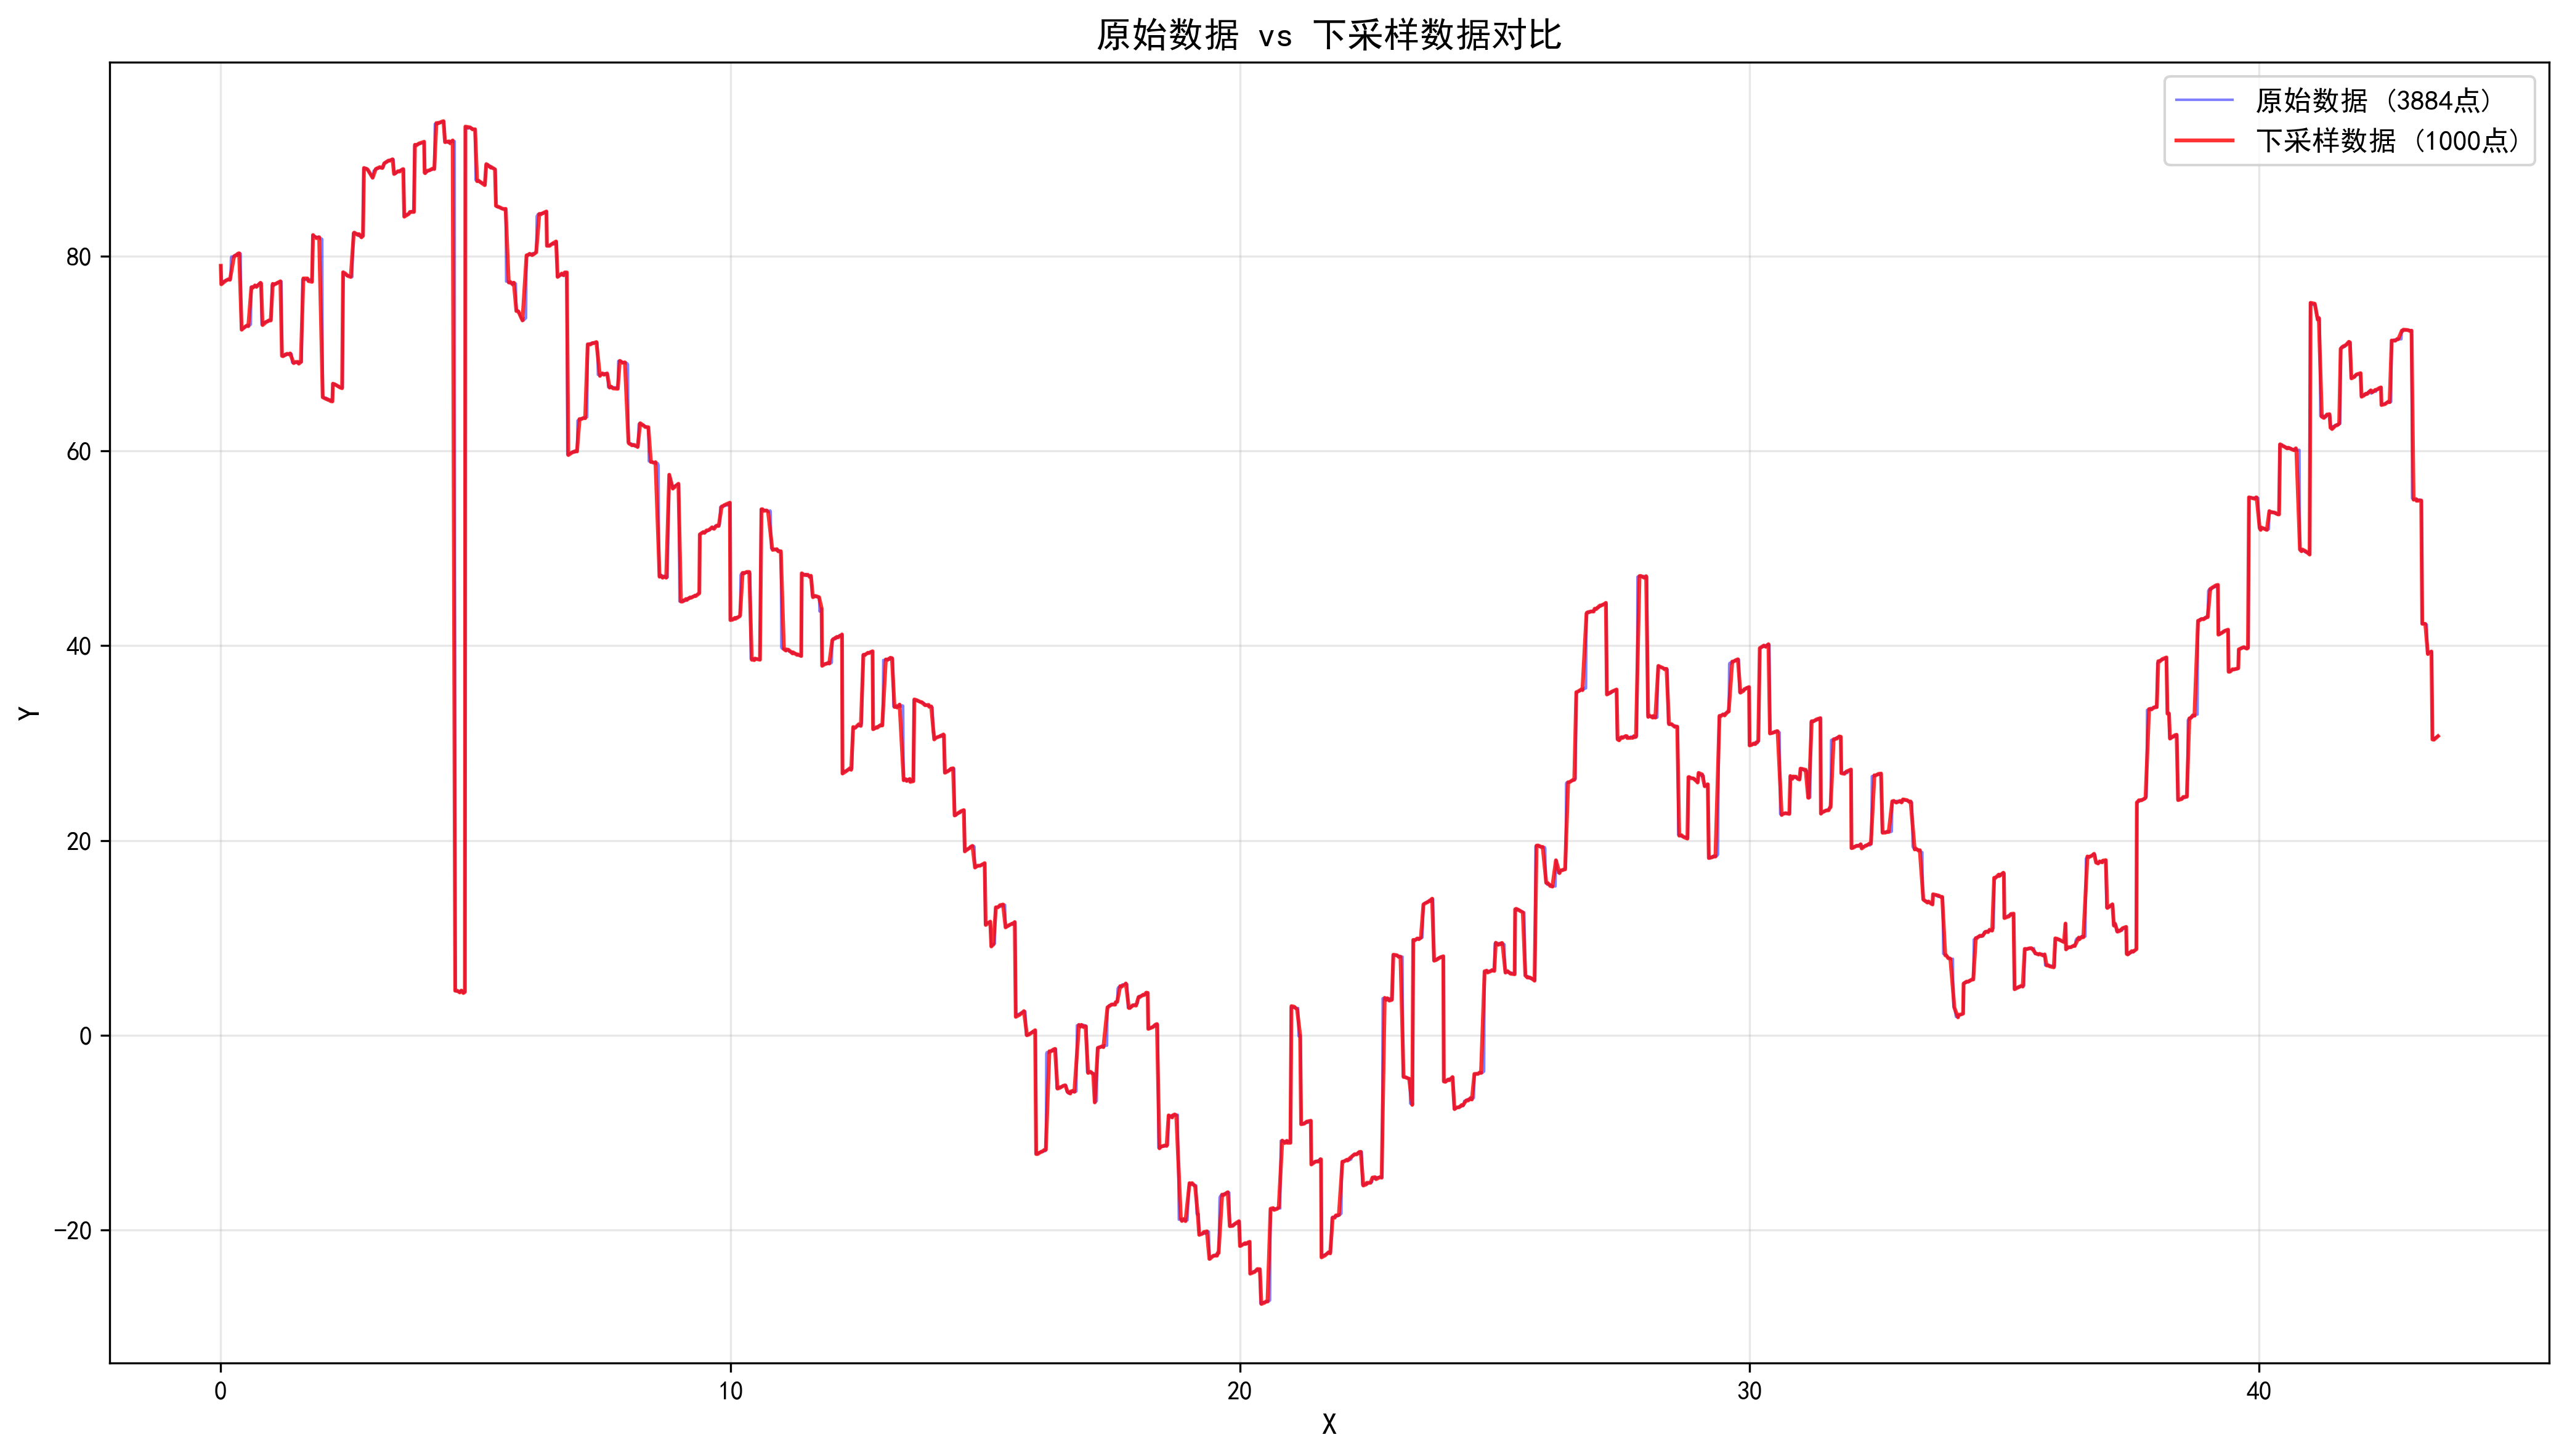
ax3.plot(df_original['x'], df_original['y'], 'b-', linewidth=1, label=f'原始数据 ({len(df_original)}点)', alpha=0.5)
ax3.plot(df_downsampled['x'], df_downsampled['y'], 'r-', linewidth=1.5, label=f'下采样数据 ({len(df_downsampled)}点)', alpha=0.8)
ax3.set_xlabel('X', fontsize=12)
ax3.set_ylabel('Y', fontsize=12)
ax3.set_title('原始数据 vs 下采样数据对比', fontsize=14, fontweight='bold')
ax3.grid(True, alpha=0.3)
ax3.legend(fontsize=11)
plt.tight_layout()
plt.savefig('./overlay_plot.png', dpi=300, bbox_inches='tight')
print(f"✓ 叠加对比图已保存到: ./overlay_plot.png")六、总结与思考
核心优化思路
- 索引代替值:不存储计算结果,存储原始数据的位置
- 流式处理:边读边写,避免中间缓冲区
- lambda 封装 :将桶切换逻辑提取为
flush_bucket,提高可读性
适用场景
| 场景 | 推荐程度 | 原因 |
|---|---|---|
| 实时数据流 | ⭐⭐⭐⭐⭐ | 单次遍历,低内存 |
| 静态大数据集 | ⭐⭐⭐⭐ | 内存优化明显 |
| 多维数据 | ⭐⭐⭐ | 需扩展 bucket 结构 |
附录:效果图