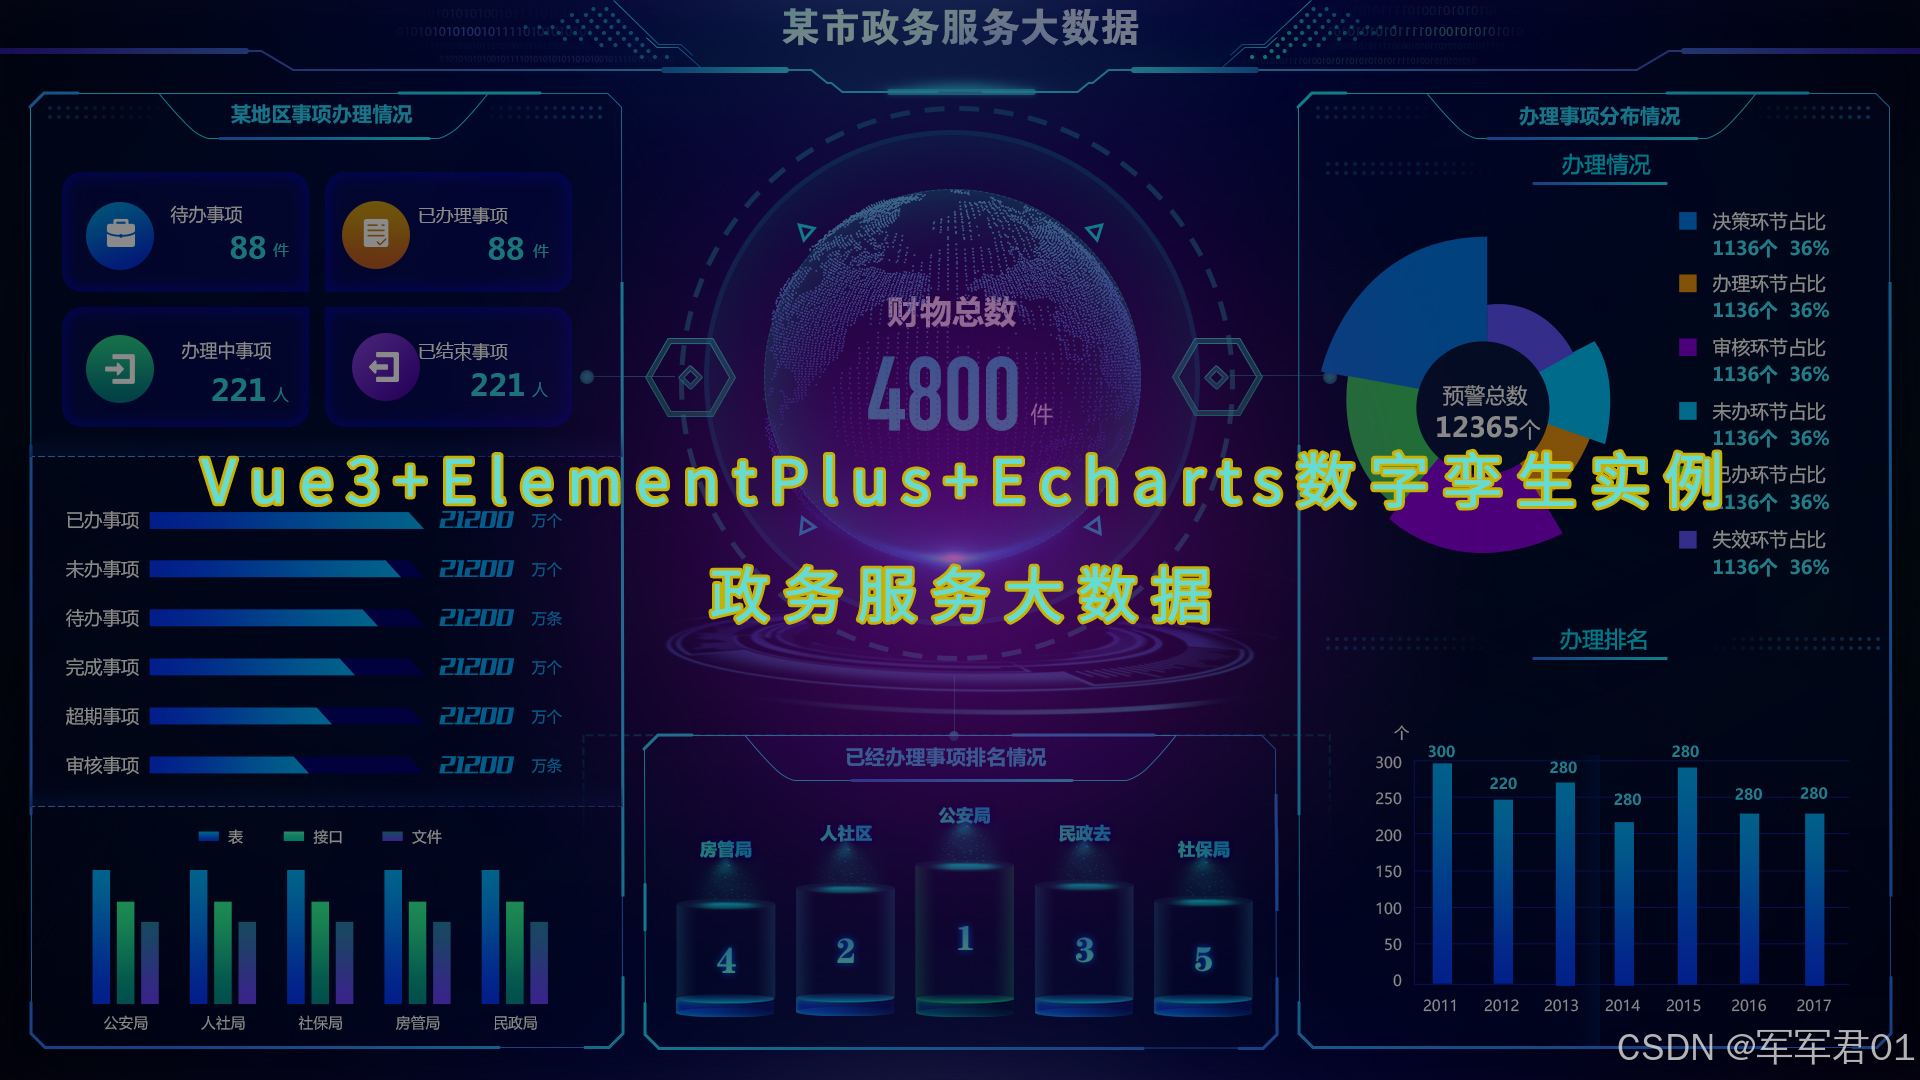
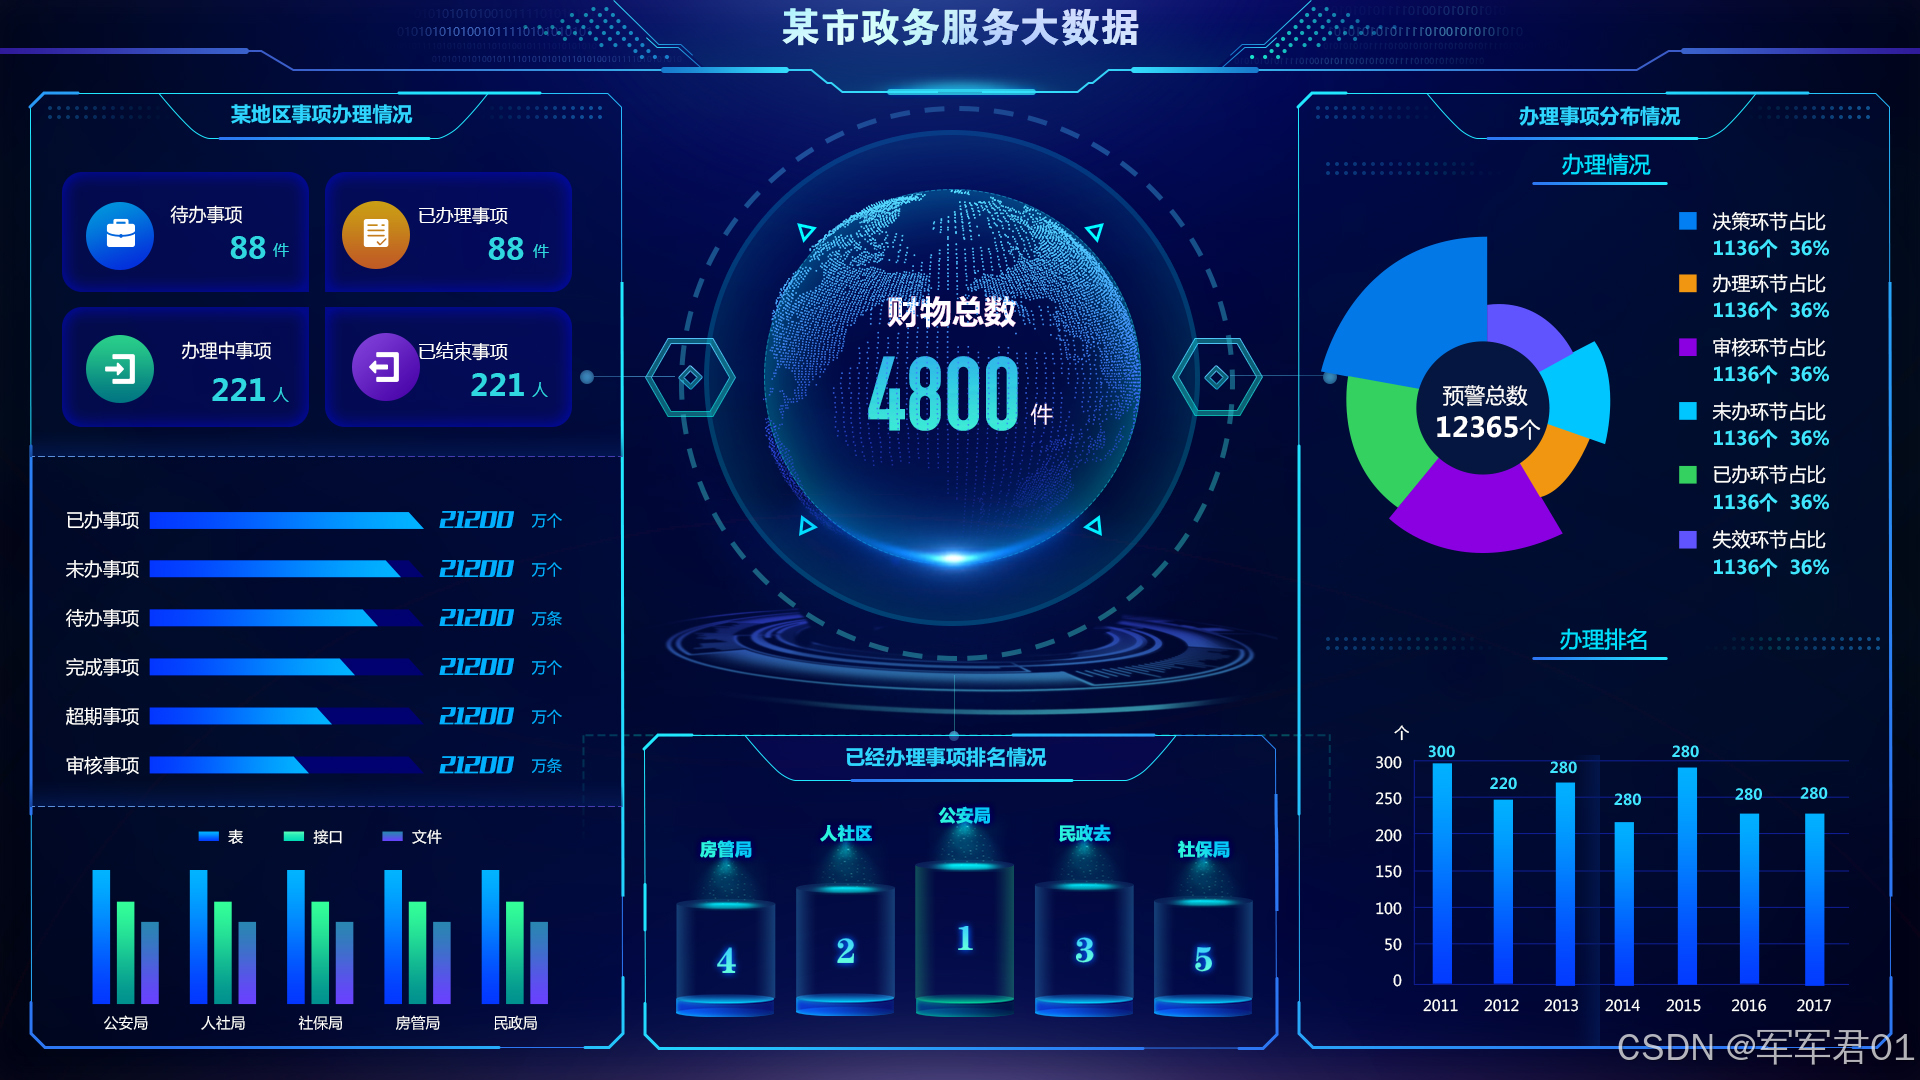
前端数字孪生大屏,使用VUE3+Elementplus+Echarts+TS实现政务服务大数据大屏,数字孪生,监控大屏展示,可下载作为课堂作业、界面模板、扩展开发,个人作品等。
若想系统学习Echarts开发,我的课程提供了完整的Echarts基础知识讲解并附加大量实战案例,系列课程地址如下:
1. CSDN课程:https://edu.csdn.net/course/detail/40842
2. 51学堂课程:https://edu.51cto.com/course/40414.html
3. B站课程:https://www.bilibili.com/cheese/play/ss456500998
一.效果展示:
二.源码下载:
三.开发视频:
https://www.bilibili.com/video/BV17WdoBbEqA/
四.实现明细:
4.1 开发环境
使用vscode开发,nodejs版本为v24.11.0,其它项目依赖如下:
1. "dayjs": "^1.11.20"
2. "echarts": "^6.0.0"
3. "element-plus": "^2.13.6"
4. "less": "^4.6.4"
5. "pinia": "^3.0.4"
6. "vue": "^3.5.31"
7. "vue-router": "^5.0.4"
4.2 实现明细
- main.ts
javascript
import { createApp } from 'vue'
import { createPinia } from 'pinia'

import App from './App.vue'
import router from './router'
import ElementPlus from 'element-plus'
import 'element-plus/dist/index.css'

const app = createApp(App)

app.use(createPinia())
app.use(router)
app.use(ElementPlus)

app.mount('#app')- App.vue
javascript
<script setup lang="ts"></script>

<template>
  <RouterView></RouterView>
</template>

<style >
@import '@/assets/main.css';

</style>- HomeView.vue
javascript
<script setup lang="ts">
import ChartPanel from '@/components/ChartPanel.vue';
import Header from '@/components/Header.vue';
import LeftChartPanel from '@/components/LeftChartPanel.vue';
import RightChartPanel from '@/components/RightChartPanel.vue';
import { onMounted, reactive, ref } from 'vue';
import * as echarts from "echarts"

//中间的背景图
const centerChartBgImg = new URL('@/assets/images/icon-004.png', import.meta.url).href;

//服务总数
const allCount = ref(453425);

const centerChartRef = ref();
const centerChart = ref();
const centerChartOptions = reactive({
  grid: {
        left: '2%',
        top: '20%',
        right: '2%',
        bottom: '20%',
        containLabel: false
    },
    xAxis: {
        type: 'category',
        data: ['房管局', '人社局', '教育局', '交通局', '卫生局', '红十字'],
        show:false
    },
    yAxis: {
        type: 'value',
        show:false
    },
    series: [
      {
            name: '最上层立体圆',
            type: 'pictorialBar',
            symbolSize: [80, 15],
            symbolOffset: [0, -7],
            z: 12,
            itemStyle: {
                normal: {
                    color: {
                      type: 'radial',
                      x: 0.5,
                      y: 0.5,
                      r: 0.5,
                      colorStops: [{
                          offset: 0, color: '#02bfd3' // 0% 处的颜色
                      }, {
                          offset: 1, color: '#02bfd311' // 100% 处的颜色
                      }],
                      global: false // 缺省为 false
                    }
                },
            },
            data: [
                {
                    value: 100,
                    symbolPosition: 'end',
                },
                {
                    value: 100,
                    symbolPosition: 'end',
                },
                {
                    value: 100,
                    symbolPosition: 'end',
                },
                {
                    value: 100,
                    symbolPosition: 'end',
                },
                {
                    value: 100,
                    symbolPosition: 'end',
                },
                {
                    value: 100,
                    symbolPosition: 'end',
                },
            ],
        },
        {
            name: '中间立体圆',
            type: 'pictorialBar',
            symbolSize: [80, 25],
            symbolOffset: [0, -10],
            z: 12,
            itemStyle: {
                normal: {
                    color: () =>
                        new echarts.graphic.LinearGradient(1, 1, 0, 0, [
                            {
                                offset: 0,
                                color: '#05a4df',
                            },
                            {
                                offset: 1,
                                color: '#05a4df11',
                            },
                        ]),
                    shadowColor: '#05a4df',
                    shadowBlur: 10,
                    shadowOffsetX: 0,
                    shadowOffsetY: 4,
                },
            },
            data: [
                {
                    value: 40,
                    symbolPosition: 'end',
                },
                {
                    value: 30,
                    symbolPosition: 'end',
                },
                {
                    value: 50,
                    symbolPosition: 'end',
                },
                {
                    value: 80,
                    symbolPosition: 'end',
                },
                {
                    value: 70,
                    symbolPosition: 'end',
                },
                {
                    value: 40,
                    symbolPosition: 'end',
                },
                {
                    value: 90,
                    symbolPosition: 'end',
                },
            ],
        },
        {
            name: '最底部立体圆',
            type: 'pictorialBar',
            symbolSize: [80, 25],
            symbolOffset: [0, 10],
            z: 12,
            itemStyle: {
                normal: {
                    color: () =>
                        new echarts.graphic.LinearGradient(0, 1, 1, 0, [
                            {
                                offset: 0,
                                color: '#05a4df',
                            },
                            {
                                offset: 1,
                                color: '#05a4df11',
                            },
                        ]),
                },
            },
            data: [
                {
                    value: 100-40,
                },
                {
                    value: 100-30,
                },
                {
                    value: 100-50,
                },
                {
                    value: 100-80,
                },
                {
                    value: 100-70,
                },
                {
                    value: 100-40,
                },
                {
                    value: 100-90,
                },
            ],
        },{
            //底部立体柱
            stack: '1',
            type: 'bar',
            itemStyle: {
                normal: {
                    color: () =>
                        new echarts.graphic.LinearGradient(0, 0, 1, 0, [
                            {
                                offset: 0,
                                color: '#05a4dfaa',
                            },
                            {
                                offset: 1,
                                color: '#05a4df55',
                            },
                        ]),
                    opacity: 0.77,
                },
            },
            label:{
                show:true,
                position:'top',
                formatter:'{b}',
                textStyle:{
                    color:"#40e6ff",
                    fontSize:16,
                    fontWeight:600
                }
            },
            silent: true,
            barWidth: 80,
            barGap: '-100%', // Make series be overlap
            data: [40, 30, 50, 80, 70, 40, 90],
        },
        {
            //上部立体柱
            stack: '1',
            type: 'bar',
            itemStyle: {
                normal: {
                    color: () =>
                        new echarts.graphic.LinearGradient(1, 0, 0, 0, [
                            {
                                offset: 0,
                                color: '#47C8FF33',
                            },
                            {
                                offset: 0.05,
                                color: '#47C8FF11',
                            },
                            {
                                offset: 0.15,
                                color: '#47C8FF00',
                            },
                            {
                                offset: 0.85,
                                color: '#47C8FF00',
                            },
                            {
                                offset: 0.95,
                                color: '#47C8FF11',
                            },
                            {
                                offset: 1,
                                color: '#47C8FF33',
                            },
                        ]),
                },
            },
            silent: true,
            barWidth: 80,
            barGap: '-100%', // Make series be overlap
            data: [100-40, 100-30, 100-50, 100-80, 100-70, 100-40, 100-90],
        }
    ]
});

onMounted(() => {
    centerChart.value = echarts.init(centerChartRef.value);
    centerChart.value.setOption(centerChartOptions);

})
</script>

<template>
  <div class="page">
    <Header></Header>
    <el-row :gutter="10" style="width:calc(100vw - 20px);margin-top: 10px;">
      <el-col :span="8">
        <ChartPanel title="某地区事项办理情况">
          <div class="chart-item">
            <LeftChartPanel></LeftChartPanel>
          </div>
        </ChartPanel>
      </el-col>
      <el-col :span="8">
        <div class="center-top">
          <img src="@/assets/images/icon-001.png">
          <div class="center-text">
            <div class="name">服务总数</div>
            <div class="value-panel">
              <div class="empty"></div>
              <div class="value">{{ allCount }}</div>
              <div class="unit">次</div>
              <div class="empty"></div>
            </div>
          </div>
        </div>
        <ChartPanel title="已办理事项排名情况" :bg-img="centerChartBgImg">
          <div class="center-chart-item" ref="centerChartRef">
          </div>
        </ChartPanel>
      </el-col>
      <el-col :span="8">
        <ChartPanel title="办理事项分布情况">
          <div class="chart-item">
            <RightChartPanel></RightChartPanel>
          </div>
        </ChartPanel>
      </el-col>
    </el-row>
  </div>
</template>
<style lang="less" scoped>
.page {
  width: 100vw;
  height: 100vh;
  background: url(@/assets/images/bj.jpg);
  background-size: 100% 100%;

  .chart-item {
    height: calc(100vh - 183px);
  }

  .center-top {
    height: 60vh;
    position: relative;

    img {
      position: absolute;
      left: -3%;
      height: 119%;
    }
    .name{
      color:#fff;
      font-size: 1.4rem;
      font-weight: bold;
      text-align: center;
      padding-top: 29%;
    }
    .value-panel{
      display: flex;
      .value{
        font-size: 3rem;
        color: #40e6ff;
        font-weight: bold;
      }
      .unit{
        color:#fff;
        font-size: 1rem;
        line-height: 90px;
        margin-left: 10px;
      }
      .empty{
        flex:1
      }
    }
  }

  .center-chart-item {
    height: calc(50vh - 273px);
  }
}
</style>- router/index.vue
javascript
import HomeView from '@/views/HomeView.vue'
import { createRouter, createWebHistory } from 'vue-router'

const router = createRouter({
  history: createWebHistory(import.meta.env.BASE_URL),
  routes: [{
    path:'',
    component:HomeView
  }],
})

export default router- RightChartPanel.vue
javascript
<template>
    <div class="chart-item">
        <div class="title">
            <div class="left">
                <img src="@/assets/images/icon-009.png">
            </div>
            <div class="title">
                <div class="text">办理情况</div>
                <div class="title-line"></div>
            </div>
            <div class="right">
                <img src="@/assets/images/icon-009.png">
            </div>
        </div>
        <div class="chart-panel" ref="endChartRef"></div>
    </div>
    <div class="chart-item">
        <div class="title">
            <div class="left">
                <img src="@/assets/images/icon-009.png">
            </div>
            <div class="title">
                <div class="text">办理排名</div>
                <div class="title-line"></div>
            </div>
            <div class="right">
                <img src="@/assets/images/icon-009.png">
            </div>
        </div>
        <div class="chart-panel" ref="scopeChartRef"></div>
    </div>
</template>
<script setup lang="ts">
import { onMounted, reactive, ref } from 'vue';
import * as echarts from "echarts"

const endChartRef = ref();
const endChart = ref();
const datas = reactive( [
        { value: 140, name: '决策环节' },
        { value: 238, name: '办理环节' },
        { value: 332, name: '审核环节' },
        { value: 430, name: '未办环节' },
        { value: 128, name: '已办环节' },
        { value: 226, name: '失效环节' },
]);
const endChartOptions = reactive({
    legend: {
        top: 'center',
        right: '20%',
        orient:'vertical',
        textStyle:{
            color:'#fff',
            lineHeight:20,
            rich: {
                a: {
                   color:'#40e6ff',
                   fontWeight:600
                }
            }
        },
        formatter:function(name){
            let max = datas.reduce((current,item)=>{
                return current+item.value;
            },0);
            let item = datas.find(item=>item.name === name);
            if(item){
                let percient = 0;
                if(max>0){
                    percient = parseFloat(((item.value / max)*100).toFixed(2));
                }
                return item.name +'\n{a|'+item.value+'\t'+percient+'%}';
            }
            return '未知'
        }
    },
    series: [
        {
            name: '办理情况',
            type: 'pie',
            radius: [50, 150],
            center: ['30%', '50%'],
            roseType: 'area',
            itemStyle: {
                borderRadius: 8
            },
            label:{
                show:true,
                position:'center',
                textStyle:{
                    color:'#fff',
                    fontSize:18,
                    lineHeight:20,
                    fontWeight:600
                },
                formatter:'{a}\n{c}个'
            },
            labelLine:{
                show:false,
            },
            data:datas
        }
    ]
});

const scopeChartRef = ref();
const scopeChart = ref();
const scopeChartOptions = reactive({
    grid: {
        left: '10%',
        top: '10%',
        right: '5%',
        bottom: '15%',
        containLabel: false
    },
    xAxis: {
        type: 'category',
        data: ['2001', '2002', '2003', '2004', '2005', '2006'],
        axisLine: {
            show: true,
            lineStyle: {
                color: '#0d1b86'
            }
        },
        axisLabel: {
            color: '#fff'
        },
        splitLine: {
            lineStyle: {
                color: '#0d1b8666'
            }
        }
    },
    yAxis: {
        type: 'value',
        axisLine: {
            show: true,
            lineStyle: {
                color: '#0d1b86'
            }
        },
        axisLabel: {
            color: '#fff'
        },
        splitLine: {
            lineStyle: {
                type: 'dashed',
                color: '#0d1b8666'
            }
        }
    },
    series: [
        {
            name: '办理排名',
            data: [120, 200, 150, 80, 70, 110, 130],
            type: 'bar',
            barWidth: 15,
            barGap: '40%',
            label:{
                show:true,
                position:'top',
                textStyle:{
                    color:"#40e6ff"
                }
            },
            itemStyle: {
                color: {
                    type: 'linear',
                    x: 0,
                    y: 0,
                    x2: 1,
                    y2: 1,
                    colorStops: [{
                        offset: 0, color: '#01b1ff' // 0% 处的颜色
                    }, {
                        offset: 1, color: '#0338ff' // 100% 处的颜色
                    }],
                    global: false // 缺省为 false
                }
            }
        }
    ]
});

onMounted(() => {
    endChart.value = echarts.init(endChartRef.value);
    endChart.value.setOption(endChartOptions);

    scopeChart.value = echarts.init(scopeChartRef.value);
    scopeChart.value.setOption(scopeChartOptions);
})
</script>
<style lang="less" scoped>
.chart-item {
    .title {
        line-height: 30px;
        text-align: center;
        display: flex;
        color: #21e7ff;

        .left,
        .right {
            flex: 1;

            img {
                height: 30%;
            }
        }

        .title {
            width: 100px;
            display: block;

            .text {
                width: 100px;
            }

            .title-line {
                height: 2px;
                width: 100%;
                background: linear-gradient(45deg, #2d77f3, #21e7ff);
            }
        }
    }

    .chart-panel {
        height: calc((100vh - 250px) / 2);
    }
}
</style>- LeftChartPanel.vue
javascript
<template>
    <div class="baseinfo">
        <div class="item item1">
            <div class="icon icon1">
                <img src="@/assets/images/icon-011.png">
            </div>
            <div class="content">
                <div class="name">待办事项</div>
                <div class="value-content">
                    <div class="value">{{ value1 }}</div>
                    <div class="unit">件</div>
                </div>
            </div>
        </div>
        <div class="item item2">
            <div class="icon icon2">
                <img src="@/assets/images/icon-012.png">
            </div>
            <div class="content">
                <div class="name">已办理事项</div>
                <div class="value-content">
                    <div class="value">{{ value2 }}</div>
                    <div class="unit">件</div>
                </div>
            </div>
        </div>
        <div class="item item3">
            <div class="icon icon3">
                <img src="@/assets/images/icon-013.png">
            </div>
            <div class="content">
                <div class="name">办理中事项</div>
                <div class="value-content">
                    <div class="value">{{ value3 }}</div>
                    <div class="unit">件</div>
                </div>
            </div>
        </div>
        <div class="item item4">
            <div class="icon icon4">
                <img src="@/assets/images/icon-014.png">
            </div>
            <div class="content">
                <div class="name">已结束事项</div>
                <div class="value-content">
                    <div class="value">{{ value4 }}</div>
                    <div class="unit">件</div>
                </div>
            </div>
        </div>
    </div>
    <div class="task-chart" ref="taskChartRef">
    </div>
    <div class="department-chart" ref="departmentChartRef"></div>
</template>
<script setup lang="ts">
import { onMounted, reactive, ref } from 'vue';
import * as echarts from "echarts"

const value1 = ref(3435);
const value2 = ref(5436);
const value3 = ref(6547);
const value4 = ref(4365);

const taskChartRef = ref();
const taskChart = ref();
const taskChartOptions = reactive({
    grid:{
        left:'16%',
        top:'3%',
        right:'15%',
        bottom:'3%',
        containLabel:false
    },
    yAxis: {
        type: 'category',
        data: ['已办事项', '未办事项', '待办事项', '完成事项', '超期事项', '审核事项'],
        axisLine:{
            show:false
        },
        axisLabel:{
           color:'#fff'
        }
    },
    xAxis: {
        type: 'value',
        show:false
    },
    series: [
        {
            data: [120, 200, 150, 80, 70, 110, 130],
            type: 'bar',
            barWidth:20,
            itemStyle:{
                color:{
                    type: 'linear',
                    x: 0,
                    y: 0,
                    x2: 1,
                    y2: 1,
                    colorStops: [{
                        offset: 0, color: '#0338ff' // 0% 处的颜色
                    }, {
                        offset: 1, color: '#01b1ff' // 100% 处的颜色
                    }],
                    global: false // 缺省为 false
                }
            },
            label:{
                show:true,
                position:'right',
                color:'#02afff',
                formatter:'{c} 万个',
                fontSize:16
            }
        }
    ]
});

const departmentChartRef = ref();
const departmentChart = ref();
const departmentChartOptions = reactive({
    grid:{
        left:'5%',
        top:'15%',
        right:'5%',
        bottom:'15%',
        containLabel:false
    },
    legend:{
        left:'center',
        top:'3%',
        textStyle:{
            color:'#fff'
        }
    },
    xAxis: {
        type: 'category',
        data: ['人社局', '卫生局', '教育局', '红十字', '公安局', '交通局'],
        axisLine:{
            show:false
        },
        axisLabel:{
           color:'#fff'
        }
    },
    yAxis: {
        type: 'value',
        show:false
    },
    series: [
        {
            name:'表',
            data: [120, 200, 150, 80, 70, 110, 130],
            type: 'bar',
            barWidth:15,
            barGap:'40%',
            itemStyle:{
                color:{
                    type: 'linear',
                    x: 0,
                    y: 0,
                    x2: 1,
                    y2: 1,
                    colorStops: [{
                        offset: 0, color: '#0338ff' // 0% 处的颜色
                    }, {
                        offset: 1, color: '#01b1ff' // 100% 处的颜色
                    }],
                    global: false // 缺省为 false
                }
            }
        },
        {
            name:'接口',
            data: [120, 200, 150, 80, 70, 110, 130],
            type: 'bar',
            barWidth:15,
            barGap:'40%',
            itemStyle:{
                color:{
                    type: 'linear',
                    x: 0,
                    y: 0,
                    x2: 1,
                    y2: 1,
                    colorStops: [{
                        offset: 0, color: '#02948f' // 0% 处的颜色
                    }, {
                        offset: 1, color: '#32fb99' // 100% 处的颜色
                    }],
                    global: false // 缺省为 false
                }
            }
        },{
            name:'文件',
            data: [120, 200, 150, 80, 70, 110, 130],
            type: 'bar',
            barWidth:15,
            barGap:'40%',
            itemStyle:{
                color:{
                    type: 'linear',
                    x: 0,
                    y: 0,
                    x2: 1,
                    y2: 1,
                    colorStops: [{
                        offset: 0, color: '#6842fd' // 0% 处的颜色
                    }, {
                        offset: 1, color: '#2a81af' // 100% 处的颜色
                    }],
                    global: false // 缺省为 false
                }
            }
        }
    ]
});

onMounted(() => {
    taskChart.value = echarts.init(taskChartRef.value);
    taskChart.value.setOption(taskChartOptions);

    departmentChart.value = echarts.init(departmentChartRef.value);
    departmentChart.value.setOption(departmentChartOptions);
})

</script>
<style lang="less" scoped>
.baseinfo {
    display: flex;
    flex-wrap: wrap;

    .item {
        width: 45%;
        margin: 5px;
        display: flex;
        padding: 20px;

        .icon {
            width: 50px;
            height: 50px;
            text-align: center;
            display: flex;
            justify-items: center;
            align-items: center;
            justify-content: center;
            align-content: center;
            border-radius: 50%;
            margin-top: 5px;
        }

        .icon1 {
            background: linear-gradient(45deg, #0337dc, #018ddc);
        }

        .icon2 {
            background: linear-gradient(45deg, #c15e24, #ca9b15);
        }

        .icon3 {
            background: linear-gradient(45deg, #047c82, #29cd8a);
        }

        .icon4 {
            background: linear-gradient(45deg, #4e0aae, #582cb0);
        }

        .content {
            flex: 1;
            padding-top: 0px;
            margin-left: 20px;

            .name {
                line-height: 30px;
                color: #fff;
            }

            .value-content {
                display: flex;

                .value {
                    flex: 1;
                    font-size: 1.2rem;
                    color: #30d7e0;
                    text-align: right;
                    font-weight: bold;
                }

                .unit {
                    font-size: 0.8rem;
                    color: #30d7e0;
                    line-height: 32px;
                    margin-left: 5px;
                }
            }
        }
    }

    .item1 {
        background: url(@/assets/images/icon-005.png);
        background-size: 100% 100%;
    }

    .item2 {
        background: url(@/assets/images/icon-006.png);
        background-size: 100% 100%;
    }

    .item3 {
        background: url(@/assets/images/icon-007.png);
        background-size: 100% 100%;
    }

    .item4 {
        background: url(@/assets/images/icon-008.png);
        background-size: 100% 100%;
    }
}

.task-chart {
    border-top: 1px dotted #5544c7;
    border-bottom: 1px dotted #5544c7;
    height: 32vh;
}
.department-chart {
    height: 23vh;
}
</style>- Header.vue
javascript
<script setup lang="ts">
</script>

<template>
    <div class="header">
        <div class="left"></div>
        <div class="title">军军君政务服务大数据</div>
        <div class="left"></div>
    </div>
</template>
<style lang="less" scoped>
    .header{
        background: url(@/assets/images/icon-002.png);
        background-size: 100% 100%;
        height: 118px;
        display: flex;

        .left,.right{
            flex:1
        }
        .title{
            line-height: 100px;
            color: #fff;
            font-size: 2rem;
            font-weight: bold;
            letter-spacing: 10px;
            text-shadow: -5px 2px 8px #00BCD4;
        }
    }
</style>- ChartPanel.vue
javascript
<template>
    <div class="chart-panel" :style="{ 'background-image':' url('+ bgImg +')' }">
        <div class="title">{{ title }}</div>
        <div class="content">
            <slot></slot>
        </div>
    </div>
</template>
<script setup lang="ts">

const props = defineProps({
    title:String,
    bgImg:{
        type:String,
        default:new URL('@/assets/images/icon-003.png', import.meta.url).href
    }
});
</script>
<style lang="less" scoped>
    .chart-panel{
        background-size: 100% 100%;

        .title{
            line-height: 40px;
            text-align: center;
            color: #2fd5ff;
        }
    }
</style>- main.css
javascript
@import './base.css';

#app {
  font-weight: normal;
}

a,
.green {
  text-decoration: none;
  color: hsla(160, 100%, 37%, 1);
  transition: 0.4s;
}

@media (hover: hover) {
  a:hover {
    background-color: hsla(160, 100%, 37%, 0.2);
  }
}

@media (min-width: 1024px) {
  body {
  }

  #app {
  }
}- base.css
javascript
/* color palette from <https://github.com/vuejs/theme> */
:root {
  --vt-c-white: #ffffff;
  --vt-c-white-soft: #f8f8f8;
  --vt-c-white-mute: #f2f2f2;

  --vt-c-black: #181818;
  --vt-c-black-soft: #222222;
  --vt-c-black-mute: #282828;

  --vt-c-indigo: #2c3e50;

  --vt-c-divider-light-1: rgba(60, 60, 60, 0.29);
  --vt-c-divider-light-2: rgba(60, 60, 60, 0.12);
  --vt-c-divider-dark-1: rgba(84, 84, 84, 0.65);
  --vt-c-divider-dark-2: rgba(84, 84, 84, 0.48);

  --vt-c-text-light-1: var(--vt-c-indigo);
  --vt-c-text-light-2: rgba(60, 60, 60, 0.66);
  --vt-c-text-dark-1: var(--vt-c-white);
  --vt-c-text-dark-2: rgba(235, 235, 235, 0.64);
}

/* semantic color variables for this project */
:root {
  --color-background: var(--vt-c-white);
  --color-background-soft: var(--vt-c-white-soft);
  --color-background-mute: var(--vt-c-white-mute);

  --color-border: var(--vt-c-divider-light-2);
  --color-border-hover: var(--vt-c-divider-light-1);

  --color-heading: var(--vt-c-text-light-1);
  --color-text: var(--vt-c-text-light-1);

  --section-gap: 160px;
}

@media (prefers-color-scheme: dark) {
  :root {
    --color-background: var(--vt-c-black);
    --color-background-soft: var(--vt-c-black-soft);
    --color-background-mute: var(--vt-c-black-mute);

    --color-border: var(--vt-c-divider-dark-2);
    --color-border-hover: var(--vt-c-divider-dark-1);

    --color-heading: var(--vt-c-text-dark-1);
    --color-text: var(--vt-c-text-dark-2);
  }
}

*,
*::before,
*::after {
  box-sizing: border-box;
  margin: 0;
  font-weight: normal;
}

body {
  color: var(--color-text);
  background: var(--color-background);
  transition:
    color 0.5s,
    background-color 0.5s;
  line-height: 1.6;
  font-family:
    Inter,
    -apple-system,
    BlinkMacSystemFont,
    'Segoe UI',
    Roboto,
    Oxygen,
    Ubuntu,
    Cantarell,
    'Fira Sans',
    'Droid Sans',
    'Helvetica Neue',
    sans-serif;
  font-size: 15px;
  text-rendering: optimizeLegibility;
  -webkit-font-smoothing: antialiased;
  -moz-osx-font-smoothing: grayscale;
  margin: 0;
  padding: 0;
}- index.html
javascript
<!DOCTYPE html>
<html lang="">
  <head>
    <meta charset="UTF-8">
    <link rel="icon" href="/favicon.ico">
    <meta name="viewport" content="width=device-width, initial-scale=1.0">
    <title>军军君政务服务大数据</title>
  </head>
  <body>
    <div id="app"></div>
    <script type="module" src="/src/main.ts"></script>
  </body>
</html>- package.json
javascript
{
  "name": "government-service",
  "version": "0.0.0",
  "private": true,
  "type": "module",
  "scripts": {
    "dev": "vite",
    "build": "run-p type-check \"build-only {@}\" --",
    "preview": "vite preview",
    "build-only": "vite build",
    "type-check": "vue-tsc --build"
  },
  "dependencies": {
    "echarts": "^6.0.0",
    "element-plus": "^2.13.7",
    "pinia": "^3.0.4",
    "vue": "^3.5.31",
    "vue-router": "^5.0.4"
  },
  "devDependencies": {
    "@tsconfig/node24": "^24.0.4",
    "@types/node": "^24.12.0",
    "@vitejs/plugin-vue": "^6.0.5",
    "@vue/tsconfig": "^0.9.1",
    "less": "^4.6.4",
    "npm-run-all2": "^8.0.4",
    "typescript": "~6.0.0",
    "vite": "^8.0.3",
    "vite-plugin-vue-devtools": "^8.1.1",
    "vue-tsc": "^3.2.6"
  },
  "engines": {
    "node": "^20.19.0 || >=22.12.0"
  }
}