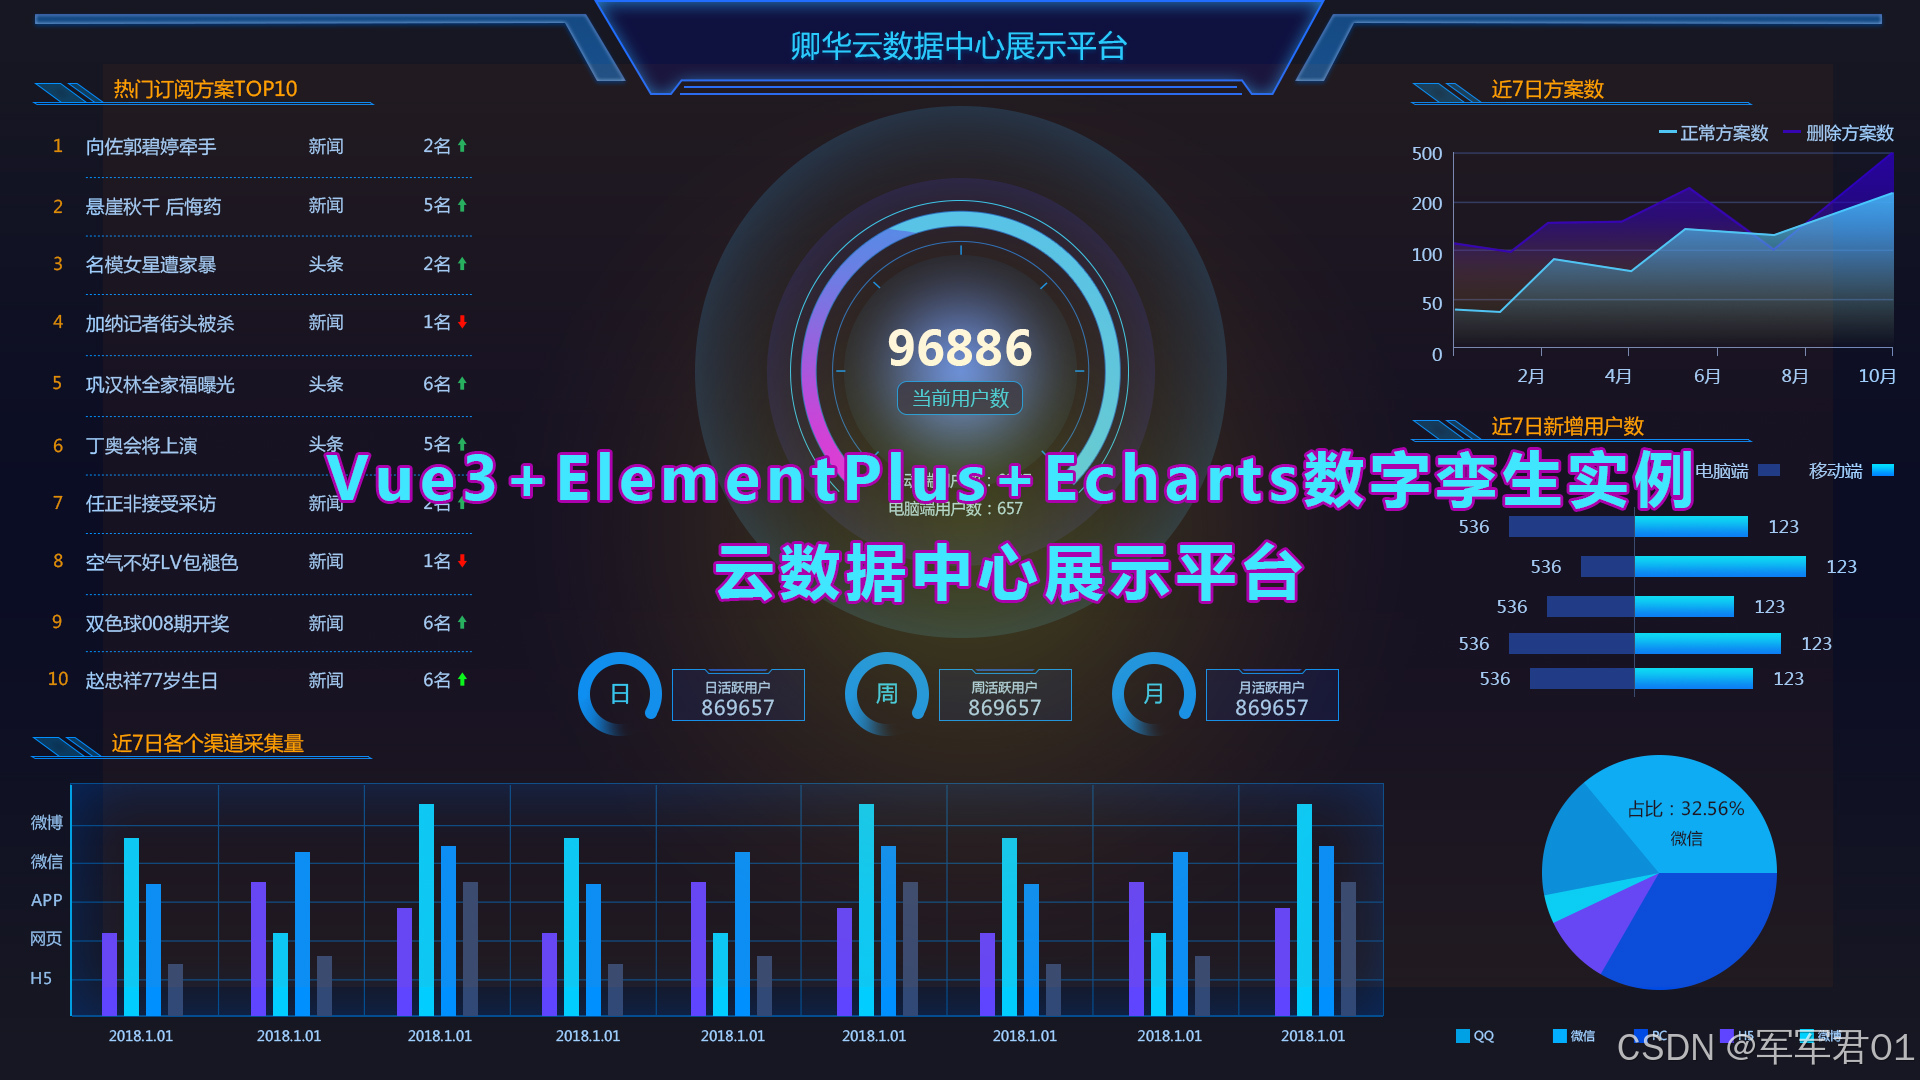
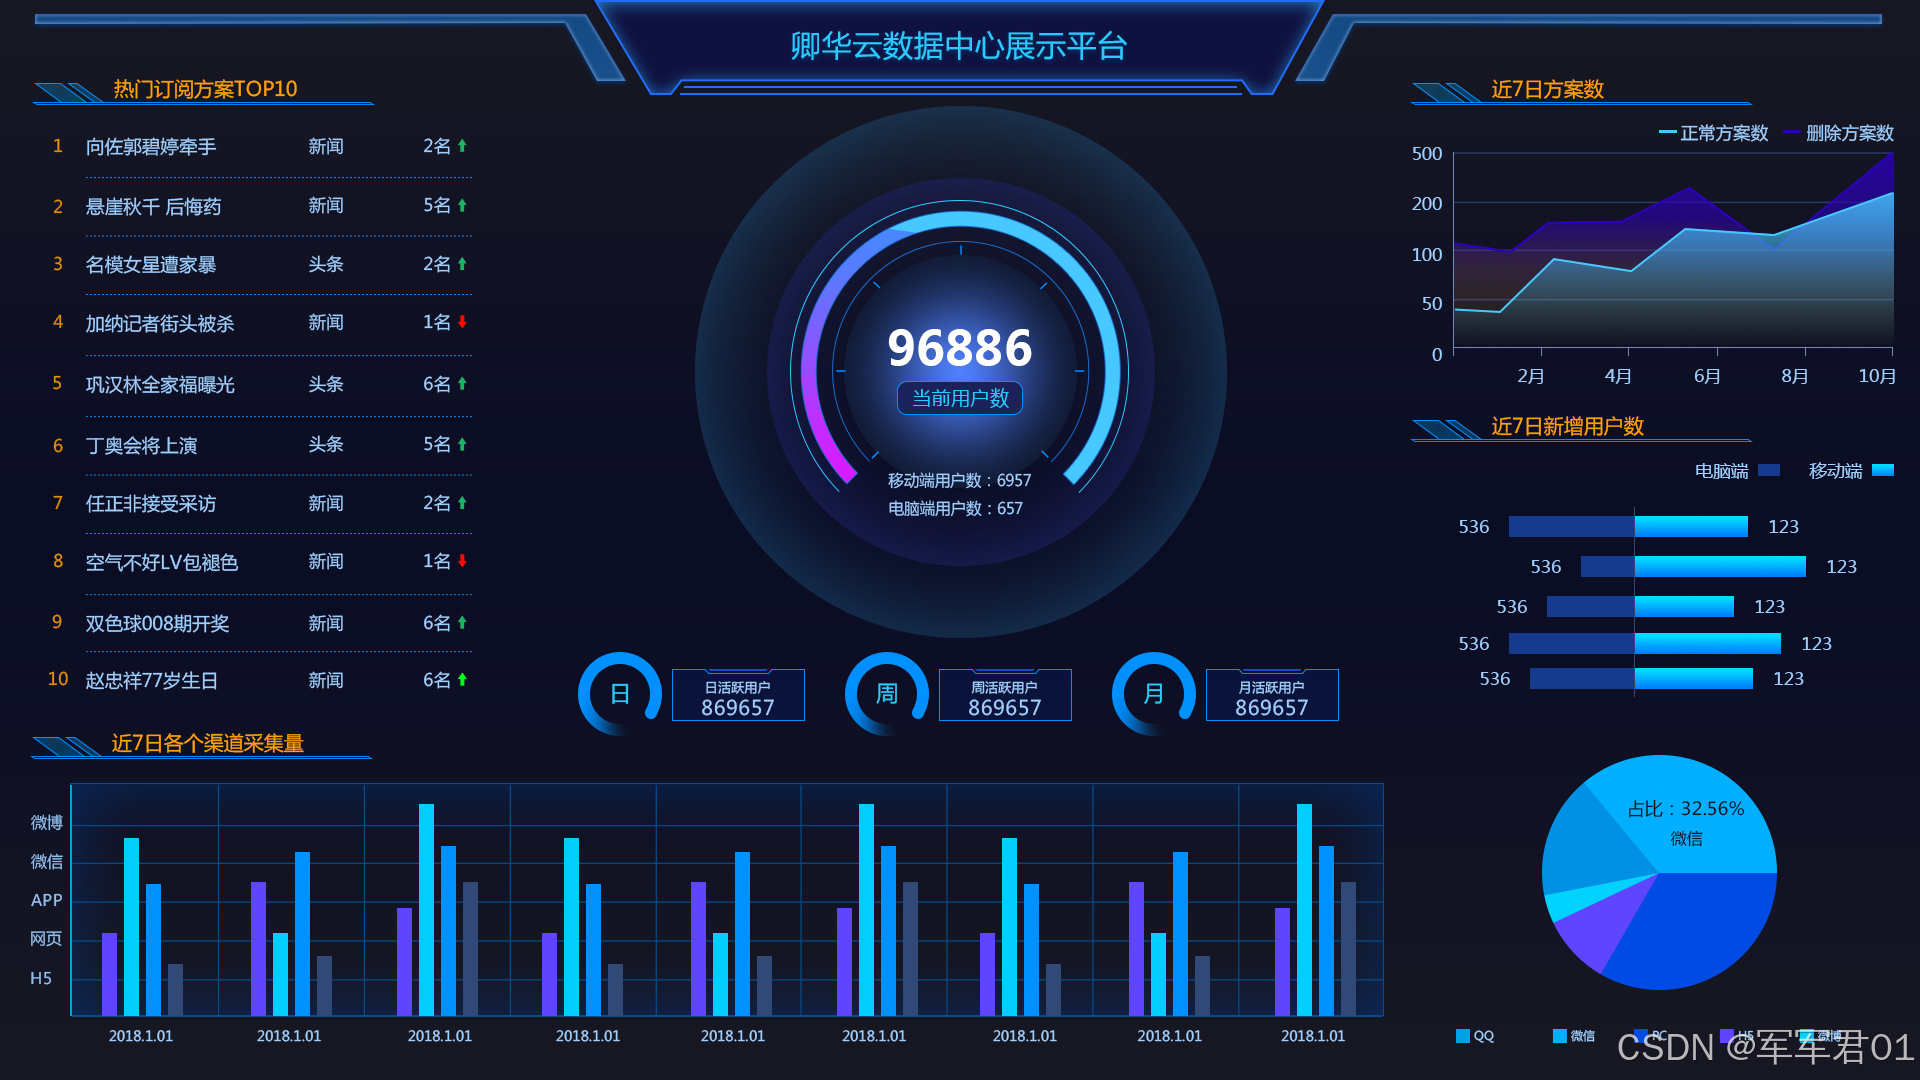
前端数字孪生大屏,使用VUE3+Elementplus+Echarts+TS实现云数据中心展示平台,数字孪生,监控大屏展示,可下载作为课堂作业、界面模板、扩展开发,个人作品等。
若想系统学习Echarts开发,我的课程提供了完整的Echarts基础知识讲解并附加大量实战案例,系列课程地址如下:
1. CSDN课程:https://edu.csdn.net/course/detail/40842
2. 51学堂课程:https://edu.51cto.com/course/40414.html
3. B站课程:https://www.bilibili.com/cheese/play/ss456500998
一.效果展示:
二.源码下载:
三.开发视频:
https://www.bilibili.com/video/BV1zDowBLEBy/
四.实现明细:
4.1 开发环境
使用vscode开发,nodejs版本为v24.11.0,其它项目依赖如下:
1. "dayjs": "^1.11.20"
2. "echarts": "^6.0.0"
3. "element-plus": "^2.13.6"
4. "less": "^4.6.4"
5. "pinia": "^3.0.4"
6. "vue": "^3.5.31"
7. "vue-router": "^5.0.4"
4.2 实现明细
- main.ts
javascript
import { createApp } from 'vue'
import { createPinia } from 'pinia'

import App from './App.vue'
import router from './router'
import ElementPlus from 'element-plus'
import 'element-plus/dist/index.css'
const app = createApp(App)

app.use(createPinia())
app.use(router)
app.use(ElementPlus)

app.mount('#app')- App.vue
javascript
<script setup lang="ts"></script>

<template>
  <RouterView></RouterView>
</template>

<style >
@import url("@/assets/main.css");
</style>- HomeView.vue
javascript
<script setup lang="ts">
import ChartItem from '@/components/ChartItem.vue';
import DataFromChartItem from '@/components/DataFromChartItem.vue';
import Header from '@/components/Header.vue';
import PlanTop10ChartItem from '@/components/PlanTop10ChartItem.vue';
import CenterChartItem from '@/components/CenterChartItem.vue';
import CountChartItem from '@/components/CountChartItem.vue';
import UserChartItem from '@/components/UserChartItem.vue';
</script>

<template>
  <div class="page">
    <Header></Header>
    <el-row>
      <el-col :span="18">
        <div class="top">
          <el-row>
            <el-col :span="6">
              <ChartItem title="热门订阅方案TOP10">
                <div class="char-item-2">
                  <PlanTop10ChartItem></PlanTop10ChartItem>
                </div>
              </ChartItem>
            </el-col>
            <el-col :span="18">
              <CenterChartItem></CenterChartItem>
            </el-col>
          </el-row>
        </div>
        <div class="bottom">
          <ChartItem title="近7日各个渠道采集量">
            <div class="char-item">
              <DataFromChartItem></DataFromChartItem>
            </div>
          </ChartItem>
        </div>
      </el-col>
      <el-col :span="6">
          <ChartItem title="近7日方案数">
            <div class="char-item">
              <CountChartItem></CountChartItem>
            </div>
          </ChartItem>
          <ChartItem title="近7日新增用户数">
            <div class="char-item-2">
              <UserChartItem></UserChartItem>
            </div>
          </ChartItem>
      </el-col>
    </el-row>
  </div>
</template>
<style lang="less" scoped>
  .page{
    width:100vw;
    height: 100vh;
    background: url(@/assets/images/bg.jpg);
    background-size: 100% 100%;

    .char-item{
      height: calc(33vh - 20px);
    }
    .char-item-2{
      height: calc(66vh - 131px);
    }
  }
</style>- router/index.ts
javascript
import HomeView from '@/views/HomeView.vue'
import { createRouter, createWebHistory } from 'vue-router'

const router = createRouter({
  history: createWebHistory(import.meta.env.BASE_URL),
  routes: [{
    path:"",
    component:HomeView
  }],
})

export default router- UserChartItem.vue
javascript
<template>
    <div class="chart-item" ref="chartRef"></div>
    <div class="chart-item" ref="pieChartRef"></div>
</template>
<script setup lang="ts">
import { onMounted, reactive, ref } from 'vue';
import * as echarts from "echarts";

const chartRef = ref();
const chart = ref();
const chartOptions = reactive({
    grid:{
        left:'5%',
        top:'10%',
        bottom:'0%',
        right:'5%',
        containLable:false
    },
    yAxis: {
        type: 'category',
        data: ['2021-12-01', '2021-12-02', '2021-12-03', '2021-12-04', '2021-12-05', '2021-12-06', '2021-12-07', '2021-12-08', '2021-12-09', '2021-12-10'],
        axisLine:{
            show:true
        },
        axisLabel:{
            show:false
        }
    },
    xAxis: {
        type: 'value',
        show:false
    },
    legend:{
        top:'1%',
        right:'1%',
        textStyle:{
            color:'#fff'
        }
    },
    series: [
        {
            name:'电脑端',
            data: [120, 200, 150, 80, 70, 110, 130, 432, 766, 234],
            type: 'bar',
            barWidth:15,
            itemStyle:{
                color:{
                    type: 'linear',
                    x: 0,
                    y: 0,
                    x2: 0,
                    y2: 1,
                    colorStops: [{
                        offset: 0, color: '#0095ff' // 0% 处的颜色
                    }, {
                        offset: 1, color: '#008bff' // 100% 处的颜色
                    }],
                    global: false // 缺省为 false
                }
            },
            label:{
                show:true,
                position:'right',
                textStyle:{
                    color:'#fff'
                }
            }
        },
        {
            name:'移动端',
            // xAxisIndex:1,
            data: [-120, -200, -150, -80, -70, -110, -130, -432, -766, -234],
            type: 'bar',
            barWidth:15,
            barGap:'-100%',
            itemStyle:{
                color:{
                    type: 'linear',
                    x: 0,
                    y: 0,
                    x2: 0,
                    y2: 1,
                    colorStops: [{
                        offset: 0, color: '#163a8d' // 0% 处的颜色
                    }, {
                        offset: 1, color: '#163a8d' // 100% 处的颜色
                    }],
                    global: false // 缺省为 false
                }
            },
            label:{
                show:true,
                position:'left',
                formatter:function(pama){
                    return -pama.value;
                },
                textStyle:{
                    color:'#fff'
                }
            }
        }
    ]
});
const pieChartRef = ref();
const pieChart = ref();
const pieChartOptions = reactive({
    color:['#02afff','#004be4','#5f45ff','#00d2ff','#0091e4'],
    legend: {
        left: 'center',
        bottom:'1%',
        textStyle:{
            color:'#fff'
        }
    },
    series: [
        {
            name: '用户占比',
            type: 'pie',
            radius: '60%',
            data: [
                { value: 1048, name: 'QQ' },
                { value: 735, name: '微信' },
                { value: 580, name: '微博' },
                { value: 484, name: 'PC' },
                { value: 300, name: 'H5' }
            ],
            label:{
                textStyle:{
                    color:'#fff'
                }
            }
        }
    ]
});
onMounted(()=>{
    chart.value = echarts.init(chartRef.value);
    chart.value.setOption(chartOptions);

    pieChart.value = echarts.init(pieChartRef.value);
    pieChart.value.setOption(pieChartOptions);
})
</script>
<style lang="less" scoped>
    .chart-item{
        height: 50%;
    }
</style>- PlanTop10ChartItem.vue
javascript
<template>
    <div class="tr" v-for="(item,index) in datas">
        <div class="td index">{{ index+1 }}</div>
        <div class="td name">{{ item.name }}</div>
        <div class="td type">{{ item.type }}</div>
        <div class="td scope">{{ item.scope }}次<text class="up" :class="[item.up?'up':'down']">{{ item.up?'↑':'↓' }}</text></div>
    </div>
</template>
<script setup lang="ts">
import { reactive } from 'vue';

const datas = reactive([{
    name:'XXXX新闻信息001',
    type:'新闻',
    scope:12,
    up:false
},{
    name:'XXXX新闻信息002',
    type:'新闻',
    scope:432,
    up:true
},{
    name:'XXXX新闻信息003',
    type:'头条',
    scope:32,
    up:false
},{
    name:'XXXX新闻信息004',
    type:'新闻',
    scope:56,
    up:false
},{
    name:'XXXX新闻信息005',
    type:'新闻',
    scope:32,
    up:true
},{
    name:'XXXX新闻信息006',
    type:'新闻',
    scope:43,
    up:false
},{
    name:'XXXX新闻信息007',
    type:'娱乐',
    scope:65,
    up:false
},{
    name:'XXXX新闻信息008',
    type:'娱乐',
    scope:87,
    up:true
},{
    name:'XXXX新闻信息009',
    type:'娱乐',
    scope:76,
    up:true
},{
    name:'XXXX新闻信息010',
    type:'娱乐',
    scope:876,
    up:true
}])
</script>
<style lang="css" scoped>
    .tr{
        display: flex;
        line-height: 45px;
        color:#9fceff;

        .index{
            width:20px;
            text-align: center;
            color: #de8d05;
        }
        .name{
            flex:1;
            border-bottom: 1px dotted #0090ff;
        }
        .type{
           width:80px;
           text-align: center;
            border-bottom: 1px dotted #0090ff;
        }
        .scope{
           width:80px;
           text-align: right;
            border-bottom: 1px dotted #0090ff;

           .up{
            margin-left: 5px;
            font-weight: bold;
            color:#1db364
           }
           .down{
            margin-left: 5px;
            font-weight: bold;
            color:#ff0800
           }
        }
    }
</style>- Header.vue
javascript
<template>
    <div class="header">
        <img src="@/assets/images/icon-002.png">
        <div class="left"></div>
        <div class="title">
            军军君数据中心展示平台
        </div>
        <div class="right"></div>
    </div>
</template>
<script setup lang="ts">
</script>
<style lang="less" scoped>
    .header{
        height: 80px;
        position: relative;
        display: flex;
        .left,.right{
            flex:1
        }
        .title{
            line-height: 60px;
            text-align: center;
            font-size: 1.8rem;
            color: #2acaff;
            z-index: 1;
            letter-spacing: 5px;
        }
        img{
            position: absolute;
            left:13%;
            top:-4px;
            height: 100%;
        }
    }
</style>- DataFromChartItem.vue
javascript
<template>
    <div class="chart-item" ref="chartRef"></div>
</template>
<script setup lang="ts">
import { onMounted, reactive, ref } from 'vue';
import * as echarts from "echarts";

const chartRef = ref();
const chart = ref();
const chartOptions = reactive({
    grid:{
        left:'5%',
        top:'5%',
        bottom:'5%',
        right:'5%',
        containLable:false
    },
    xAxis: {
        type: 'category',
        data: ['2021-12-01', '2021-12-02', '2021-12-03', '2021-12-04', '2021-12-05', '2021-12-06', '2021-12-07', '2021-12-08', '2021-12-09', '2021-12-10'],
        axisLabel:{
            textStyle:{
                color:'#91bdeb'
            }
        },
        splitLine:{
            show:true,
            lineStyle:{
                color:'#0a2c54',
                type:'dashed'
            }
        },
        axisLine:{
            lineStyle:{
                color:'#0a2c54',
            }
        }
    },
    yAxis: {
        type: 'value',
        axisLabel:{
            textStyle:{
                color:'#91bdeb'
            }
        },
        splitLine:{
            lineStyle:{
                color:'#0a2c54',
                type:'dashed'
            }
        },
        axisLine:{
            show:true,
            lineStyle:{
                color:'#0a2c54',
            }
        }
    },
    series: [
        {
            name:'H5',
            data: [120, 200, 150, 80, 70, 110, 130, 432, 766, 234],
            type: 'bar',
            barWidth:15,
            itemStyle:{
                color:{
                    type: 'linear',
                    x: 0,
                    y: 0,
                    x2: 0,
                    y2: 1,
                    colorStops: [{
                        offset: 0, color: '#5f45ff' // 0% 处的颜色
                    }, {
                        offset: 1, color: '#392e95' // 100% 处的颜色
                    }],
                    global: false // 缺省为 false
                }
            }
        },{
            name:'微信',
            data: [54, 768, 98, 455, 35, 768, 234, 679, 168, 432],
            type: 'bar',
            barWidth:15,
            itemStyle:{
                color:{
                    type: 'linear',
                    x: 0,
                    y: 0,
                    x2: 0,
                    y2: 1,
                    colorStops: [{
                        offset: 0, color: '#02cdff' // 0% 处的颜色
                    }, {
                        offset: 1, color: '#02cdff' // 100% 处的颜色
                    }],
                    global: false // 缺省为 false
                }
            }
        },{
            name:'微博',
            data: [54, 657, 782, 21, 323, 433, 543, 564, 867, 342],
            type: 'bar',
            barWidth:15,
            itemStyle:{
                color:{
                    type: 'linear',
                    x: 0,
                    y: 0,
                    x2: 0,
                    y2: 1,
                    colorStops: [{
                        offset: 0, color: '#0090ff' // 0% 处的颜色
                    }, {
                        offset: 1, color: '#0d84df' // 100% 处的颜色
                    }],
                    global: false // 缺省为 false
                }
            }
        },{
            name:'APP',
            data: [435, 353, 150, 274, 82, 961, 543, 453, 432, 432],
            type: 'bar',
            barWidth:15,
            itemStyle:{
                color:{
                    type: 'linear',
                    x: 0,
                    y: 0,
                    x2: 0,
                    y2: 1,
                    colorStops: [{
                        offset: 0, color: '#314976' // 0% 处的颜色
                    }, {
                        offset: 1, color: '#2251aa' // 100% 处的颜色
                    }],
                    global: false // 缺省为 false
                }
            }
        }
    ]
});
onMounted(()=>{
    chart.value = echarts.init(chartRef.value);
    chart.value.setOption(chartOptions);
})
</script>
<style lang="less" scoped>
    .chart-item{
        height: 100%;
    }
</style>- CountChartItem.vue
javascript
<template>
    <div class="chart-item" ref="chartRef"></div>
</template>
<script setup lang="ts">
import { onMounted, reactive, ref } from 'vue';
import * as echarts from "echarts";

const chartRef = ref();
const chart = ref();
const chartOptions = reactive({
    grid:{
        left:'5%',
        top:'12%',
        bottom:'5%',
        right:'2%',
        containLable:false
    },
    legend:{
        top:'1%',
        right:'1%',
        textStyle:{
            color:'#fff'
        }
    },
    xAxis: {
        type: 'category',
        data: ['1月', '2月', '3月', '4月', '5月', '6月', '7月', '8月', '9月', '10月'],
        axisLabel:{
            textStyle:{
                color:'#91bdeb'
            }
        },
        splitLine:{
            show:true,
            lineStyle:{
                color:'#0a2c54',
                type:'dashed'
            }
        },
        axisLine:{
            lineStyle:{
                color:'#0a2c54',
            }
        }
    },
    yAxis: {
        type: 'value',
        axisLabel:{
            textStyle:{
                color:'#91bdeb'
            }
        },
        splitLine:{
            lineStyle:{
                color:'#0a2c54',
                type:'dashed'
            }
        }
    },
    series: [
        {
            name:'正常方案数',
            data: [120, 200, 150, 80, 70, 110, 130, 432, 766, 234],
            type: 'line',
            stack: 'Total',
            areaStyle: {
                opacity: 0.8,
                color: new echarts.graphic.LinearGradient(0, 0, 0, 1, [
                    {
                        offset: 0,
                        color: '#91bdeb55'
                    },
                    {
                        offset: 1,
                        color: '#91bdeb22'
                    }
                ])
            }
        },{
            name:'删除方案数',
            data: [54, 768, 98, 455, 35, 768, 234, 679, 168, 432],
            type: 'line',
            stack: 'Total',
            areaStyle: {
                opacity: 0.8,
                color: new echarts.graphic.LinearGradient(0, 0, 0, 1, [
                    {
                        offset: 0,
                        color: '#0a2c5455'
                    },
                    {
                        offset: 1,
                        color: '#0a2c54'
                    }
                ])
            }
        }
    ]
});
onMounted(()=>{
    chart.value = echarts.init(chartRef.value);
    chart.value.setOption(chartOptions);
})
</script>
<style lang="less" scoped>
    .chart-item{
        height: 100%;
    }
</style>- ChartItem.vue
javascript
<template>
    <div class="chart-item">
        <div class="title">
            <div class="text">{{ title }}</div>
            <img src="@/assets/images/icon-003.png">
            <div class="line"></div>
        </div>
        <slot></slot>
    </div>
</template>
<script setup lang="ts">

const porps = defineProps({
    title:String
})

</script>
<style lang="less" scoped>
    .chart-item{
        margin: 5px;
        .title{
            color: #ffa200;
            line-height: 30px;
            position: relative;
            padding-left: 80px;

            img{
                position: absolute;
                bottom: 0;
                left:5px;
            }
            .line{
                position: absolute;
                left: 0;
                height: 2px;
                width:80%;
                bottom: 0;
                background: #0483f0;
                max-width: 400px;
            }
        }
    }
</style>- CenterChartItem.vue
javascript
<template>
    <div class="scope-chart" ref="scopeChartRef"></div>
    <div class="date-chart" >
        <div class="chart-item">
            <div class="process">
                <el-progress type="circle" width="80" :stroke-width="16" :percentage="value1" :format="()=>'日'"/>
            </div>
            <div class="content">
                <div class="title">日活跃用户</div>
                <div class="value">{{ value1 }}</div>
            </div>
        </div>
        <div class="chart-item">
            <div class="process">
                <el-progress type="circle" width="80" :stroke-width="16" :percentage="value2" :format="()=>'周'"/>
            </div>
            <div class="content">
                <div class="title">周活跃用户</div>
                <div class="value">{{ value2 }}</div>
            </div>
        </div>
        <div class="chart-item">
            <div class="process">
                <el-progress type="circle" width="80" :stroke-width="16"  :percentage="value3" :format="()=>'月'"/>
            </div>
            <div class="content">
                <div class="title">月活跃用户</div>
                <div class="value">{{ value3 }}</div>
            </div>
        </div>
    </div>
</template>
<script setup lang="ts">
    import { onMounted, reactive ,ref} from 'vue';
    import * as echarts from "echarts";

    const value1 = ref(42);
    const value2 = ref(65);
    const value3 = ref(87);


    const scopeChartRef = ref();
    const scopeChart = ref();
    const scopeChartOptions = reactive({
        title: {
            show: true,
            text: '{a|当前用户数}',
            x: '50%',
            y: '55%',
            z: 10,
            textAlign: 'center',
            textStyle: {
                color: '#ffffff',
                fontSize: 14,
                rich:{
                    a:{
                        backgroundColor: '#1b225baa',
                        borderColor: '#0d197d66',
                        borderWidth:1,
                        borderRadius: 4,
                        padding:5
                    }
                }
            }
        },
        series: [
            {
                name: "内部进度条",
                type: "gauge",
                radius: '60%',
                splitNumber: 6,
                axisLine: {
                    lineStyle: {
                        color: [
                            [40 / 100, '#d420ff'],
                            [1, "#47c8ff22"]
                        ],
                        width: 10
                    }
                },
                axisLabel: {
                    show: false,
                },
                axisTick: {
                    show: false,
                },
                splitLine: {
                    show: false,
                },
                pointer: {
                    show: false,
                },
            },
            {
                name: '外部刻度',
                type: 'gauge',
                radius: '60%',
                min: 0, //最小刻度
                max: 100, //最大刻度
                splitNumber: 10, //刻度数量
                startAngle: 220,
                endAngle: -40,
                axisLine: {
                    show: false,
                },
                //仪表盘轴线
                axisLabel: {
                    show: false,
                },
				//刻度标签
                axisTick: {
                    show: true,
                    splitNumber: 6,
                    lineStyle: {
                        color: '#00faff', //用颜色渐变函数不起作用
                        width: 1,
                    },
                    length: -5
                },
				//刻度样式
                splitLine: {
                    show: true,
                    length: -8,
                    lineStyle: {
                        color: '#00faff', //用颜色渐变函数不起作用
                        width: 1,
                    }
                }, //分隔线样式
                detail: {
                    show: false
                },
                pointer: {
                    show: false
                }
            },
            /*内部*/
            {
                type: 'pie',
                radius:  ['0', '40%'],
                z: 3,
                hoverAnimation: false,
                data: [{
                    name: '合规率',
                    value: 75.85,
                    itemStyle: {
                        normal: {
                            color:
                            {
                                type: 'radial',
                                x: 0.5,
                                y: 0.5,
                                r: 0.5,
                                colorStops: [{
                                    offset: 0, color: '#025ebb' // 0% 处的颜色
                                }, {
                                    offset: 1, color: '#025ebb22' // 100% 处的颜色
                                }],
                                global: false // 缺省为 false
                            }
                        }
                    },
                    label: {
                        normal: {
                            rich: {
                                a: {
                                    color: '#ffffff',
                                    align: 'center',
                                    fontSize: 28,
                                },
                            },
                            formatter: function (params) {
                                return "{a|" + params.value + "%"+"}";
                            },
                            position: 'center',
                            show: true
                        }
                    },
                    labelLine: {
                        show: false
                    }
                }],
            },
            /*外一层*/
            {
				type: "pie",
                radius:  ['0', '80%'],
                avoidLabelOverlap: false,
                z: 1,
                hoverAnimation: false,
                label: {
                    show: false
                },
                labelLine: {
                    show: false
                },
                data: [{
                    "value": 1
                }],
                itemStyle: {
                    normal: {
						color: 'rgba(0,131,255,0.05)',
                    }
                }
            },
            //外二层圈
            {
                type: "pie",
                radius:  ['0', '100%'],
                avoidLabelOverlap: false,
                z: 0,
                hoverAnimation: false,
                label: {
                    show: false
                },
                labelLine: {
                    show: false
                },
                data: [{
                    "value": 1
                }],
                itemStyle: {
                    normal: {
						color: 'rgba(0,131,255,0.05)',
                    }
                }
            }
        ]
    })
    onMounted(()=>{
        scopeChart.value = echarts.init(scopeChartRef.value);
        scopeChart.value.setOption(scopeChartOptions);

    })
</script>
<style lang="less" scoped>
    .scope-chart{
        height: 45vh;
    }
    .date-chart{
        height: 10vh;
        display: flex;
        padding-top: 20px;
        .chart-item{
            flex:1;
            display: flex;
            .process{
                width:40%;
                display: flex;
                justify-content: center;
                justify-items: center;
                align-items: center;
                align-content: center;

                :deep(.el-progress__text){
                    font-size: 1.2rem !important;
                    color: #2bcbff
                }
            }
            .content{
                flex:1;
                margin-left: 10px;
                padding: 20px 0;
                background: url(@/assets/images/icon-001.png);
                background-size: 100% 100%;
                text-align: center;
                .title{
                    color: #9fceff;
                }
                .value{
                    color: #9fceff;
                }
            }
        }
    }
</style>- main.css
javascript
@import './base.css';

#app {
  font-weight: normal;
}

a,
.green {
  text-decoration: none;
  color: hsla(160, 100%, 37%, 1);
  transition: 0.4s;
  padding: 3px;
}

@media (hover: hover) {
  a:hover {
    background-color: hsla(160, 100%, 37%, 0.2);
  }
}

@media (min-width: 1024px) {
  body {
  }

  #app {
  }
}- base.css
javascript
/* color palette from <https://github.com/vuejs/theme> */
:root {
  --vt-c-white: #ffffff;
  --vt-c-white-soft: #f8f8f8;
  --vt-c-white-mute: #f2f2f2;

  --vt-c-black: #181818;
  --vt-c-black-soft: #222222;
  --vt-c-black-mute: #282828;

  --vt-c-indigo: #2c3e50;

  --vt-c-divider-light-1: rgba(60, 60, 60, 0.29);
  --vt-c-divider-light-2: rgba(60, 60, 60, 0.12);
  --vt-c-divider-dark-1: rgba(84, 84, 84, 0.65);
  --vt-c-divider-dark-2: rgba(84, 84, 84, 0.48);

  --vt-c-text-light-1: var(--vt-c-indigo);
  --vt-c-text-light-2: rgba(60, 60, 60, 0.66);
  --vt-c-text-dark-1: var(--vt-c-white);
  --vt-c-text-dark-2: rgba(235, 235, 235, 0.64);
}

/* semantic color variables for this project */
:root {
  --color-background: var(--vt-c-white);
  --color-background-soft: var(--vt-c-white-soft);
  --color-background-mute: var(--vt-c-white-mute);

  --color-border: var(--vt-c-divider-light-2);
  --color-border-hover: var(--vt-c-divider-light-1);

  --color-heading: var(--vt-c-text-light-1);
  --color-text: var(--vt-c-text-light-1);

  --section-gap: 160px;
}

@media (prefers-color-scheme: dark) {
  :root {
    --color-background: var(--vt-c-black);
    --color-background-soft: var(--vt-c-black-soft);
    --color-background-mute: var(--vt-c-black-mute);

    --color-border: var(--vt-c-divider-dark-2);
    --color-border-hover: var(--vt-c-divider-dark-1);

    --color-heading: var(--vt-c-text-dark-1);
    --color-text: var(--vt-c-text-dark-2);
  }
}

*,
*::before,
*::after {
  box-sizing: border-box;
  margin: 0;
  font-weight: normal;
}

body {
  color: var(--color-text);
  background: var(--color-background);
  transition:
    color 0.5s,
    background-color 0.5s;
  line-height: 1.6;
  font-family:
    Inter,
    -apple-system,
    BlinkMacSystemFont,
    'Segoe UI',
    Roboto,
    Oxygen,
    Ubuntu,
    Cantarell,
    'Fira Sans',
    'Droid Sans',
    'Helvetica Neue',
    sans-serif;
  font-size: 15px;
  text-rendering: optimizeLegibility;
  -webkit-font-smoothing: antialiased;
  -moz-osx-font-smoothing: grayscale;
  margin: 0;
  padding: 0;
}- package.json
javascript
{
  "name": "cloud-data-center-service",
  "version": "0.0.0",
  "private": true,
  "type": "module",
  "scripts": {
    "dev": "vite",
    "build": "run-p type-check \"build-only {@}\" --",
    "preview": "vite preview",
    "build-only": "vite build",
    "type-check": "vue-tsc --build"
  },
  "dependencies": {
    "echarts": "^6.0.0",
    "element-plus": "^2.13.7",
    "pinia": "^3.0.4",
    "vue": "^3.5.32",
    "vue-router": "^5.0.4"
  },
  "devDependencies": {
    "@tsconfig/node24": "^24.0.4",
    "@types/node": "^24.12.2",
    "@vitejs/plugin-vue": "^6.0.6",
    "@vue/tsconfig": "^0.9.1",
    "less": "^4.6.4",
    "npm-run-all2": "^8.0.4",
    "typescript": "~6.0.0",
    "vite": "^8.0.8",
    "vite-plugin-vue-devtools": "^8.1.1",
    "vue-tsc": "^3.2.6"
  },
  "engines": {
    "node": "^20.19.0 || >=22.12.0"
  }
}- vite.config.ts
javascript
import { fileURLToPath, URL } from 'node:url'

import { defineConfig } from 'vite'
import vue from '@vitejs/plugin-vue'
import vueDevTools from 'vite-plugin-vue-devtools'

// https://vite.dev/config/
export default defineConfig({
  plugins: [
    vue(),
    // vueDevTools(),
  ],
  resolve: {
    alias: {
      '@': fileURLToPath(new URL('./src', import.meta.url))
    },
  },
})