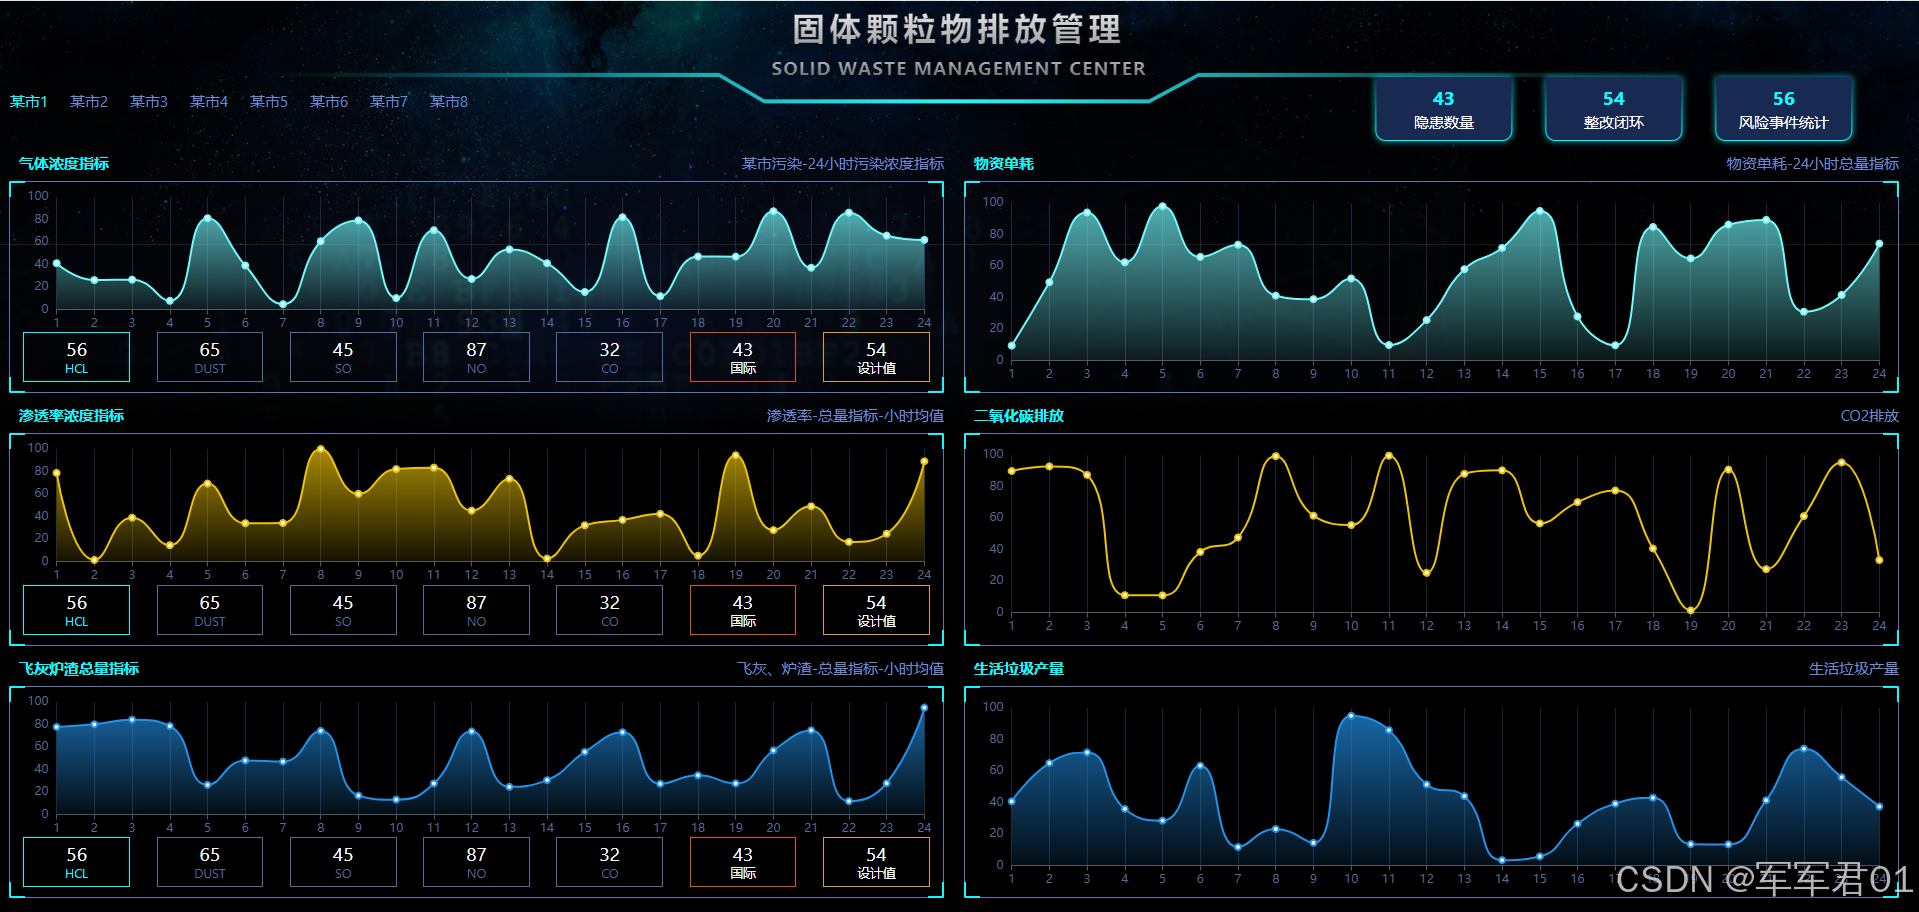
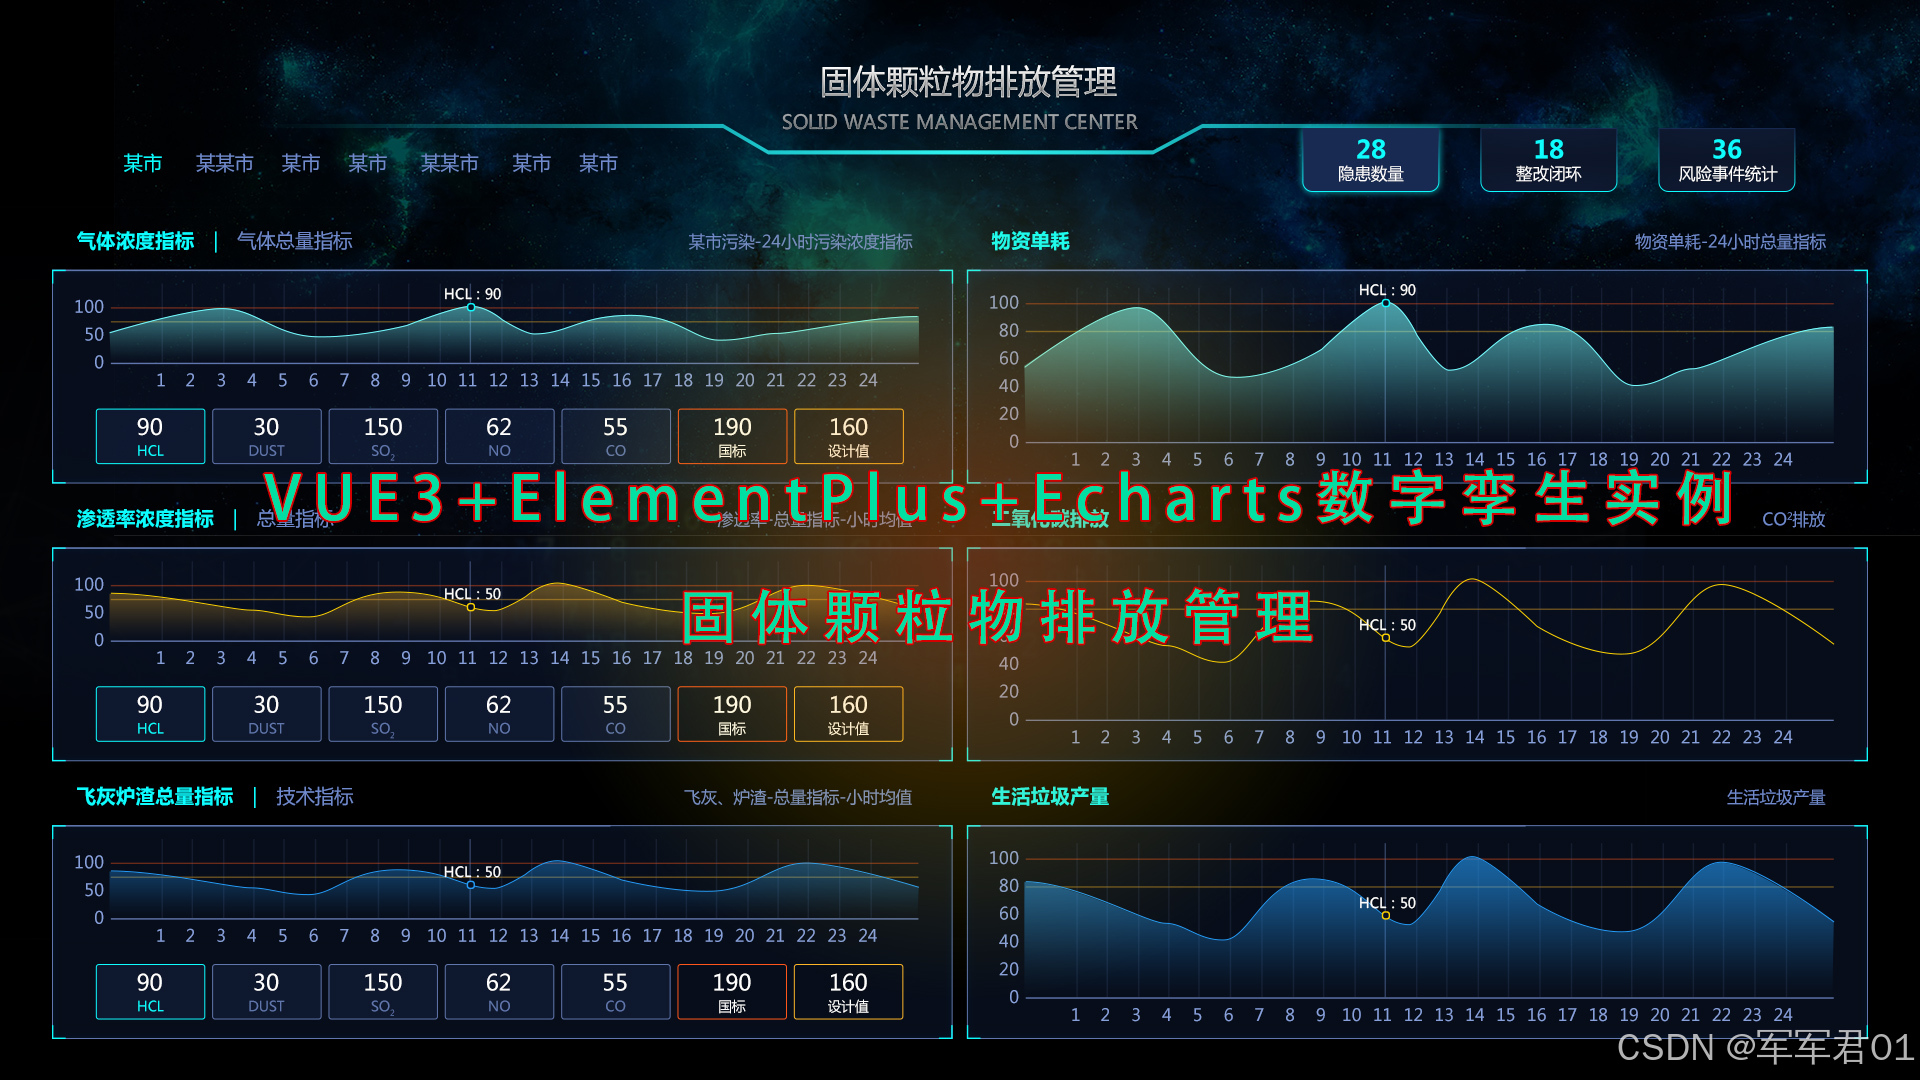
前端数字孪生大屏,使用VUE3+Elementplus+Echarts+TS实现固体颗粒物监管平台,数字孪生,监控大屏展示,可下载作为课堂作业、界面模板、扩展开发,个人作品等。
若想系统学习Echarts开发,我的课程提供了完整的Echarts基础知识讲解并附加大量实战案例,系列课程地址如下:
1. CSDN课程:https://edu.csdn.net/course/detail/40842
2. 51学堂课程:https://edu.51cto.com/course/40414.html
3. B站课程:https://www.bilibili.com/cheese/play/ss456500998
一.效果展示:
二.源码下载:
三.开发视频:
https://www.bilibili.com/video/BV1kcooBMEdv/
四.实现明细:
4.1 开发环境
使用vscode开发,nodejs版本为v24.11.0,其它项目依赖如下:
1. "dayjs": "^1.11.20"
2. "echarts": "^5.1.2"
3. "element-plus": "^2.13.6"
4. "less": "^4.6.4"
5. "pinia": "^3.0.4"
6. "vue": "^3.5.31"
7. "vue-router": "^5.0.4"
8. "vue-router": "^2.0.9"
4.2 实现明细
- main.ts
typescript
import { createApp } from 'vue'
import { createPinia } from 'pinia'
import "@/assets/main.css"
import ElementPlus from 'element-plus'
import 'element-plus/dist/index.css'

import App from './App.vue'
import router from './router'

const app = createApp(App)

app.use(createPinia())
app.use(router)
app.use(ElementPlus)

app.mount('#app')- App.vue
javascript
<script setup lang="ts"></script>

<template>
  <RouterView></RouterView>
</template>

<style scoped></style>- HomeView.vue
javascript
<script setup lang="ts">
import ChartItem from '@/components/ChartItem.vue';
import Header from '@/components/Header.vue';
import { onMounted, reactive,ref } from 'vue';
import * as echarts from "echarts";
import LeftDetailChartDlg from '@/components/LeftDetailChartDlg.vue';
import RightDetailChartDlg from '@/components/RightDetailChartDlg.vue';
const gasConcentrationChartRef = ref();
const gasConcentrationChart = ref();
const gasConcentrationChartOption = reactive({
grid:{
left:'5%',
top:'10%',
right:"2%",
bottom:'15%',
containLabel:false
},
xAxis: {
type: 'category',
boundaryGap: false,
data: Array.from({ length: 24 }, (_, i) => i + 1),
axisLabel:{
textStyle:{
color:'#566a9c'
}
},
splitLine:{
show:true,
lineStyle:{
color:'#566a9c55'
}
}
},
yAxis: {
type: 'value',
axisLabel:{
textStyle:{
color:'#566a9c'
}
},
splitLine:{
show:false
}
},
series: [
{
smooth:true,
data: Array.from({ length: 24 }, () => Math.random()*100),
type: 'line',
itemStyle:{
color:'#72f7fa'
},
areaStyle: {
color:{
type: 'linear',
x: 0,
y: 0,
x2: 0,
y2: 1,
colorStops: [{
offset: 0, color: '#72f7fa' // 0% 处的颜色
}, {
offset: 1, color: '#72f7fa22' // 100% 处的颜色
}],
global: false // 缺省为 false
}
}
}
]
});
const gasPermeabilityChartRef = ref();
const gasPermeabilityChart = ref();
const gasPermeabilityChartOption = reactive({
grid:{
left:'5%',
top:'10%',
right:"2%",
bottom:'15%',
containLabel:false
},
xAxis: {
type: 'category',
boundaryGap: false,
data: Array.from({ length: 24 }, (_, i) => i + 1),
axisLabel:{
textStyle:{
color:'#566a9c'
}
},
splitLine:{
show:true,
lineStyle:{
color:'#566a9c55'
}
}
},
yAxis: {
type: 'value',
axisLabel:{
textStyle:{
color:'#566a9c'
}
},
splitLine:{
show:false
}
},
series: [
{
smooth:true,
data: Array.from({ length: 24 }, () => Math.random()*100),
type: 'line',
itemStyle:{
color:'#edc404'
},
areaStyle: {
color:{
type: 'linear',
x: 0,
y: 0,
x2: 0,
y2: 1,
colorStops: [{
offset: 0, color: '#edc404' // 0% 处的颜色
}, {
offset: 1, color: '#edc40422' // 100% 处的颜色
}],
global: false // 缺省为 false
}
}
}
]
});
const gasSlagChartRef = ref();
const gasSlagChart = ref();
const gasSlagChartOption = reactive({
grid:{
left:'5%',
top:'10%',
right:"2%",
bottom:'15%',
containLabel:false
},
xAxis: {
type: 'category',
boundaryGap: false,
data: Array.from({ length: 24 }, (_, i) => i + 1),
axisLabel:{
textStyle:{
color:'#566a9c'
}
},
splitLine:{
show:true,
lineStyle:{
color:'#566a9c55'
}
}
},
yAxis: {
type: 'value',
axisLabel:{
textStyle:{
color:'#566a9c'
}
},
splitLine:{
show:false
}
},
series: [
{
smooth:true,
data: Array.from({ length: 24 }, () => Math.random()*100),
type: 'line',
itemStyle:{
color:'#2292ea'
},
areaStyle: {
color:{
type: 'linear',
x: 0,
y: 0,
x2: 0,
y2: 1,
colorStops: [{
offset: 0, color: '#2292ea' // 0% 处的颜色
}, {
offset: 1, color: '#2292ea22' // 100% 处的颜色
}],
global: false // 缺省为 false
}
}
}
]
});
const materialChartRef = ref();
const materialChart = ref();
const materialChartOption = reactive({
grid:{
left:'5%',
top:'10%',
right:"2%",
bottom:'15%',
containLabel:false
},
xAxis: {
type: 'category',
boundaryGap: false,
data: Array.from({ length: 24 }, (_, i) => i + 1),
axisLabel:{
textStyle:{
color:'#566a9c'
}
},
splitLine:{
show:true,
lineStyle:{
color:'#566a9c55'
}
}
},
yAxis: {
type: 'value',
axisLabel:{
textStyle:{
color:'#566a9c'
}
},
splitLine:{
show:false
}
},
series: [
{
smooth:true,
data: Array.from({ length: 24 }, () => Math.random()*100),
type: 'line',
itemStyle:{
color:'#72f7fa'
},
areaStyle: {
color:{
type: 'linear',
x: 0,
y: 0,
x2: 0,
y2: 1,
colorStops: [{
offset: 0, color: '#72f7fa' // 0% 处的颜色
}, {
offset: 1, color: '#72f7fa22' // 100% 处的颜色
}],
global: false // 缺省为 false
}
}
}
]
});
const co2ChartRef = ref();
const co2Chart = ref();
const co2ChartOption = reactive({
grid:{
left:'5%',
top:'10%',
right:"2%",
bottom:'15%',
containLabel:false
},
xAxis: {
type: 'category',
boundaryGap: false,
data: Array.from({ length: 24 }, (_, i) => i + 1),
axisLabel:{
textStyle:{
color:'#566a9c'
}
},
splitLine:{
show:true,
lineStyle:{
color:'#566a9c55'
}
}
},
yAxis: {
type: 'value',
axisLabel:{
textStyle:{
color:'#566a9c'
}
},
splitLine:{
show:false
}
},
series: [
{
smooth:true,
data: Array.from({ length: 24 }, () => Math.random()*100),
type: 'line',
itemStyle:{
color:'#edc404'
}
}
]
});
const wasteChartRef = ref();
const wasteChart = ref();
const wasteChartOption = reactive({
grid:{
left:'5%',
top:'10%',
right:"2%",
bottom:'15%',
containLabel:false
},
xAxis: {
type: 'category',
boundaryGap: false,
data: Array.from({ length: 24 }, (_, i) => i + 1),
axisLabel:{
textStyle:{
color:'#566a9c'
}
},
splitLine:{
show:true,
lineStyle:{
color:'#566a9c55'
}
}
},
yAxis: {
type: 'value',
axisLabel:{
textStyle:{
color:'#566a9c'
}
},
splitLine:{
show:false
}
},
series: [
{
smooth:true,
data: Array.from({ length: 24 }, () => Math.random()*100),
type: 'line',
itemStyle:{
color:'#2292ea'
},
areaStyle: {
color:{
type: 'linear',
x: 0,
y: 0,
x2: 0,
y2: 1,
colorStops: [{
offset: 0, color: '#2292ea' // 0% 处的颜色
}, {
offset: 1, color: '#2292ea22' // 100% 处的颜色
}],
global: false // 缺省为 false
}
}
}
]
});
//左侧图表弹框
const leftDetailChartDlg = ref<boolean>(false);
//当前标题
const currentTitle = ref<String>('');
//当前标题
const currentColor = ref<String>('');
//当前标题
const currentColor1 = ref<String>('');
//打开左侧弹框
const openLeftChartDlg = (title:String,color:String,color1:String)=>{
currentTitle.value = title;
currentColor.value = color;
currentColor1.value = color1;
leftDetailChartDlg.value = true;
}
//右侧图表弹框
const rightDetailChartDlg = ref<boolean>(false);
//打开右侧弹框
const openRightChartDlg = (title:String,color:String,color1:String)=>{
currentTitle.value = title;
currentColor.value = color;
currentColor1.value = color1;
rightDetailChartDlg.value = true;
}
onMounted(()=>{
gasConcentrationChart.value = echarts.init(gasConcentrationChartRef.value);
gasConcentrationChart.value.setOption(gasConcentrationChartOption);
gasPermeabilityChart.value = echarts.init(gasPermeabilityChartRef.value);
gasPermeabilityChart.value.setOption(gasPermeabilityChartOption);
gasSlagChart.value = echarts.init(gasSlagChartRef.value);
gasSlagChart.value.setOption(gasSlagChartOption);
materialChart.value = echarts.init(materialChartRef.value);
materialChart.value.setOption(materialChartOption);
co2Chart.value = echarts.init(co2ChartRef.value);
co2Chart.value.setOption(co2ChartOption);
wasteChart.value = echarts.init(wasteChartRef.value);
wasteChart.value.setOption(wasteChartOption);
})
</script>
<template>
<div class="page">
<Header></Header>
<div class="tabs">
<div class="menus">
<div class="menu-item menu-item-selected">某市1</div>
<div class="menu-item">某市2</div>
<div class="menu-item">某市3</div>
<div class="menu-item">某市4</div>
<div class="menu-item">某市5</div>
<div class="menu-item">某市6</div>
<div class="menu-item">某市7</div>
<div class="menu-item">某市8</div>
</div>
<div class="empty"></div>
<div class="count">
<div class="item">
<div class="inner">
<div class="value">43</div>
<div class="name">隐患数量</div>
</div>
</div>
<div class="item">
<div class="inner">
<div class="value">54</div>
<div class="name">整改闭环</div>
</div>
</div>
<div class="item">
<div class="inner">
<div class="value">56</div>
<div class="name">风险事件统计</div>
</div>
</div>
</div>
</div>
<el-row :gutter="20" style="width:calc(100vw - 10px)">
<el-col :span="12">
<ChartItem title="气体浓度指标" info="某市污染-24小时污染浓度指标" @openDetail="openLeftChartDlg('气体浓度指标','#72f7fa','#72f7fa22')">
<div class="chart-content">
<div class="chart-panel" ref="gasConcentrationChartRef"></div>
<div class="chart-tabs">
<div class="tab-item">
<div class="inner inner-select">
<div class="value">56</div>
<div class="name">HCL</div>
</div>
</div>
<div class="tab-item">
<div class="inner">
<div class="value">65</div>
<div class="name">DUST</div>
</div>
</div>
<div class="tab-item">
<div class="inner">
<div class="value">45</div>
<div class="name">SO</div>
</div>
</div>
<div class="tab-item">
<div class="inner">
<div class="value">87</div>
<div class="name">NO</div>
</div>
</div>
<div class="tab-item">
<div class="inner">
<div class="value">32</div>
<div class="name">CO</div>
</div>
</div>
<div class="tab-item">
<div class="inner international">
<div class="value">43</div>
<div class="name">国际</div>
</div>
</div>
<div class="tab-item">
<div class="inner design">
<div class="value">54</div>
<div class="name">设计值</div>
</div>
</div>
</div>
</div>
</ChartItem>
<ChartItem title="渗透率浓度指标" info="渗透率-总量指标-小时均值" @openDetail="openLeftChartDlg('渗透率浓度指标','#edc404','#edc40422')">
<div class="chart-content">
<div class="chart-panel" ref="gasPermeabilityChartRef"></div>
<div class="chart-tabs">
<div class="tab-item">
<div class="inner inner-select">
<div class="value">56</div>
<div class="name">HCL</div>
</div>
</div>
<div class="tab-item">
<div class="inner">
<div class="value">65</div>
<div class="name">DUST</div>
</div>
</div>
<div class="tab-item">
<div class="inner">
<div class="value">45</div>
<div class="name">SO</div>
</div>
</div>
<div class="tab-item">
<div class="inner">
<div class="value">87</div>
<div class="name">NO</div>
</div>
</div>
<div class="tab-item">
<div class="inner">
<div class="value">32</div>
<div class="name">CO</div>
</div>
</div>
<div class="tab-item">
<div class="inner international">
<div class="value">43</div>
<div class="name">国际</div>
</div>
</div>
<div class="tab-item">
<div class="inner design">
<div class="value">54</div>
<div class="name">设计值</div>
</div>
</div>
</div>
</div>
</ChartItem>
<ChartItem title="飞灰炉渣总量指标" info="飞灰、炉渣-总量指标-小时均值" @openDetail="openLeftChartDlg('飞灰炉渣总量指标','#2292ea','#2292ea22')">
<div class="chart-content">
<div class="chart-panel" ref="gasSlagChartRef"></div>
<div class="chart-tabs">
<div class="tab-item">
<div class="inner inner-select">
<div class="value">56</div>
<div class="name">HCL</div>
</div>
</div>
<div class="tab-item">
<div class="inner">
<div class="value">65</div>
<div class="name">DUST</div>
</div>
</div>
<div class="tab-item">
<div class="inner">
<div class="value">45</div>
<div class="name">SO</div>
</div>
</div>
<div class="tab-item">
<div class="inner">
<div class="value">87</div>
<div class="name">NO</div>
</div>
</div>
<div class="tab-item">
<div class="inner">
<div class="value">32</div>
<div class="name">CO</div>
</div>
</div>
<div class="tab-item">
<div class="inner international">
<div class="value">43</div>
<div class="name">国际</div>
</div>
</div>
<div class="tab-item">
<div class="inner design">
<div class="value">54</div>
<div class="name">设计值</div>
</div>
</div>
</div>
</div>
</ChartItem>
</el-col>
<el-col :span="12">
<ChartItem title="物资单耗" info="物资单耗-24小时总量指标" @openDetail="openRightChartDlg('物资单耗','#72f7fa','#72f7fa22')">
<div class="chart-content">
<div class="right-chart-panel" ref="materialChartRef"></div>
</div>
</ChartItem>
<ChartItem title="二氧化碳排放" info="CO2排放" @openDetail="openRightChartDlg('二氧化碳排放','#edc404','#edc40422')">
<div class="chart-content">
<div class="right-chart-panel" ref="co2ChartRef"></div>
</div>
</ChartItem>
<ChartItem title="生活垃圾产量" info="生活垃圾产量" @openDetail="openRightChartDlg('生活垃圾产量','#2292ea','#2292ea22')">
<div class="chart-content">
<div class="right-chart-panel" ref="wasteChartRef"></div>
</div>
</ChartItem>
</el-col>
</el-row>
</div>
<LeftDetailChartDlg :title="currentTitle" :color="currentColor" :color1="currentColor1" v-if="leftDetailChartDlg" @closed="leftDetailChartDlg = false"></LeftDetailChartDlg>
<RightDetailChartDlg :title="currentTitle" :color="currentColor" :color1="currentColor1" v-if="rightDetailChartDlg" @closed="rightDetailChartDlg = false"></RightDetailChartDlg>
</template>
<style lang="less" scoped>
.page {
height: 100vh;
background: url(@/assets/images/bj.jpg) 100% 100%;
.tabs {
display: flex;
line-height: 80px;
.menus {
display: flex;
color: #708acc;
.menu-item {
width: 60px;
text-align: center;
cursor: pointer;
}
.menu-item:hover {
color: #0efcff;
}
.menu-item-selected {
color: #0efcff;
}
}
.empty {
flex: 1
}
.count {
display: flex;
color: #fff;
width: calc((100vw - 800px) / 2);
padding-right: 50px;
.item {
text-align: center;
position: relative;
top: 9px;
flex: 1;
.inner {
padding-top: 15px;
line-height: 25px;
background: url(@/assets/images/icon-002.png) 100% 100% no-repeat;
width: 153px;
margin: 0 auto;
height: 79px;
.value {
color: #0efcff;
font-size: 1.2rem;
font-weight: bold;
}
}
}
}
}
.chart-content {
.chart-panel {
height: 16.5vh;
}
.right-chart-panel{
height: calc(16.5vh + 60px);
}
.chart-tabs {
display: flex;
.tab-item {
flex: 1;
.inner{
width:80%;
margin: 0 auto;
border: 1px solid #566a9c;
margin-bottom: 10px;
text-align: center;
line-height: 20px;
height: 50px;
padding-top: 5px;
cursor: pointer;
.value{
font-size: 1.2rem;
color:#fff;
}
.name{
font-size: 0.8rem;
color:#566a9c;
}
}
.inner:hover{
border-color: #0efcff;
.name{
color:#0efcff;
}
}
.inner-select{
border-color: #0efcff;
.name{
color:#0efcff;
}
}
.international{
border-color: #e24e1c;
.name{
color:#fff;
}
}
.design{
border-color: #dca027;
.name{
color:#fff;
}
}
}
}
}
}
</style>- router/index.vue
javascript
import HomeView from '@/views/HomeView.vue'
import { createRouter, createWebHistory } from 'vue-router'

const router = createRouter({
  history: createWebHistory(import.meta.env.BASE_URL),
  routes: [{
    path:'',
    component:HomeView
  }],
})

export default router- RightDetailChartDlg.vue
javascript
<template>
    <el-dialog v-model="dialogVisible" append-to-body fullscreen :title="title" width="80vw" center align-center @closed="emits('closed')" class="dialog">
        <ChartItem title="" info="" style="width:80vw;margin: 0 auto;margin-top: 5%;background: #102242;">
          <div class="chart-content">
            <div class="chart-panel" ref="chartRef"></div>
          </div>
        </ChartItem>
    </el-dialog>
</template>
<script setup lang="ts">
import { onMounted, ref,reactive, nextTick } from 'vue';
import * as echarts from "echarts";
import ChartItem from '@/components/ChartItem.vue';

//外部参数
const props = defineProps({
    title:String,
    color:String,
    color1:String
})

//事件
const emits = defineEmits(['closed'])

//弹框是否展示
const dialogVisible = ref(true);

const chartRef = ref();
const chart = ref();
const chartOption = reactive({
  grid:{
    left:'5%',
    top:'10%',
    right:"2%",
    bottom:'15%',
    containLabel:false
  },
  xAxis: {
    type: 'category',
    boundaryGap: false,
    data: Array.from({ length: 24 }, (_, i) => i + 1),
    axisLabel:{
      textStyle:{
        color:'#566a9c'
      }
    },
    splitLine:{
      show:true,
      lineStyle:{
        color:'#566a9c55'
      }
    }
  },
  yAxis: {
    type: 'value',
    axisLabel:{
      textStyle:{
        color:'#566a9c'
      }
    },
    splitLine:{
      show:false
    }
  },
  series: [
    {
      smooth:true,
      data: Array.from({ length: 24 }, () => Math.random()*100),
      type: 'line',
      itemStyle:{
        color:props.color
      },
      areaStyle: {
        color:{
          type: 'linear',
          x: 0,
          y: 0,
          x2: 0,
          y2: 1,
          colorStops: [{
              offset: 0, color: props.color // 0% 处的颜色
          }, {
              offset: 1, color: props.color1 // 100% 处的颜色
          }],
          global: false // 缺省为 false
        }
      }
    }
  ]
});


onMounted(()=>{
  nextTick(()=>{
    chart.value = echarts.init(chartRef.value);
    chart.value.setOption(chartOption);
  })
})

</script>
<style lang="less" scoped>
    .chart-panel {
      height: 60vh;

    }
    .chart-tabs {
      display: flex;

      .tab-item {
        flex: 1;

        .inner{
          width:80%;
          margin: 0 auto;
          border: 1px solid #566a9c;
          margin-bottom: 10px;
          text-align: center;
          line-height: 20px;
          height: 50px;
          padding-top: 5px;
          cursor: pointer;

          .value{
            font-size: 1.2rem;
            color:#fff;
          }
          .name{
            font-size: 0.8rem;
            color:#566a9c;
          }
        }
        .inner:hover{
          border-color: #0efcff;
          .name{
            color:#0efcff;
          }
        }
        .inner-select{
          border-color: #0efcff;
          .name{
            color:#0efcff;
          }
        }
        .international{
          border-color: #e24e1c;
          .name{
            color:#fff;
          }
        }
        .design{
          border-color: #dca027;
          .name{
            color:#fff;
          }
        }
      }
    }
</style>
<style lang="less">
    .dialog{
        --el-dialog-bg-color:#0b1423dd;
        --el-text-color-primary:#0efcff;
    }
</style>- LeftDetailChartDlg.vue
javascript
<template>
    <el-dialog v-model="dialogVisible" append-to-body fullscreen :title="title" width="80vw" center align-center @closed="emits('closed')" class="dialog">
        <ChartItem title="" info="" style="width:80vw;margin: 0 auto;margin-top: 5%;background: #102242;">
          <div class="chart-content">
            <div class="chart-panel" ref="chartRef"></div>
            <div class="chart-tabs">
              <div class="tab-item">
                <div class="inner inner-select">
                  <div class="value">56</div>
                  <div class="name">HCL</div>
                </div>
              </div>
              <div class="tab-item">
                <div class="inner">
                  <div class="value">65</div>
                  <div class="name">DUST</div>
                </div>
              </div>
              <div class="tab-item">
                <div class="inner">
                  <div class="value">45</div>
                  <div class="name">SO</div>
                </div>
              </div>
              <div class="tab-item">
                <div class="inner">
                  <div class="value">87</div>
                  <div class="name">NO</div>
                </div>
              </div>
              <div class="tab-item">
                <div class="inner">
                  <div class="value">32</div>
                  <div class="name">CO</div>
                </div>
              </div>
              <div class="tab-item">
                <div class="inner international">
                  <div class="value">43</div>
                  <div class="name">国际</div>
                </div>
              </div>
              <div class="tab-item">
                <div class="inner design">
                  <div class="value">54</div>
                  <div class="name">设计值</div>
                </div>
              </div>
            </div>
          </div>
        </ChartItem>
    </el-dialog>
</template>
<script setup lang="ts">
import { onMounted, ref,reactive, nextTick } from 'vue';
import * as echarts from "echarts";
import ChartItem from '@/components/ChartItem.vue';

//外部参数
const props = defineProps({
    title:String,
    color:String,
    color1:String
})

//事件
const emits = defineEmits(['closed'])

//弹框是否展示
const dialogVisible = ref(true);

const chartRef = ref();
const chart = ref();
const chartOption = reactive({
  grid:{
    left:'5%',
    top:'10%',
    right:"2%",
    bottom:'15%',
    containLabel:false
  },
  xAxis: {
    type: 'category',
    boundaryGap: false,
    data: Array.from({ length: 24 }, (_, i) => i + 1),
    axisLabel:{
      textStyle:{
        color:'#566a9c'
      }
    },
    splitLine:{
      show:true,
      lineStyle:{
        color:'#566a9c55'
      }
    }
  },
  yAxis: {
    type: 'value',
    axisLabel:{
      textStyle:{
        color:'#566a9c'
      }
    },
    splitLine:{
      show:false
    }
  },
  series: [
    {
      smooth:true,
      data: Array.from({ length: 24 }, () => Math.random()*100),
      type: 'line',
      itemStyle:{
        color:props.color
      },
      areaStyle: {
        color:{
          type: 'linear',
          x: 0,
          y: 0,
          x2: 0,
          y2: 1,
          colorStops: [{
              offset: 0, color: props.color // 0% 处的颜色
          }, {
              offset: 1, color: props.color1 // 100% 处的颜色
          }],
          global: false // 缺省为 false
        }
      }
    }
  ]
});


onMounted(()=>{
  nextTick(()=>{
    chart.value = echarts.init(chartRef.value);
    chart.value.setOption(chartOption);
  })
})

</script>
<style lang="less" scoped>
    .chart-panel {
      height: 60vh;

    }
    .chart-tabs {
      display: flex;

      .tab-item {
        flex: 1;

        .inner{
          width:80%;
          margin: 0 auto;
          border: 1px solid #566a9c;
          margin-bottom: 10px;
          text-align: center;
          line-height: 20px;
          height: 50px;
          padding-top: 5px;
          cursor: pointer;

          .value{
            font-size: 1.2rem;
            color:#fff;
          }
          .name{
            font-size: 0.8rem;
            color:#566a9c;
          }
        }
        .inner:hover{
          border-color: #0efcff;
          .name{
            color:#0efcff;
          }
        }
        .inner-select{
          border-color: #0efcff;
          .name{
            color:#0efcff;
          }
        }
        .international{
          border-color: #e24e1c;
          .name{
            color:#fff;
          }
        }
        .design{
          border-color: #dca027;
          .name{
            color:#fff;
          }
        }
      }
    }
</style>
<style lang="less">
    .dialog{
        --el-dialog-bg-color:#0b1423dd;
        --el-text-color-primary:#0efcff;
    }
</style>- Header.vue
javascript
<template>
    <div class="header">
        <img src="@/assets/images/icon-001.png">
        <div class="left">

        </div>
        <div class="center">
            <div class="title">固体颗粒物排放管理</div>
            <div class="sub-title">SOLID WASTE MANAGEMENT CENTER</div>
        </div>
        <div class="right">

        </div>
    </div>
</template>
<script setup lang="ts">
</script>
<style lang="less" scoped>
    .header{
        height: 60px;
        position: relative;
        display: flex;

        img{
            left:9%;
            top:-10px;
            position: absolute;
        }

        .left,.right{
            flex:1
        }
        .center{
            width:400px;
            text-align: center;
            .title{
                font-size: 2rem;
                font-weight: bold;
                color:#fff;
                letter-spacing: 5px;
                background: -webkit-linear-gradient(bottom, #ffffff, #919191); /* Chrome 10-25, Safari 5.1-6 */
                background: linear-gradient(to bottom, #ffffff, #919191); /* 标准的语法 */
                -webkit-background-clip: text;
                -webkit-text-fill-color: transparent;
            }
            .sub-title{
                font-size: 1.2rem;
                color:#fff;
                letter-spacing: 1px;
                font-weight: bold;
                background: -webkit-linear-gradient(bottom, #d8d8d8, #575757); /* Chrome 10-25, Safari 5.1-6 */
                background: linear-gradient(to bottom, #d8d8d8, #575757); /* 标准的语法 */
                -webkit-background-clip: text;
                -webkit-text-fill-color: transparent;
            }
        }
    }
</style>- ChartItem.vue
javascript
<template>
    <div class="chart-item">
        <div class="title" v-if="info || title">
            <div class="text" v-if="title">{{ title }}</div>
            <div class="info" v-if="info" @click="emits('openDetail')">{{ info }}</div>
        </div>
        <div class="content">
            <div class="left-top-1"></div>
            <div class="left-top-2"></div>
            <div class="left-bottom-1"></div>
            <div class="left-bottom-2"></div>
            <div class="right-top-1"></div>
            <div class="right-top-2"></div>
            <div class="right-bottom-1"></div>
            <div class="right-bottom-2"></div>
            <slot></slot>
        </div>
    </div>
</template>
<script setup lang="ts">
    const props = defineProps({
        title:String,
        info:String
    })
    const emits = defineEmits(['openDetail'])
</script>
<style lang="less" scoped>
    .chart-item{
        margin: 10px;
        width:100%;
        .title{
            height: 30px;
            display: flex;

            .text{
                flex:1;
                color: #0efcff;
                padding-left: 10px;
                font-weight: bold;
            }
            .info{
                text-align: right;
                color: #708acc;
                font-size: 0.8;
                cursor: pointer;
            }
            .info:hover{
                color: #0efcff;
            }
        }
        .content{
            position: relative;
            border:1px solid #6076ad;

            .left-top-1{
                position: absolute;
                top:-1px;
                left:0;
                height: 2px;
                width:15px;
                background: #0efcff;
            }
            .left-top-2{
                position: absolute;
                top:0;
                left:-1px;
                height: 15px;
                width:2px;
                background: #0efcff;
            }
            .left-bottom-1{
                position: absolute;
                bottom:-1px;
                left:0;
                height: 2px;
                width:15px;
                background: #0efcff;
            }
            .left-bottom-2{
                position: absolute;
                bottom:0;
                left:-1px;
                height: 15px;
                width:2px;
                background: #0efcff;
            }

            .right-top-1{
                position: absolute;
                top:-1px;
                right:0;
                height: 2px;
                width:15px;
                background: #0efcff;
            }
            .right-top-2{
                position: absolute;
                top:0;
                right:-1px;
                height: 15px;
                width:2px;
                background: #0efcff;
            }
            .right-bottom-1{
                position: absolute;
                bottom:-1px;
                right:0;
                height: 2px;
                width:15px;
                background: #0efcff;
            }
            .right-bottom-2{
                position: absolute;
                bottom:0;
                right:-1px;
                height: 15px;
                width:2px;
                background: #0efcff;
            }
        }
    }
</style>- main.css
javascript
@import './base.css';

#app {
}

a,
.green {
  text-decoration: none;
  color: hsla(160, 100%, 37%, 1);
  transition: 0.4s;
  padding: 3px;
}

@media (hover: hover) {
  a:hover {
    background-color: hsla(160, 100%, 37%, 0.2);
  }
}

@media (min-width: 1024px) {
  body {
  }

  #app {

  }
}- base.css
javascript
/* color palette from <https://github.com/vuejs/theme> */
:root {
  --vt-c-white: #ffffff;
  --vt-c-white-soft: #f8f8f8;
  --vt-c-white-mute: #f2f2f2;

  --vt-c-black: #181818;
  --vt-c-black-soft: #222222;
  --vt-c-black-mute: #282828;

  --vt-c-indigo: #2c3e50;

  --vt-c-divider-light-1: rgba(60, 60, 60, 0.29);
  --vt-c-divider-light-2: rgba(60, 60, 60, 0.12);
  --vt-c-divider-dark-1: rgba(84, 84, 84, 0.65);
  --vt-c-divider-dark-2: rgba(84, 84, 84, 0.48);

  --vt-c-text-light-1: var(--vt-c-indigo);
  --vt-c-text-light-2: rgba(60, 60, 60, 0.66);
  --vt-c-text-dark-1: var(--vt-c-white);
  --vt-c-text-dark-2: rgba(235, 235, 235, 0.64);
}

/* semantic color variables for this project */
:root {
  --color-background: var(--vt-c-white);
  --color-background-soft: var(--vt-c-white-soft);
  --color-background-mute: var(--vt-c-white-mute);

  --color-border: var(--vt-c-divider-light-2);
  --color-border-hover: var(--vt-c-divider-light-1);

  --color-heading: var(--vt-c-text-light-1);
  --color-text: var(--vt-c-text-light-1);

  --section-gap: 160px;
}

@media (prefers-color-scheme: dark) {
  :root {
    --color-background: var(--vt-c-black);
    --color-background-soft: var(--vt-c-black-soft);
    --color-background-mute: var(--vt-c-black-mute);

    --color-border: var(--vt-c-divider-dark-2);
    --color-border-hover: var(--vt-c-divider-dark-1);

    --color-heading: var(--vt-c-text-dark-1);
    --color-text: var(--vt-c-text-dark-2);
  }
}

*,
*::before,
*::after {
  box-sizing: border-box;
  margin: 0;
  font-weight: normal;
}

body {
  min-height: 100vh;
  color: var(--color-text);
  background: var(--color-background);
  transition:
    color 0.5s,
    background-color 0.5s;
  line-height: 1.6;
  font-family:
    Inter,
    -apple-system,
    BlinkMacSystemFont,
    'Segoe UI',
    Roboto,
    Oxygen,
    Ubuntu,
    Cantarell,
    'Fira Sans',
    'Droid Sans',
    'Helvetica Neue',
    sans-serif;
  font-size: 15px;
  text-rendering: optimizeLegibility;
  -webkit-font-smoothing: antialiased;
  -moz-osx-font-smoothing: grayscale;
}- package.json
javascript
{
  "name": "solid-particles",
  "version": "0.0.0",
  "private": true,
  "type": "module",
  "scripts": {
    "dev": "vite",
    "build": "run-p type-check \"build-only {@}\" --",
    "preview": "vite preview",
    "build-only": "vite build",
    "type-check": "vue-tsc --build"
  },
  "dependencies": {
    "echarts": "^6.0.0",
    "element-plus": "^2.13.7",
    "pinia": "^3.0.4",
    "vue": "^3.5.32",
    "vue-router": "^5.0.4"
  },
  "devDependencies": {
    "@tsconfig/node24": "^24.0.4",
    "@types/node": "^24.12.2",
    "@vitejs/plugin-vue": "^6.0.6",
    "@vue/tsconfig": "^0.9.1",
    "less": "^4.6.4",
    "npm-run-all2": "^8.0.4",
    "typescript": "~6.0.0",
    "vite": "^8.0.8",
    "vite-plugin-vue-devtools": "^8.1.1",
    "vue-tsc": "^3.2.6"
  },
  "engines": {
    "node": "^20.19.0 || >=22.12.0"
  }
}