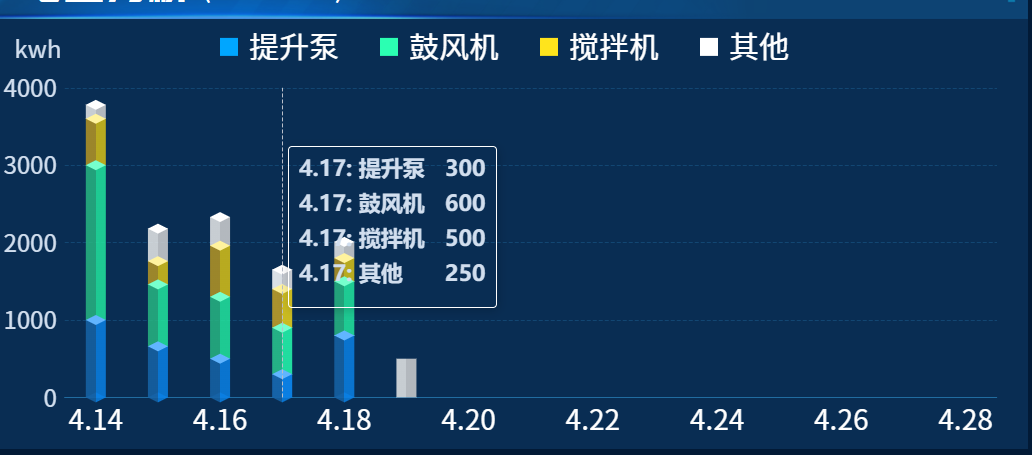
图例自定义,并且自动轮播,且效果为3d堆叠图,效果图如下
c
    getDLFXChart() {
      this.DLFXChart = this.$echarts.init(document.getElementById("DLFXChart"));
      let bardata1 = [1000, 660, 500, 300, 800];
      let bardata2 = [2000, 800, 800, 600, 700];
      let bardata3 = [600, 300, 660, 500, 300];
      let bardata4 = [180, 420, 370, 250, 210, 500];

      let categoryData = this.getLast15DaysFromToday();

      const dataArr = {
        result: [
          { name: "提升泵", data: bardata1, color: "#00a6ff" },
          { name: "鼓风机", data: bardata2, color: "#2bffb2" },
          { name: "搅拌机", data: bardata3, color: "#ffe41c" },
          { name: "其他", data: bardata4, color: "#ffffff" },
        ],
      };

      const colors = [
        ["rgba(22, 99, 167,.85)", "rgba(10, 128, 229,.85)"],
        ["rgba(39, 181, 130,.85)", "rgba(34, 229, 158,.85)"],
        ["rgba(181, 149, 36,.85)", "rgba(215, 192, 23,.85)"],
        ["rgba(233, 233, 233,.85)", "rgba(209, 208, 209,.85)"],
      ];

      const topColors = [
        "rgb(97, 181, 255)",
        "rgb(118, 255, 205)",
        "rgb(255, 243, 157)",
        "rgb(255, 255, 255)",
      ];
      const diamondData = dataArr.result.reduce((pre, cur, index) => {
        pre[index] = cur.data.map(
          (el, id) => el + (pre[index - 1] ? pre[index - 1][id] : 0)
        );
        return pre;
      }, []);

      let color = [];
      colors.forEach((item) => {
        color.push([
          { offset: 0, color: item[0] },
          { offset: 0.5, color: item[0] },
          { offset: 0.5, color: item[1] },
          { offset: 1, color: item[1] },
        ]);
      });
      let series = dataArr.result.reduce((p, c, i, array) => {
        let barGap = "-100%"; // 堆叠
        let barCateGoryGap = "60%";
        let barWidth = 20;

        p.push(
          {
            z: i + 1,
            stack: "group",
            type: "bar",
            name: c.name,
            data: c.data,
            barWidth: barWidth,
            barGap: barGap, // 不同系列的柱间距离
            barCateGoryGap: barCateGoryGap,
            itemStyle: {
              color: {
                type: "linear",
                x: 0,
                y: 0,
                x2: 1,
                y2: 0,
                colorStops: color[i],
              },
            },
          },
          {
            z: i + 10,
            type: "pictorialBar",
            symbolPosition: "end",
            symbol: "diamond",
            symbolOffset: [0, "-50%"], // 设置图形定位
            symbolSize: [barWidth, 10], // 设置图形大小。宽度为柱状条同宽;高度为10;
            data: diamondData[i], // 计算的高度值
            itemStyle: {
              color: function (params) {
                // 数据为0时,隐藏
                if (c.data[params.dataIndex] == 0) {
                  return "transparent";
                }
                return topColors[i];
              },
            },
            tooltip: { show: false },
            cursor: "auto",
          }
        );

        // 是否最后一个了?设置底座样式
        if (p.length === array.length * 2) {
          p.push({
            z: array.length * 2,
            type: "pictorialBar",
            symbolPosition: "start",
            data: dataArr.result[0].data,
            symbol: "diamond",
            symbolOffset: ["0%", "50%"],
            symbolSize: [barWidth, 10],
            itemStyle: {
              color: {
                type: "linear",
                x: 0,
                x2: 1,
                y: 0,
                y2: 0,
                colorStops: color[0],
              },
            },
            tooltip: { show: false },
          });
          return p;
        }
        return p;
      }, []);

      let option = {
        grid: {
          top: "16%",
          left: "8%",
          right: "3%",
          bottom: "12%",
        },
        legend: {
          itemWidth: 18,
          itemHeight: 18,
          itemGap: 41,
          left: "center",
          top: "3%",
          padding: 0,
          textStyle: {
            color: "#fff",
            fontSize: 30,
            padding: [8, 0, 0, 6],
            fontFamily: "Source Han Sans CN",
          },
          data: dataArr.result.map((item) => {
            return {
              name: item.name,
              icon: "rect",
              itemStyle: { color: item.color, borderWidth: 0 },
            };
          }),
        },
        tooltip: {
          trigger: "axis",
          backgroundColor: "transparent",
          textStyle: {
            color: "#D1DEEE",
            fontSize: 14,
            fontWeight: "bold",
            fontFamily: "PingFangSC, PingFang SC",
          },
          formatter: function (params) {
            // 过滤掉背景系列
            let filtered = params.filter((item) => item.seriesName !== "背景");
            const seen = new Map();
            filtered = filtered.filter((item) => {
              if (seen.has(item.seriesName)) return false;
              seen.set(item.seriesName, true);
              return true;
            });

            if (!filtered.length) return "";

            let result = "";
            filtered.forEach((item) => {
              result += `<div style="display:flex; justify-content:space-between; gap:20px;font-size:22px;margin-bottom:14px;">
          <span>${item.name}: ${item.seriesName}</span>
          <span style="font-weight:bold;">${item.value}</span>
        </div>`;
            });

            return result;
          },
        },
        xAxis: {
          type: "category",
          axisLabel: {
            textStyle: {
              color: "#fff",
              fontSize: 28,
              fontFamily: "Source Han Sans CN",
            },
            formatter: function (data) {
              return data;
            },
          },
          axisTick: {
            show: false,
          },
          splitLine: {
            show: false,
          },
          axisLine: {
            lineStyle: {
              color: "#216CA0",
            },
            show: true,
          },
          data: categoryData,
          interval:
            categoryData.length > 12 ? 1 : categoryData.length > 20 ? 2 : 0,
        },
        yAxis: {
          name: "kwh",
          nameTextStyle: {
            color: "#D1DEEE",
            fontSize: 24,
            padding: [0, 54, 12, 0],
            fontFamily: "Source Han Sans CN",
          },
          splitLine: {
            show: true,
            lineStyle: {
              color: "rgba(33, 108, 160, 0.4)",
              type: "dashed",
            },
          },
          axisLine: {
            show: false,
          },
          axisLabel: {
            show: true,
            textStyle: {
              color: "#D1DEEE",
            },
            fontSize: 24,
            fontFamily: "Source Han Sans CN",
            formatter: function (value) {
              if (value === 0) {
                return value;
              }
              return value;
            },
          },
          axisTick: {
            show: false,
          },
        },
        series: series,
      };

      // 先设置图表
      this.DLFXChart.setOption(option, true);
      let len = 0;
      // 自动轮播 + dataZoom 自动移动
      setInterval(() => {
        // 显示 tooltip
        this.DLFXChart.dispatchAction({
          type: "showTip",
          seriesIndex: 1, // 注意:索引改为1,跳过背景系列
          dataIndex: len,
        });
        len++;
      }, 6000);
    },