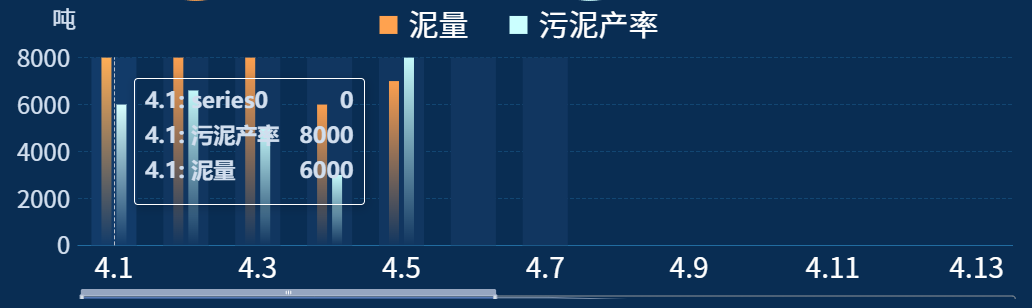
图例和下面的dataZoom自动轮播效果如图
c
    getNLFXChart() {
      this.NLFXChart = this.$echarts.init(document.getElementById("NLFXChart"));
      let bardata1 = [6000, 6600, 5000, 3000, 8000];
      let bardata2 = [8000, 8000, 8000, 6000, 7000];
      let categoryData = getDateArrayFromMonthStart();

      // 计算 dataZoom 的窗口大小
      const zoomWindowSize = 12;
      const totalPoints = categoryData.length;
      const endPercent = (zoomWindowSize / totalPoints) * 100;
      let option = {
        grid: {
          top: "19%",
          left: "8%",
          right: "3%",
          bottom: "18%",
        },
        legend: {
          itemWidth: 18,
          itemHeight: 18,
          itemGap: 41,
          left: "center",
          top: "3%",
          padding: 0,
          textStyle: {
            color: "#fff",
            fontSize: 30,
            padding: [8, 0, 0, 6],
            fontFamily: "Source Han Sans CN",
          },
          data: [
            {
              name: "泥量",
              icon: "rect",
              itemStyle: { color: "#ffa24f", borderWidth: 0 },
            },
            {
              name: "污泥产率",
              icon: "rect",
              itemStyle: { color: "#cbffff", borderWidth: 0 },
            },
          ],
        },
        tooltip: {
          trigger: "axis",
          backgroundColor: "transparent",
          textStyle: {
            color: "#D1DEEE",
            fontSize: 14,
            fontWeight: "bold",
            fontFamily: "PingFangSC, PingFang SC",
          },
          formatter: function (params) {
            // 过滤掉背景系列
            let filtered = params.filter((item) => item.seriesName !== "背景");
            const seen = new Map();
            filtered = filtered.filter((item) => {
              if (seen.has(item.seriesName)) return false;
              seen.set(item.seriesName, true);
              return true;
            });

            if (!filtered.length) return "";

            let result = "";
            filtered.forEach((item) => {
              result += `<div style="display:flex; justify-content:space-between; gap:20px;font-size:22px;margin-bottom:14px;">
          <span>${item.name}: ${item.seriesName}</span>
          <span style="font-weight:bold;">${item.value}</span>
        </div>`;
            });

            return result;
          },
        },
        xAxis: {
          type: "category",
          axisLabel: {
            textStyle: {
              color: "#fff",
              fontSize: 28,
              fontFamily: "Source Han Sans CN",
            },
            formatter: function (data) {
              return data;
            },
          },
          axisTick: {
            show: false,
          },
          splitLine: {
            show: false,
          },
          axisLine: {
            lineStyle: {
              color: "#216CA0",
            },
            show: true,
          },
          data: categoryData,
          interval:
            categoryData.length > 12 ? 1 : categoryData.length > 20 ? 3 : 0,
        },
        yAxis: {
          name: "吨",
          nameTextStyle: {
            color: "#D1DEEE",
            fontSize: 24,
            padding: [0, 28, 12, 0],
            fontFamily: "Source Han Sans CN",
          },
          splitLine: {
            show: true,
            lineStyle: {
              color: "rgba(33, 108, 160, 0.4)",
              type: "dashed",
            },
          },
          axisLine: {
            show: false,
          },
          axisLabel: {
            show: true,
            textStyle: {
              color: "#D1DEEE",
            },
            fontSize: 24,
            fontFamily: "Source Han Sans CN",
            formatter: function (value) {
              if (value === 0) {
                return value;
              }
              return value;
            },
          },
          axisTick: {
            show: false,
          },
        },
        dataZoom: [
          {
            type: "slider",
            show: true,
            height: 10,
            xAxisIndex: [0],
            bottom: "0%",
            start: 0,
            end: endPercent,
            handleIcon:
              "path://M306.1,413c0,2.2-1.8,4-4,4h-59.8c-2.2,0-4-1.8-4-4V200.8c0-2.2,1.8-4,4-4h59.8c2.2,0,4,1.8,4,4V413z",
            handleSize: "110%",
            handleStyle: {
              color: "#d3dee5",
            },
            textStyle: {
              color: "#fff",
            },
            borderColor: "#90979c",
          },
          {
            type: "inside",
            show: true,
            height: 10,
            start: 0,
            end: endPercent,
          },
        ],
        series: [
          {
            type: "custom",
            itemStyle: {
              color: "#113660",
            },
            renderItem: function (params, api) {
              //获取对应类目的axisTick中心点坐标
              let start = api.coord([api.value(0)]);

              //通过坐标系的宽度和类目数,计算单个类目的背景
              let width = (params.coordSys.width / categoryData.length) * 1.3;

              return {
                type: "rect",
                shape: {
                  // 相对左上角坐标
                  x: start[0] - width / 2,
                  y: params.coordSys.y,
                  width: width,
                  height: params.coordSys.height,
                },
                style: api.style(),
              };
            },
            data: [0, 0, 0, 0, 0, 0, 0],
          },

          {
            name: "污泥产率",
            data: bardata2,
            type: "bar",
            barCategoryGap: "20%",
            barWidth: "10px",
            barGap: 0.5,
            z: 2,
            itemStyle: {
              color: {
                x: 0,
                y: 1,
                x2: 0,
                y2: 0,
                type: "linear",
                colorStops: [
                  { offset: 0, color: "rgba(251, 159, 79,0)" },
                  { offset: 1, color: "rgba(251, 159, 79,1)" },
                ],
              },
            },
            // showBackground: true,
            // backgroundStyle: {
            //   color: "#113660",
            // },
          },
          {
            name: "泥量",
            data: bardata1,
            type: "bar",
            barCategoryGap: "20%",
            barWidth: "10px",
            barGap: 0.5,
            z: 2,
            itemStyle: {
              color: {
                x: 0,
                y: 1,
                x2: 0,
                y2: 0,
                type: "linear",
                colorStops: [
                  { offset: 0, color: "rgba(196, 248, 249,0)" },
                  { offset: 1, color: "rgba(196, 248, 249,1)" },
                ],
              },
            },
            // showBackground: true,
            // backgroundStyle: {
            //   color: "#113660",
            // },
          },
        ],
      };

      // 先设置图表
      this.NLFXChart.setOption(option, true);

      // 自动轮播 + dataZoom 自动移动
      let len = 0;
      let intervalId = setInterval(() => {
        if (len >= categoryData.length) {
          len = 0;
          // 重置 dataZoom 到起始位置
          this.NLFXChart.dispatchAction({
            type: "dataZoom",
            dataZoomIndex: 0,
            start: 0,
            end: endPercent,
          });
        }

        // 显示 tooltip
        this.NLFXChart.dispatchAction({
          type: "showTip",
          seriesIndex: 1, // 注意:索引改为1,跳过背景系列
          dataIndex: len,
        });

        // 移动 dataZoom
        const currentIndex = len;
        const startPercent = Math.max(
          0,
          Math.min(
            100 - endPercent,
            ((currentIndex - zoomWindowSize / 2) / totalPoints) * 100
          )
        );

        this.NLFXChart.dispatchAction({
          type: "dataZoom",
          dataZoomIndex: 0,
          start: startPercent,
          end: startPercent + endPercent,
        });

        len++;
      }, 6000);

      this.autoPlayNLFXInterval = intervalId;
    },
记得销毁定时器
c
  beforeDestroy() {
    if (this.autoPlayNLFXInterval) {
      clearInterval(this.autoPlayNLFXInterval);
    }
  },