02-全链路诊断
参考文档:
【只读参数】 | 只读参数=False,为何SQL执行速度变快?
obproxy_digest.log日志分析:obproxy_digest.log
抓包小Tip: 如何快速定位SQL慢在应用侧?
1、模拟造数
登录 oracle 租户下 tpcc 用户,创建3张测试表,模拟交易场景:
- tab1、tab2 结构一致
- tab3 为不同分区结构表
sql
-- 创建测试表
create table tab1 (c1 int primary key, c2 int, c3 varchar(10)) partition by hash(c1) partitions 10;
create table tab2 (c1 int primary key, c2 int, c3 varchar(10)) partition by hash(c1) partitions 10;
create table tab3 (d1 int primary key, d2 int) partition by list (d1)
(partition p0 values(1,2,3,4,5),
partition p1 values(6,7,8,9,10),
partition p2 values (11,12,13,14,15));

-- 插入测试数据
insert into tab1 select level, mod(level,10),'003' from dual connect by level<=150;
insert into tab2 select level, mod(level,5),'004' from dual connect by level<=150;
insert into tab3 select level, mod(level,3) from dual connect by level<=15;
commit;
2、参数检查与调整
2.1 查看只读路由参数
sys 租户执行:
sql
show parameters like 'ob_proxy_readonly_transaction_routing_policy'\G;默认值:True
2.2 调整慢SQL阈值参数
sql
-- 查看当前配置
show proxyconfig like 'query_digest_time_threshold';

-- 修改为100us
alter proxyconfig set query_digest_time_threshold='100us';

-- 复核修改结果
show proxyconfig like 'query_digest_time_threshold';
3、网络抓包操作流程
- 在
10.186.62.29打开数据库会话,新开OS命令行窗口 - 查看 obclient 会话端口
bash
netstat -anltp |grep obclient|grep 2883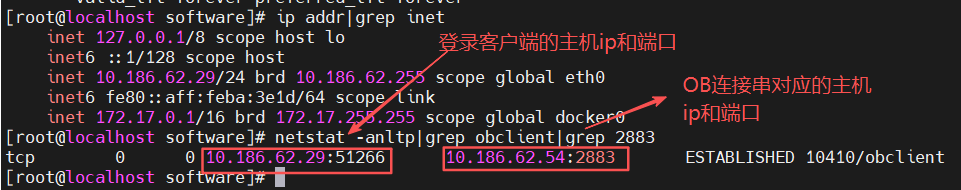
- 开始抓包
bash
tcpdump -i eth0 port 51266 -w /tmp/tcpdump.raw- 回到 obclient tpcc 用户窗口,执行测试SQL
sql
select c1,c2 from tab1 where c1=10;
select c1,c2 from tab2 where c1=10;
update tab3 set d2=2 where d1=10;
commit;
select c1,c2 from tab1 where c1=11;
select c1,c2 from tab2 where c1=11;
update tab3 set d2=3 where d1=11;
commit;Ctrl+C终止抓包- 抓包文件转文本便于分析
bash
tcpdump -X -r /tmp/tcpdump.raw > /tmp/tcpdump.txt
more /tmp/tcpdump.txt
3.1 抓包日志字段解析
- 第一列:时分秒毫秒
- 第二列:网络协议 IP
- 第三列:发送方IP+端口
- 第四列:
>数据流向 - 第五列:接收方IP+端口
- 第六列:冒号
- 第七列:数据包标识、seq、ack、窗口、数据长度
抓包结果日志解析:
SQL执行耗时规则:客户端发送请求时间 → 服务端返回响应时间
sql
select tab1 where c1=10 → 29.01 ms
select tab2 where c1=10 → 11.39 ms
update tab3 set d2=2 → 9.89 ms
commit → 3.27 ms
select tab1 where c1=11 → 6.23 ms
select tab2 where c1=11 → 15.35 ms
update tab3 set d2=3 → 16.00 ms
commit → 4.86 ms
5、gv$sql_audit 查看SQL执行详情
sys 租户执行:
sql
select svr_ip,query_sql,sql_id,plan_id, trace_id,rpc_count,plan_type,is_hit_plan,elapsed_time,execute_time,get_plan_time
from oceanbase.gv$sql_audit
where (query_sql like '%TAB1%' or query_sql like '%TAB2%' or query_sql like '%TAB3%')
and tenant_id=1001 and user_name='tpcc'
order by request_time\G;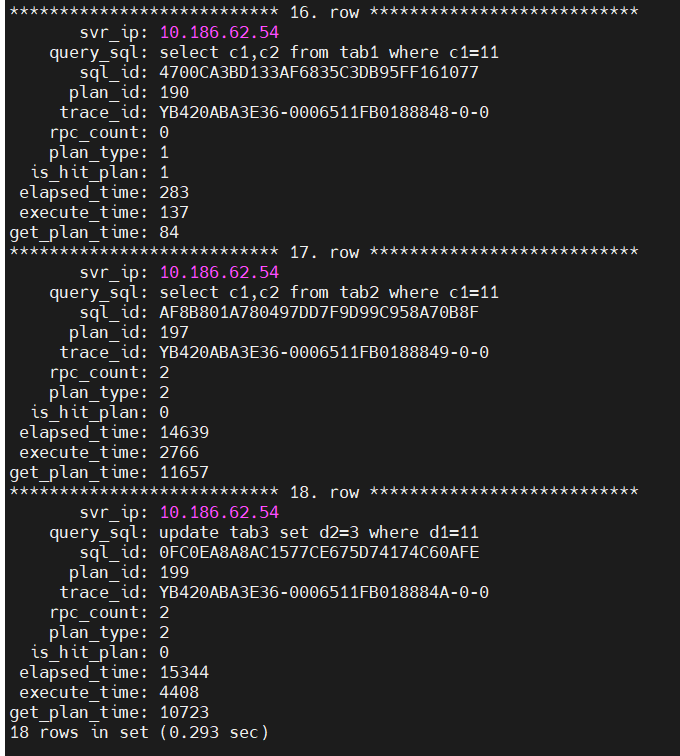
观察字段:rpc_count、plan_type、elapsed_time 等。
6、obproxy_digest.log 日志查看
bash
tail -100 /home/admin/logs/obproxy/log/obproxy_digest.log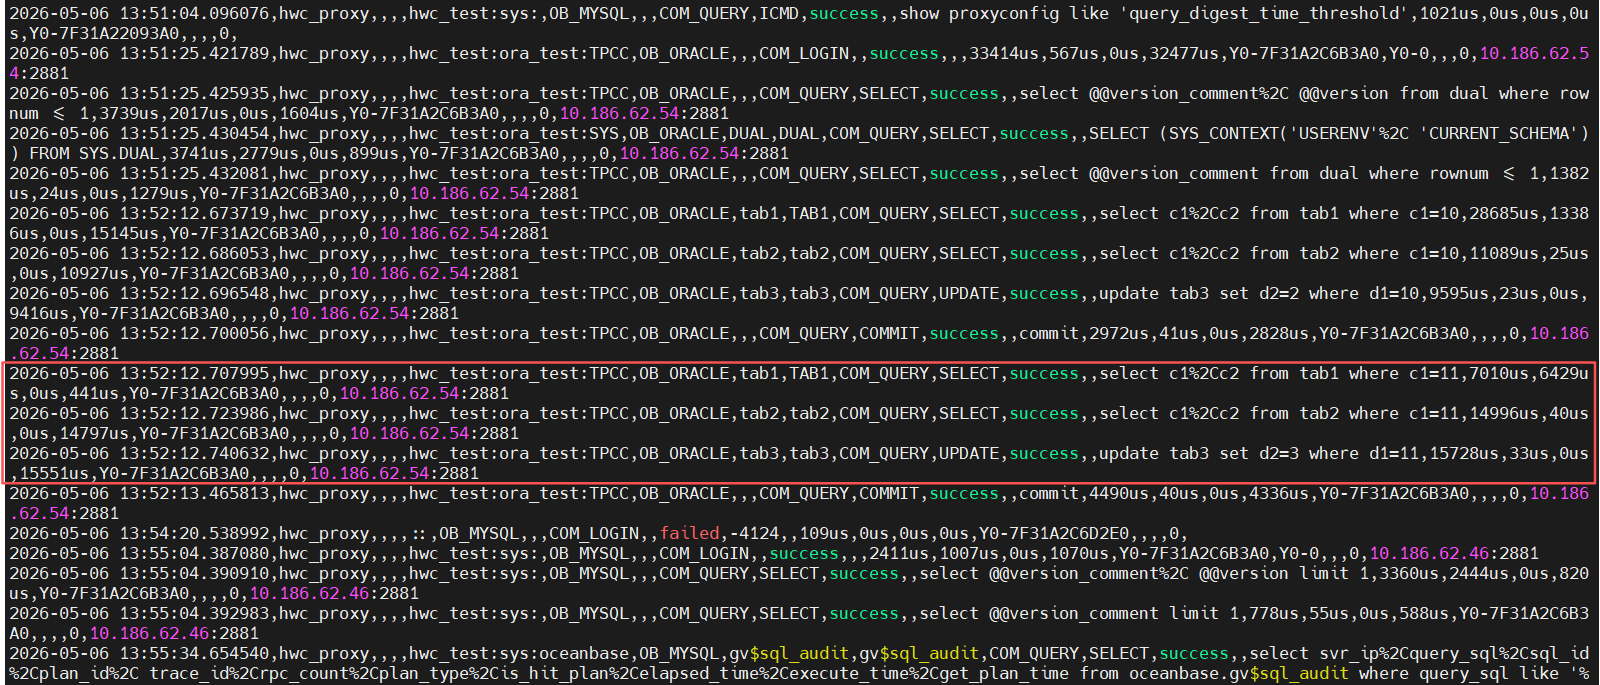
结论:从日志可见SQL总耗时不高,可排除网络层、数据库层基础瓶颈。
7、创建表组并关联表
sql
-- 创建表组,分区数与原表一致
create tablegroup tab_group partition by hash partitions 10;

-- 将tab1、tab2加入同一表组
alter table tab1 tablegroup tab_group;
alter table tab2 tablegroup tab_group;重复抓包+执行SQL全套流程,生成表组场景抓包日志。
8、有表组+只读参数=true 耗时统计
| SQL语句 | 执行耗时 |
|---|---|
| SELECT tab1 WHERE c1=10 | 5.64 ms |
| SELECT tab2 WHERE c1=10 | 1.85 ms |
| UPDATE tab3 SET d2=2 | 0.93 ms |
| COMMIT | 3.27 ms |
| SELECT tab1 WHERE c1=11 | 0.77 ms |
| SELECT tab2 WHERE c1=11 | 0.79 ms |
| UPDATE tab3 SET d2=3 | 4.77 ms |
| COMMIT | 3.64 ms |
表组对比结论
只读参数=true 时:使用表组执行效率 > 未使用表组
9、修改只读路由参数为 False
9.1 全局修改所有租户
sql
-- sys租户修改所有租户生效
alter system set ob_proxy_readonly_transaction_routing_policy=false tenant=all;
注意:必须加
tenant=all,否则仅对sys租户生效。
9.2 单租户修改语法
sql
-- MySQL模式租户
alter system set ob_proxy_readonly_transaction_routing_policy = true;

-- Oracle模式租户
alter system set ob_proxy_readonly_transaction_routing_policy = 'true';
10、多场景性能综合结论
重复执行SQL、抓包统计耗时,三种场景性能排序:
- 最快:
ob_proxy_readonly_transaction_routing_policy=False + 表组 - 次之:
ob_proxy_readonly_transaction_routing_policy=true + 表组 - 最慢:
ob_proxy_readonly_transaction_routing_policy=true + 无表组