零、写在前面
📌 本系列教程完整目录 :ArcGIS JS 系列基础教程(100个项目常用热门功能)
💡 在线示例 :完整可运行的 HTML 示例,无需任何环境配置,可直接在浏览器中打开体验
🗂️ 专栏导航 :收藏 + 关注,专栏文章第一时间送达
❤️ 一键三连:点赞(给教程充电)+ 评论(提问必回)+ 收藏(下次再看)
一、功能介绍
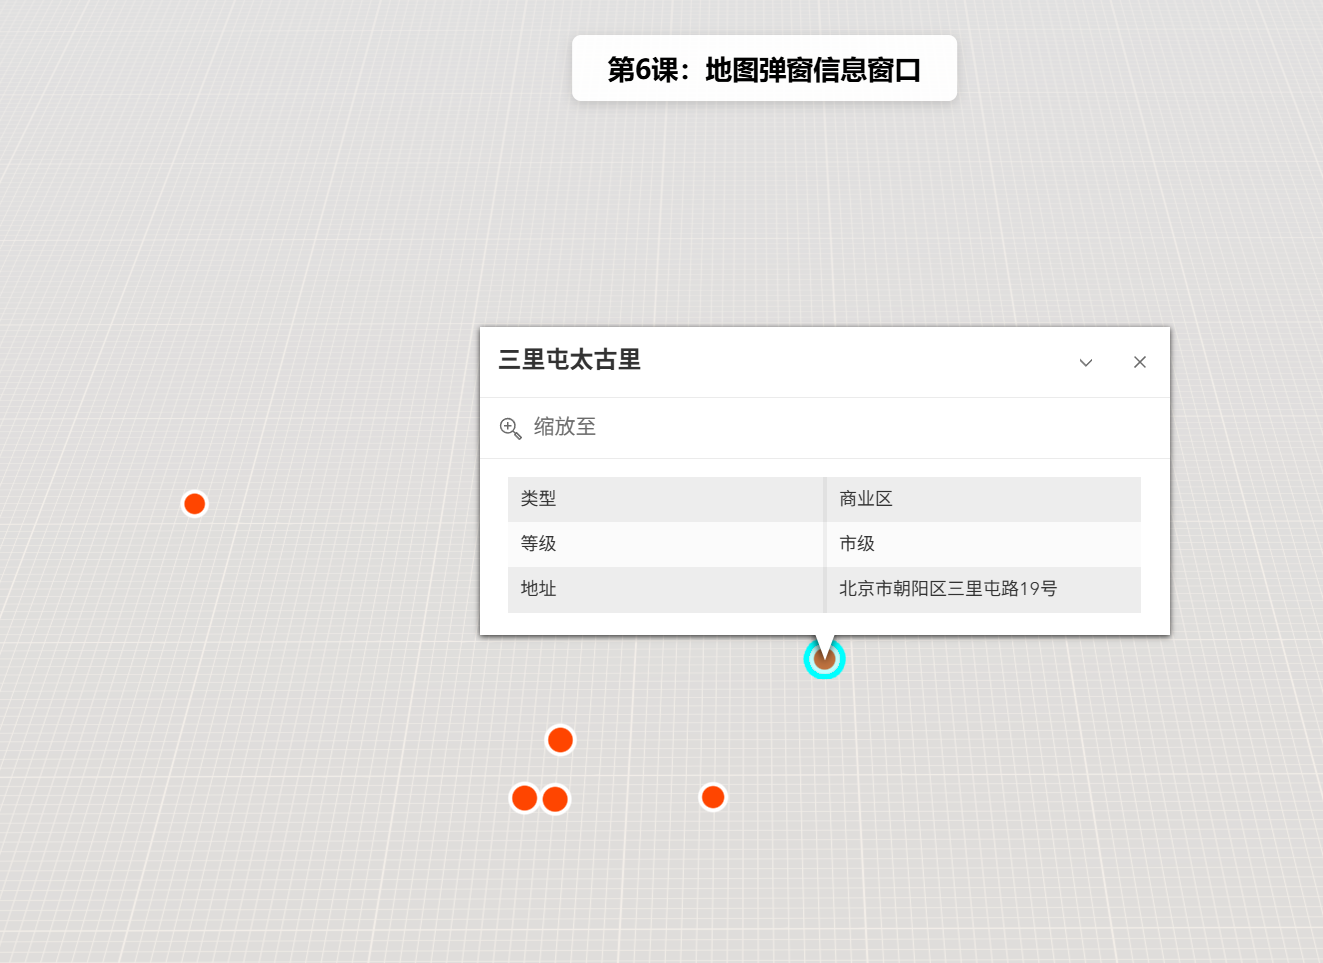
弹窗(Popup)是 ArcGIS JS 中用于在地图上展示要素详细信息的交互式窗口。当用户点击地图上的某个要素(如建筑物、兴趣点、行政区划等)时,弹窗会显示该要素的属性信息,如名称、面积、人口、类型等。支持自定义模板、动态字段、附件查看等高级功能。
二、功能实现
使用 MapView 的 popup 属性配置弹窗模板,通过 popupTemplate 定义字段显示格式。关键步骤:
- 创建
Graphic并设置popupTemplate - 将
Graphic添加到GraphicsLayer - 配置
MapView.popup启用点击触发弹窗
三、功能应用
- 城市信息展示:点击建筑物显示建筑名称、楼层数、用途等信息。
- 兴趣点(POI)查询:点击餐厅、加油站等显示详细信息、评分、联系方式。
- 行政区划查询:点击省/市/区县显示区域面积、人口、GDP 等数据。
- 数据采集:弹窗内支持编辑和提交表单,实现现场数据采集。
四、核心代码
html
<!DOCTYPE html>
<html lang="zh-CN">
<head>
    <meta charset="UTF-8">
    <meta name="viewport" content="width=device-width, initial-scale=1.0">
    <title>第6课:地图弹窗信息窗口</title>
    <link rel="stylesheet" href="https://js.arcgis.com/5.0/esri/themes/light/main.css">
    <script type="module" src="https://js.arcgis.com/5.0/"></script>
    <style>
        body { margin: 0; padding: 0; font-family: "Microsoft YaHei", sans-serif; }
        #mapContainer { width: 100vw; height: 100vh; }
        .page-title {
            position: absolute; top: 20px; left: 50%; transform: translateX(-50%);
            background: rgba(255,255,255,0.95); padding: 10px 24px; border-radius: 6px;
            font-size: 18px; font-weight: bold; z-index: 100;
            box-shadow: 0 2px 8px rgba(0,0,0,0.15);
        }
    </style>
</head>
<body>
<h1 class="page-title">第6课:地图弹窗信息窗口</h1>
<div id="mapContainer"></div>
<script type="module">
    const Map = await $arcgis.import("@arcgis/core/Map.js");
    const MapView = await $arcgis.import("@arcgis/core/views/MapView.js");
    const Graphic = await $arcgis.import("@arcgis/core/Graphic.js");
    const GraphicsLayer = await $arcgis.import("@arcgis/core/layers/GraphicsLayer.js");
    const getTianditu = await $arcgis.import("https://openlayers.vip/examples/resources/tianditu.js");
    // 获取天地图底图
    const vecLayers = getTianditu.default({ type: "vec_w" });
    // 创建地图
    const map = new Map({
        basemap: { baseLayers: [vecLayers.base, vecLayers.anno] }
    });
    // 创建MapView(2D视图,原生支持popup和constraints)
    const view = new MapView({
        container: "mapContainer",
        map: map,
        center: [116.4074, 39.9042],
        zoom: 12,
        popup: {
            dockEnabled: true,
            dockOptions: {
                position: "bottom-left",
                buttonEnabled: false,
                collapseEnabled: false
            }
        }
    });
    // 创建GraphicsLayer存储要素
    const graphicsLayer = new GraphicsLayer();
    map.add(graphicsLayer);
    // 示例数据:北京主要地标
    const landmarks = [
        {
            name: "故宫博物院",
            type: "景区",
            level: "5A级",
            address: "北京市东城区景山前街4号",
            coords: [116.3975, 39.9182]
        },
        {
            name: "天安门广场",
            type: "广场",
            level: "国家级",
            address: "北京市东城区东长安街",
            coords: [116.3975, 39.9042]
        },
        {
            name: "国家大剧院",
            type: "文化设施",
            level: "特级",
            address: "北京市西城区西长安街2号",
            coords: [116.3917, 39.9045]
        },
        {
            name: "北京站",
            type: "交通枢纽",
            level: "特等站",
            address: "北京市东城区建国门内大街甲13号",
            coords: [116.4274, 39.9046]
        },
        {
            name: "三里屯太古里",
            type: "商业区",
            level: "市级",
            address: "北京市朝阳区三里屯路19号",
            coords: [116.4495, 39.9385]
        },
        {
            name: "中关村",
            type: "科技园区",
            level: "国家级",
            address: "北京市海淀区中关村大街",
            coords: [116.3126, 39.9831]
        }
    ];
    // 创建弹窗模板
    const createPopupTemplate = (name, type, level, address) => ({
        title: name,
        content: [
            {
                type: "fields",
                fieldInfos: [
                    {
                        fieldName: "type",
                        label: "类型",
                        visible: true,
                        format: { digitSeparator: false }
                    },
                    {
                        fieldName: "level",
                        label: "等级",
                        visible: true
                    },
                    {
                        fieldName: "address",
                        label: "地址",
                        visible: true
                    }
                ]
            }
        ]
    });
    // 添加标注
    landmarks.forEach((landmark, index) => {
        const graphic = new Graphic({
            geometry: {
                type: "point",
                longitude: landmark.coords[0],
                latitude: landmark.coords[1]
            },
            symbol: {
                type: "simple-marker",
                color: [230, 76, 60, 0.9],
                outline: {
                    color: [255, 255, 255, 0.5],
                    width: 1
                },
                size: index < 3 ? 12 : 10
            },
            attributes: {
                name: landmark.name,
                type: landmark.type,
                level: landmark.level,
                address: landmark.address
            },
            popupTemplate: createPopupTemplate(
                landmark.name,
                landmark.type,
                landmark.level,
                landmark.address
            )
        });
        graphicsLayer.add(graphic);
    });
    // 默认弹出第一个点的信息
    view.when(() => {
        view.popup.open({
            location: { longitude: 116.3975, latitude: 39.9182 },
            title: landmarks[0].name,
            content: `类型:${landmarks[0].type}<br>等级:${landmarks[0].level}<br>地址:${landmarks[0].address}`
        });
        console.log("地图弹窗信息窗口示例加载完成!");
    });
</script>
</body>
</html>
五、在线示例
🔗 在线体验地址 :https://southjor.github.io/arcgis-examples/lessons/lesson6.html
📂 完整源码 :https://github.com/Southjor/arcgis-examples/blob/main/lessons/lesson6.html
六、弹窗参数速查
| 参数 | 类型 | 说明 | 默认值 |
|---|---|---|---|
title |
String | 弹窗标题(支持字段表达式) | null |
content |
Array/Object | 弹窗内容(支持文本、字段、附件等) | null |
fieldInfos |
Array | 字段显示配置(标签名、格式、可见性) | null |
actions |
Array | 自定义操作按钮 | null |
dockEnabled |
Boolean | 是否启用停靠模式 | false |
collapseEnabled |
Boolean | 是否显示折叠按钮 | true |
七、系列导航
⬅️ 上一篇 :ArcGIS JS 基础教程(5):地图限制缩放级别和显示范围
➡️ 下一篇:ArcGIS JS 基础教程(7):\[待发布(暂未发布)
💬 有问题欢迎在评论区留言,我会第一时间回复!
📢 关注我的专栏,后续持续更新 ArcGIS JS 100 个常用功能教程