本文主要介绍通过 Python 从 NASA地球数据网 下载
Terra 卫星上中分辨率成像光谱仪(MODIS)传感器获取的全球月尺度植被指数产品(MOD13A3),空间分辨率为1km。整体流程如下:
申请一个 earthdata 账号
配置 Python 依赖
查询数据
绘制查询结果范围并检查查询结果
下载数据
本例以查询、下载和处理2025年5月至2026年4日洛阳市 MOD13A3 NDVI 数据为例。
1 配置 Python 依赖
Python: 3.12
安装以下库(内置库或关联库已忽略):
gma: 3.0.0a15(下载:https://pypi.org/project/gma/3.0.0a15/)
requests: 2.32.3
tqdm: 4.67.1
earthaccess: 0.15.1
2 检索数据
本例使用的基础省、市、县三级行政区矢量数据来源于锐多宝 。下载地址:省市县。
2.1 查询数据
python
import earthaccess
import os, glob
from gma import gio, etools, env
import tqdm
import datetime as dt
import numpy as np

os.environ['EARTHDATA_USERNAME'] = '你的用户名' # 替换为你的用户名
os.environ['EARTHDATA_PASSWORD'] = '你的密码'   # 替换为你的密码

shi = gio.open_vector("T2024年初地级.shp")
ly = shi.select('"地名" == "洛阳市"')


########################## 自定义函数
def search(temporal, bounds, name = 'MOD13A3'):
    # 2. 搜索MOD13A3月度产品
    query_res = earthaccess.search_data(
        short_name = name,
        bounding_box = bounds,
        temporal = (temporal),
        count = 1000
    )
    return query_res
##########################

# 查询
temporal = ('2024-05-01', '2025-04-30')
name = 'MOD13A3'
auth = earthaccess.login()
query_res = search(temporal, ly.bounds, name)
查询到12期数据:

2.2 绘制数据范围
python
########################## 自定义函数
def explode_gpolygons_to_points(GPolygons):
    '''解包 gpolygon 到坐标点'''
    geo_pts = []
    for bo in GPolygons.get('GPolygons', []):
        pts = bo.get('Boundary', {})
        bo_pts = []
        for pt in pts.get('Points', []):
            pt = list(pt.values())
            bo_pts.append(pt)
        geo_pts.append(bo_pts)
    return geo_pts
##########################

################# 提取第一个检索结果信息
rest = query_res[0]
umm = rest['umm']

## 分片编号
tile_number = umm['GranuleUR'].split('.')[2]

## 分片范围
gpolygons = umm['SpatialExtent']['HorizontalSpatialDomain']['Geometry']
pts = explode_gpolygons_to_points(gpolygons)
data_ext = gio.Geometry(pts)

########################################### 绘制
import matplotlib.pyplot as plt
from gma.carto import plot, inres
from gma import crs

plt.figure(dpi = 300)
plt.rcParams['font.family'] = 'Times New Roman'

sheng = gio.open_vector("T2024年初省级.shp")
sdx = gio.open_vector("十段线.shp")

mf = plot.MapFrame(crs = 4326, bounds = (73.4, 2.8, 135.2, 53.6))

### 背景
mf_b0 = mf.add_vector(inres.WorldLayer.Country, facecolors = 'white', linewidths = 0.1)
mf.set_background('#E0FFFF')

## 数据
mf_l0 = mf.add_vector(sheng, linewidths = 0.2)

mf_l1 = mf.add_vector(data_ext, facecolors = '#FFE4C444', linewidths = 0.5)
mf_l1_lb = mf_l1.add_labels(tile_number)

mf_l2 = mf.add_vector(sdx, linewidths = 0.5)

mf_l3 = mf.add_vector(ly, facecolors = '#EEC900', linewidths = 0.2)

## 设置经纬网
gl = mf.add_graticule(lw = 0.4, ls = (6, (6, 6)))
ol = gl.set_outline(lw = 0.7)
tk = gl.set_ticks(lw = 0.4)
lb = gl.set_labels()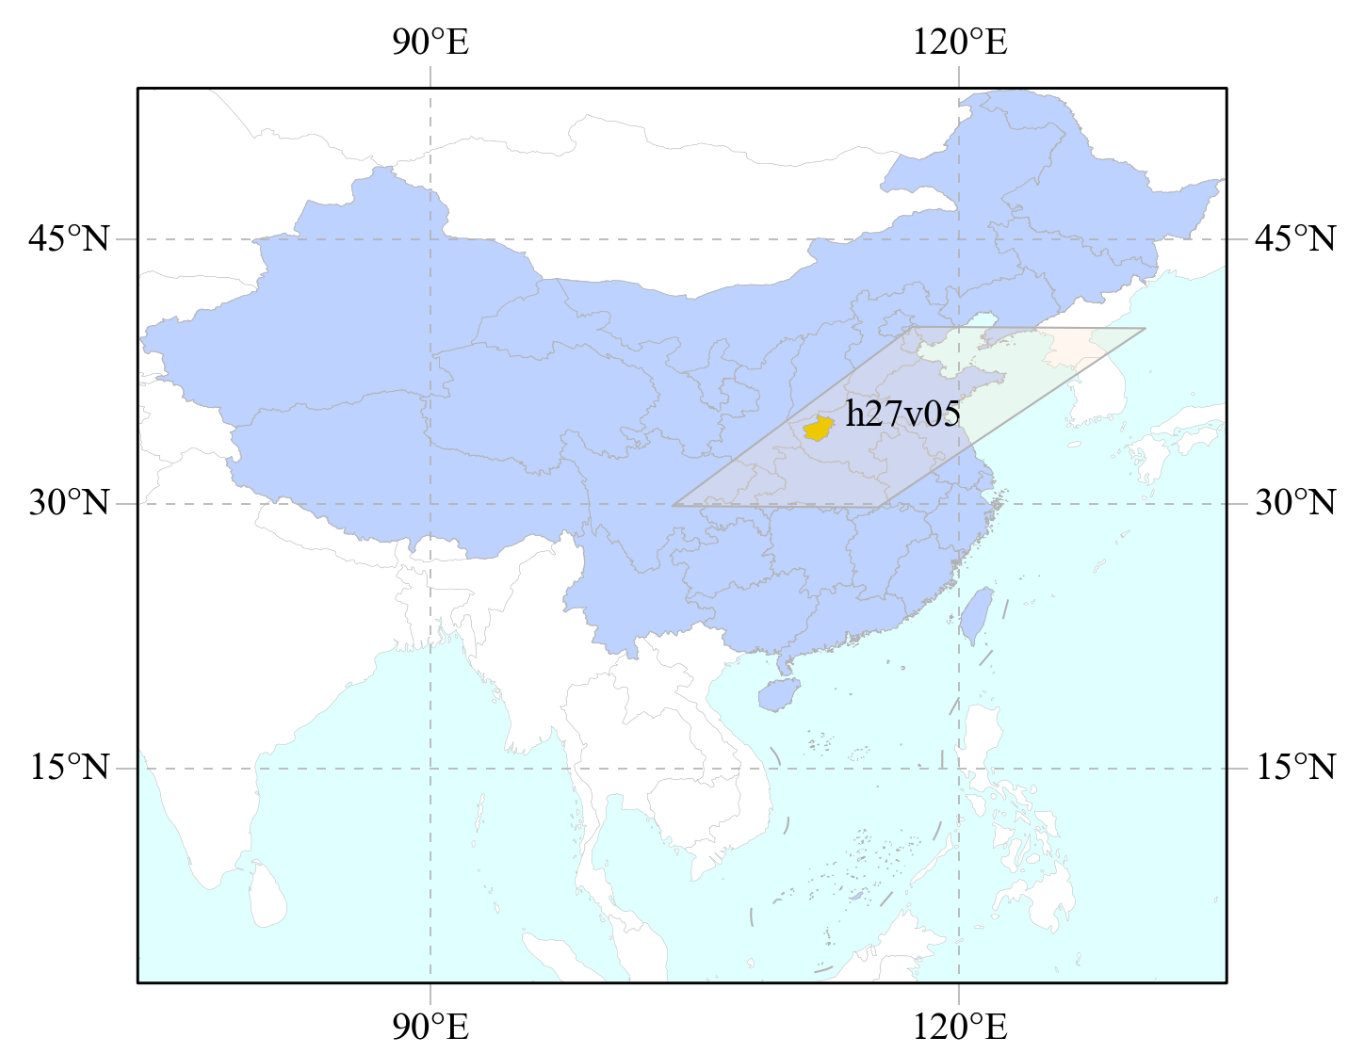
3 下载数据
python
########################## 自定义函数
def bar_info(info, per):
    # 手搓进度条
    l = 40
    l_do = int(per * l)
    do = "|" * l_do
    un_do = "-" * (l - l_do)
    text = f'\r{info} {do}{un_do} {int(per * 100):3d} %'
    print(text, end = '', flush = True)

def download(results, download_path):
    stat_info = {}
    lens = len(results)
    for i, res in enumerate(results):
        umm = res.get('umm')
        link = umm['RelatedUrls'][0]['URL']

        name = os.path.basename(link)
        out_file = f"{download_path}\\{os.path.basename(link)}"

        info = f'当前下载({i + 1}/{lens}):{name}'
        bar_info(info, 0)

        if os.path.exists(out_file):
            bar_info(info, 1)
            continue

        response = session.get(link, stream = True)
        if response.status_code == 200:
            total_size = int(response.headers.get('content-length', 0)) # 数据总大小
            total = int(np.ceil(total_size / chunk_size)) # 分块数量
            with open(out_file, "wb") as file: # 分块下载
                 for i, chunk in enumerate(response.iter_content(chunk_size = chunk_size)):
                     if chunk:
                         file.write(chunk)
                         bar_info(info, (i + 1) / total)
        else:
            print(f"Error: {response.status_code}. {response.text}")

##########################
# 下载
chunk_size = 81920
download_path = r'E:\MODIS\RAW\VI'
session = auth.get_session()
download(query_res, download_path)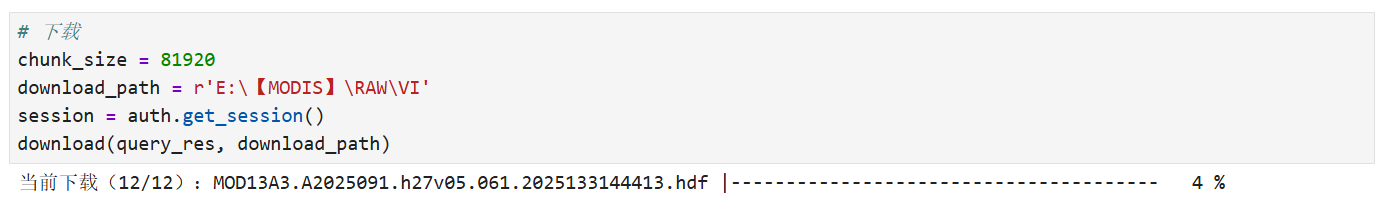
4 提取NDVI数据并裁剪到洛阳市范围
python
########################## 自定义函数
def group_hdfs(hdf_dir):
    hdfs = glob.glob(f'{hdf_dir}/*.hdf')
    stat_info = {}
    for hdf in hdfs:
        name = os.path.basename(hdf)
        date = dt.datetime.strptime(name.split('.')[1][1:], '%Y%j')
        ym = date.strftime("%Y%m")
        if ym not in stat_info:
            stat_info[ym] = [hdf]
        else:
            stat_info[ym].append(hdf)
    return stat_info
##########################
## 注意:netCDF格式(.hdf)不支持中文路径
res_path = r'E:\MODIS\NDVI'
stat_info = group_hdfs(download_path)

aoi_file = ly.link
env.GeoCallBack = lambda x, *args: bar_info(date, x)
for date, fs in stat_info.items():
    out_f = f'{res_path}/{name}_NDVI_1KM_{date}.tif'
    if os.path.exists(out_f):
        bar_info(date, 1)
        continue
    ## 多景使用镶嵌,这里每个月只有一景,但也可以采用多景的方式
    all_ds = [gio.open_raster(f, 0) for f in fs]
    mds = etools.mosaic(all_ds, out_f, dst_crs = 4326, cutline = aoi_file, crop_to_cutline = True)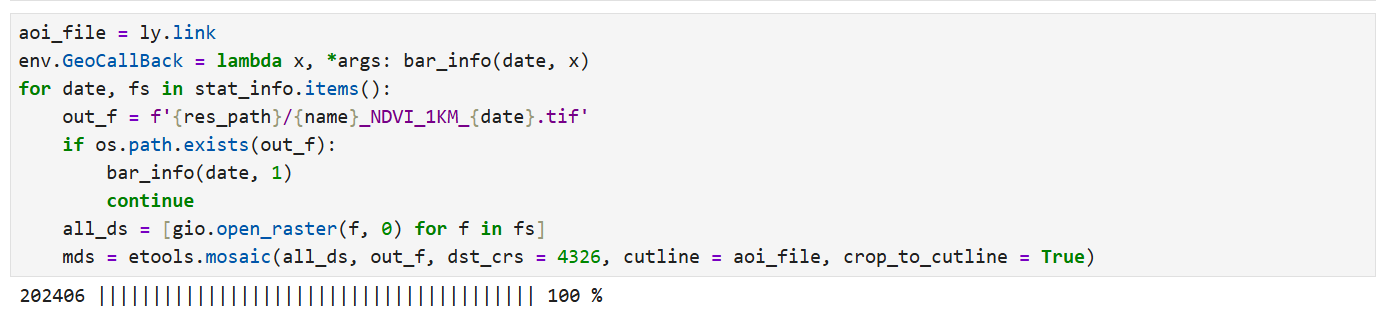
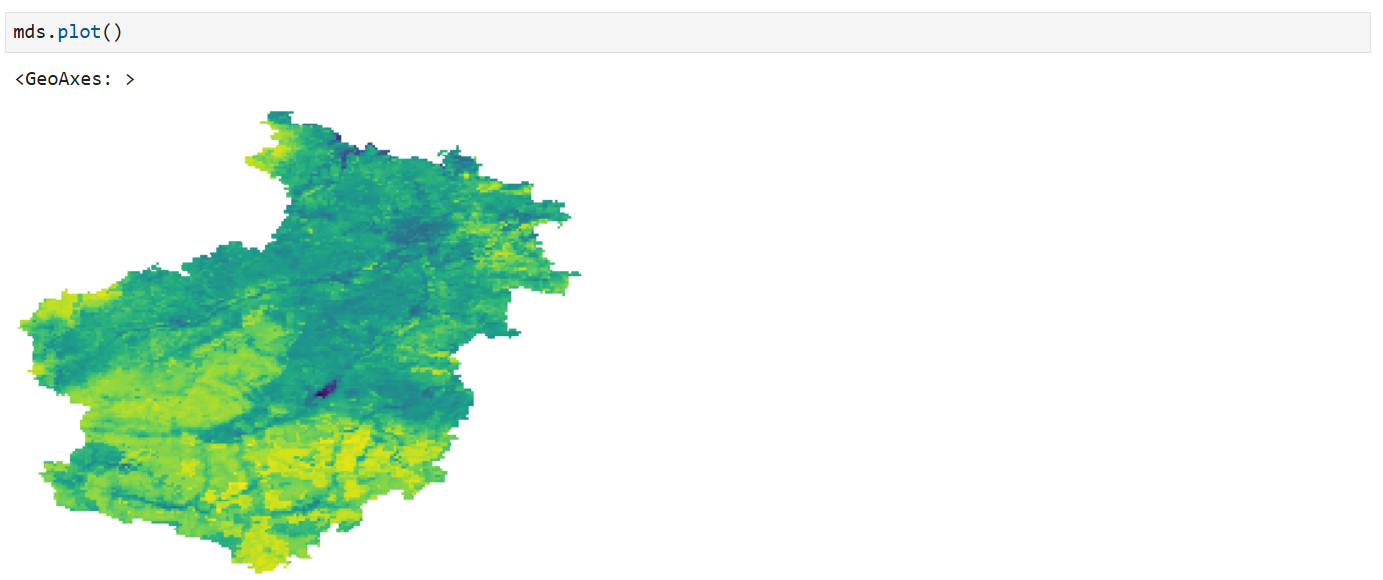
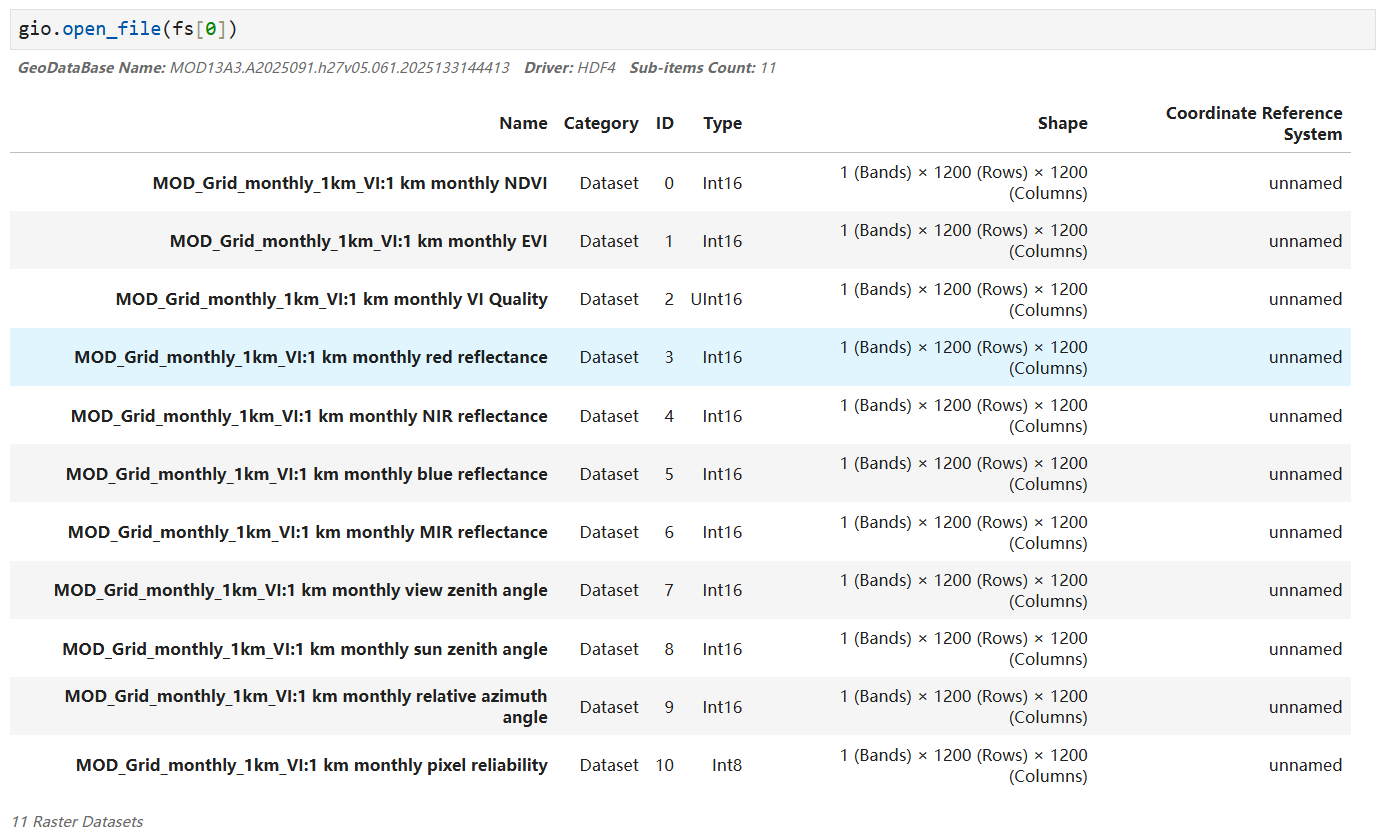
注意: 下载的 MOD13A3 数据 (hdf文件)第一个子数据集是NDVI数据