一、问题描述
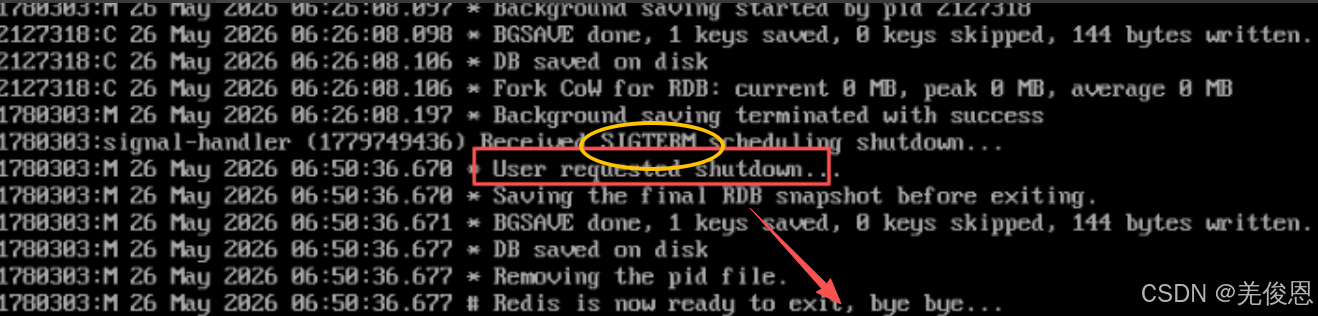
某次redis由7.4.5升级到8.6.3后,多次启动无故宕机,查看日志报错:Received SIGTERM scheduling shutdown...,如下所示:
关联资源:The Linux Kernel documentation、redis信号处理
二、问题排查处理
1) 查看redis本身日志
如上所示,redis自身报:1780303:signal-handler Received SIGTERM scheduling shutdown...收到 SIGTERM 信号 → 系统 / 用户主动下发了优雅关闭指令,但现场实际无人操作,也就是是系统下发了,系统下发一般都是OOM的锅;
The SIGTERM and SIGINT signals tell Redis to shut down gracefully. When the server receives this signal, it does not immediately exit. Instead, it schedules a shutdown similar to the one performed by the SHUTDOWN command. The scheduled shutdown starts as soon as possible, specifically as long as the current command in execution terminates (if any), with a possible additional delay of 0.1 seconds or less.
If the server is blocked by a long-running Lua script, kill the script with SCRIPT KILL if possible. The scheduled shutdown will run just after the script is killed or terminates spontaneously.
2)查看系统日志是否涉及OOM
bash
dmesg -T | grep -i redis
dmesg -T | grep -i "oom"
dmesg -T | grep -i "out of memory"
dmesg -T | grep -i "killed process"

#启用swap
fallocate -l 1G /swapfile
mkswap /swapfile
swapon /swapfile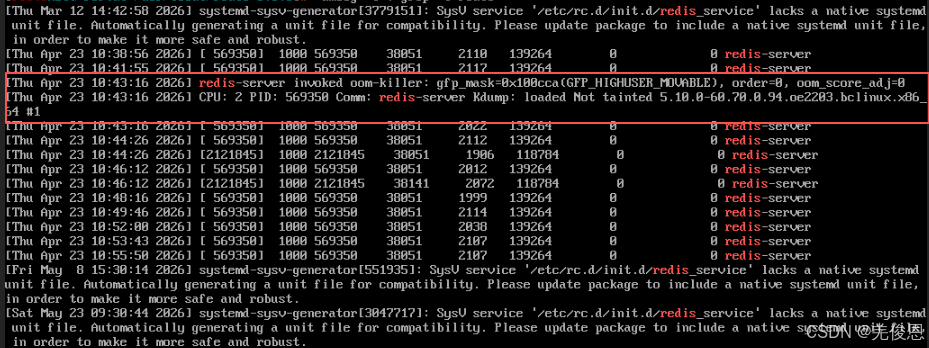
Thu Apr 23 10:43:16 2026 redis-server invoked oom‑killer: gfp_mask =0x1400c0(GFP_HIGHUSER_MOVABLE ), order=0, oom_score_adj=0
Thu Apr 23 10:43:16 2026 CPU: 2 PID: 56935 Comm: redis-server Kdump: loaded Tainted: xxxx
其中,invoked oom‑killer = 触发系统内存溢出保护机制;当系统物理内存耗尽,内核选择杀掉占用内存最高的进程(redis-server)释放内存;OOM 先发送 SIGTERM 信号 ,Redis 执行正常持久化、优雅退出流程(你之前看到的正常关闭日志)若仍未释放内存,会直接发送 SIGKILL 强制杀死,OOM Killer 默认发送的是 SIGKILL。SIGTERM 是一个"请求终止"信号,通常由运维人员、运维脚本、Systemd 或容器管理器发出。
当内存耗尽时,因内存无法像 CPU 那样通过"排队"来无限复用。当进程申请内存(如 malloc 触发缺页中断,或内核调用 kmalloc)时,内核的页分配器(Buddy System)找不到空闲页。
- 内存回收(Reclaim)失败:内核首先会尝试"自救"。它会唤醒 kswapd 内核线程,或者直接同步调用 __alloc_pages_slowpath,内核尝试回收文件页(Page Cache)或交换页(Swap)。
- 触发点:如果经过多轮回收(Direct Reclaim),空闲内存水位(Watermark)依然低于 min 线,且无法通过 Swap 释放更多内存,内核就会判定为 OOM。
- OOM触发后内核会遍历所有进程,计算它们的 oom_score。计算公式逻辑:主要基于进程占用的物理内存大小(RSS + Page Tables 等)。占用越多,分越高。当然我们可人为干预:可以通过
/proc/<pid>/oom_score_adj调整分数。如:设置为 -1000 可以保护关键进程不被杀;设置为 1000 则极易被杀。内核选中分数最高的进程,打印日志:Out of memory: Kill process <pid> (<process_name>) score <score> or sacrifice child。调用force_sig(SIGKILL)强制终止该进程。之后会释放内存:等待进程退出,释放其占用的页框,系统恢复运行。
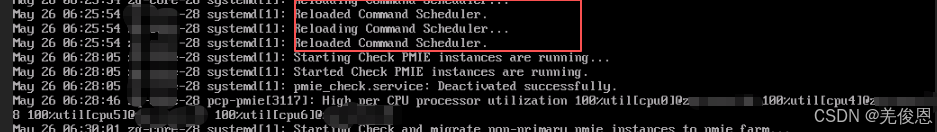
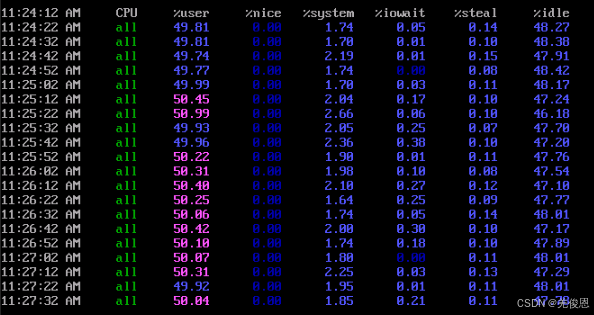
3)另外一台同样日志报错内容,现象也类似,但系统日志未发现OOM,而是报CPU使用率占满100%;
signal-handler (1779749436):Receiced SIGTERM schedule shutdown.
User requested shutdown.
Savingthe final RDB snapshot before exiting.
bash
journalctl -k -n 50 --no-pager| grep -i redis
grep -i kill /var/log/syslog
grep -i oom /var/log/syslog
journalctl -axm| grep -i signal
#sysstat
#sar是Linux中用于历史性能回溯的监控工具,需启用sysstat服务并配置cron定时采集,数据存于/var/log/sysstat/,支持按日期、时间范围查看CPU、内存、I/O等指标;ksar是一个图形化工具,可以将sar收集的数据以图表形式展示,便于更直观地分析历史CPU使用情况;还可用用 sadf -d /var/log/sysstat/sa12 可将二进制数据转为 CSV 格式,方便导入 Excel 或 Grafana 分析
#通过配置文件 /etc/default/sysstat(Debian/Ubuntu)或 /etc/sysconfig/sysstat(RHEL/CentOS),将 ENABLED="false" 改为 ENABLED="true";查看cron 任务已启用:系统会通过 /etc/cron.d/sysstat 每 10 分钟运行一次 sadf -F -- -A,把原始数据写入 /var/log/sysstat/saXX;首次启用后,需等待至少一个采集周期(默认 10 分钟)才能生成首份数据
#日志默认只保留 7 天(由 /etc/cron.d/sysstat 中的 sa1 脚本控制),如需长期归档,可修改 /etc/sysconfig/sysstat 中的 HISTORY=28(保留 28 天);sar 默认采样间隔为 10 分钟,如需更高精度(如排查短时毛刺),可临时运行 sar -u 1 60(每秒采样 1 次,共 60 次),但不写入历史日志
#查看历史cpu使用情况
sar -u -f /var/log/sysstat/sa$(date -d "yesterday" +%d) # 替换为具体日期
ar -u -s 00:00:00 -e 23:59:59 -f /var/log/sysstat/saXX # 假设你每天生产一份性能记录,可直接插当天的,XX为日期,如sa15表示15日
top -p `pidof redis-server`
perf top -s comm # 查看当前系统运行进程占比
perf record # 记录采样信息
perf report -s comm # 分析记录的信息
apt-get install collectl # 安装collectl
collectl --all # 显示所有子系统的统计信息
ps aux --sort=-%cpu | head -n 16
ps aux --sort=-%mem | head -n 16
ps -eo pid,ppid,cmd,%cpu --sort=-%cpu | head
iostat -c -x 1#查看CPU和I/O的状态
ps -eo pid,ppid,lwp,comm,%cpu --sort=-%cpu | head -20 #列出 CPU 占用前 20 的线程及其所属进程名和父进程;内核线程(如 ksoftirqd、kworker)持续高占用:可能是网卡软中断不均衡(多队列未开启或 RPS/RFS 未配置)、存储驱动异常、或硬件故障(如坏盘引发大量重试)
top -b -o +%MEM -n 1 | head -n 22 #top按 P(大写)按 CPU 使用率排序,若 %us 高(如 >80%):问题大概率出在某个用户进程(如 Java 应用死循环、Python 脚本未设 sleep、Node.js 同步阻塞操作);若 %sy 高(如 >50%):说明内核工作繁重,常见于频繁系统调用、软中断堆积(如网卡收包过载)、spinlock 争用、或内核模块 bug;同时看 %wa(iowait)是否很低:如果接近 0,基本可排除磁盘 I/O 瓶颈导致的假性高 CPU
top -H -p <PID>#查看指定进程内的哪个线程(LWP)占用最高
pidstat -t -p <PID> 1 #持续监控某进程的各线程 CPU 使用变化,抓瞬时峰值
jstack <PID> #查看线程栈,重点关注 RUNNABLE 状态且堆栈停留在业务方法或正则匹配、JSON 解析等 CPU 密集处;配合
jstat -gc <PID> #排查是否频繁 GC 导致 CPU 暴涨
strace -cp <PID> #统计该进程系统调用耗时分布,若 epoll_wait、read、write 占比异常低而 nanosleep 高,可能程序逻辑空转
#其他
sar -u -f /var/log/sysstat/sa12:查看 12 日的 CPU 使用率(%user、%system、%iowait 等)
sar -r -f /var/log/sysstat/sa12:查看当日内存使用情况(%memused、kbmemfree、kbbuffers 等)
sar -b -f /var/log/sysstat/sa12:查看磁盘整体 I/O 统计(tps、rd_sec/s、wr_sec/s)
sar -n DEV -f /var/log/sysstat/sa12:查看网卡流量(eth0、ens33 等接口的 rxkB/s、txkB/s)
sar -q -f /var/log/sysstat/sa12:查看系统平均负载(load average)和运行队列长度
sar -u -f /var/log/sysstat/sa12 09:00:00 10:30:00 查看上午 9 点到 10 点半的 CPU 曲线
#指标参考
pgpgin/pgpgout:每秒换入/换出的页数(单位:KB)。数值高不一定异常,但若伴随高 %iowait 和低吞吐量,可能是内存不足触发频繁 swap
rkB/s + wkB/s:磁盘读写带宽总和。对比磁盘理论上限(如 SATA III 约 600MB/s,NVMe 可达 3GB/s+)可评估是否饱和
%iowait:CPU 等待 I/O 完成的时间占比。持续高于 5%--10%
%idle:CPU 空闲时间。若长期接近 0%,说明 CPU 资源紧张;但单次突降不意味故障,需结合运行队列(runq-sz)和上下文切换(cs)综合判断
#一般cpu是不会记录到内核日志的
sudo auditctl -a always,exit -F arch=b64 -S kill #添加监控规则,监控所有进程的 kill 系统调用,其中,always:始终生成审计记录;exit:在系统调用退出时触发(捕获返回值),-F过滤器64位,-S kill指定要监控的系统调用(Syscall);kill 的系统调用号是 62(64位),而 32 位是 37
auditctl -l | grep kill #查看当前规则,/usr/share/doc/audit/rules/ 目录提供多套符合安全标准的预配置规则
#/etc/audit/rules.d/下10-base-config为内核与 auditctl 配置;30-stig / 30-pci主审计规则;31-privileged为特权命令监控;99-finalize为锁定配置(-e 2)
augenrules --load #加载规则
ausearch -sc kill #查看审计日志
#其他
ps aux | grep -E 'minerd|cryptominer|xmrig'#搜索可疑的进程
ulimit -u 200 # 限制每个用户最多只能运行200个进程
#使用cgroups来更细致地配置资源分配,更好对CPU和内存限制
cgcreate -g cpu:/cpugp # 创建一个名为cpugp的CPU控制组
cgset -r cpu.shares=512 cpugp # 为cpugp设置CPU份额为512
cgexec -g cpu:/cpugp<command> # 在mygroup控制组中执行命令
#cputool 或 cpulimit 限制
cpulimit-p <PID> -l 50 #临时限制其最多使用 50% CPU
#将磁盘调度算法切换为deadline或noop,优化I/O
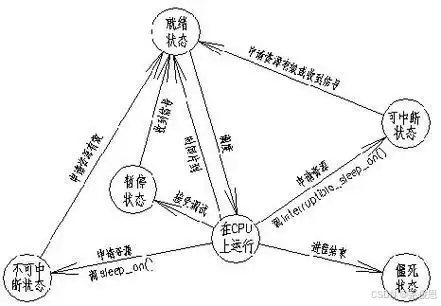
echo deadline > /sys/block/sda/queue/scheduler当 CPU 利用率达到 100% 时,意味着所有 CPU 核心的运行队列(Run Queue)中都塞满了可运行的进程,cfs_rq(CFS 运行队列)中的进程数量远大于 CPU 核心数,内核必须极其频繁地进行上下文切换(Context Switch)。此时内核并没有"报错",而是进入了高强度的调度(Scheduling)状态。在 5.10 内核中,普通进程由 CFS 管理。内核使用 vruntime(虚拟运行时间)来衡量进程获得的 CPU 时间。进程太多,每个进程分到的时间片变短,或者等待运行的时间变长。内核会尝试通过 sched_min_granularity_ns 等参数来平衡,但在 100% 负载下,高优先级进程可能会抢占低优先级进程,导致低优先级进程出现"饥饿"。比起OOM,Linux 内核没有"CPU OOM"机制。即使 CPU 100%,内核也只会拼命调度,不会主动杀死进程。
如果某个进程占用了 CPU 且禁止抢占(例如在内核态执行了很长的循环且不调用 cond_resched()),导致 RCU(Read-Copy Update)机制的宽限期(Grace Period)超时(通常几十秒),内核会打印 INFO: rcu_sched detected stalls on CPUs/tasks。这是最接近"CPU 崩溃"的内核报错。如果 100% 是 %sys(系统态)或 %si(软中断)高,说明内核在处理网络包或磁盘 IO,这会导致用户态进程完全得不到调度,表现为"系统卡死"。
当 CPU 使用率持续达到 100% 时,内核的完全公平调度器(CFS, Completely Fair Scheduler)满负荷工作,通常可能会导致以下现象:
- 系统响应变慢(卡顿): 由于 CPU 没有空闲时间片处理新的指令,用户的交互操作(如鼠标点击、命令行输入)会有明显的延迟。
- 进程排队(Run Queue 增长): 可运行的进程队列(Run Queue)长度会增加。load average(平均负载)数值会显著上升,通常会超过 CPU 的核心数量。
- I/O 等待增加: 如果是 I/O 密集型任务导致的 100% 占用,系统可能会出现大量的 iowait,导致磁盘读写变慢。
- OOM Killer 可能被触发 (极端情况): 如果 CPU 100% 是由于内存不足导致的频繁换页(Swapping)引起的,系统可能会触发 OOM Killer 来终止某些进程以释放资源。
4)处理
对于redis可增加如下,更多参看redis官网配置:
maxmemory 2G # 根据服务器内存设置,不超过物理内存70%
maxmemory-policy volatile-lru
bash
#调低优先级,这样oom不会杀掉
echo -1000 > /proc/$(pidof redis-server)/oom_score_adj

vi /etc/systemd/system/redis-server.service #或服务力添加
[Service]
Type=notify
User=redis
Group=redis
ExecStart=/usr/bin/redis-server /etc/redis/redis.conf
OOMScoreAdjust=-1000

systemctl daemon-reload
systemctl restart redis-server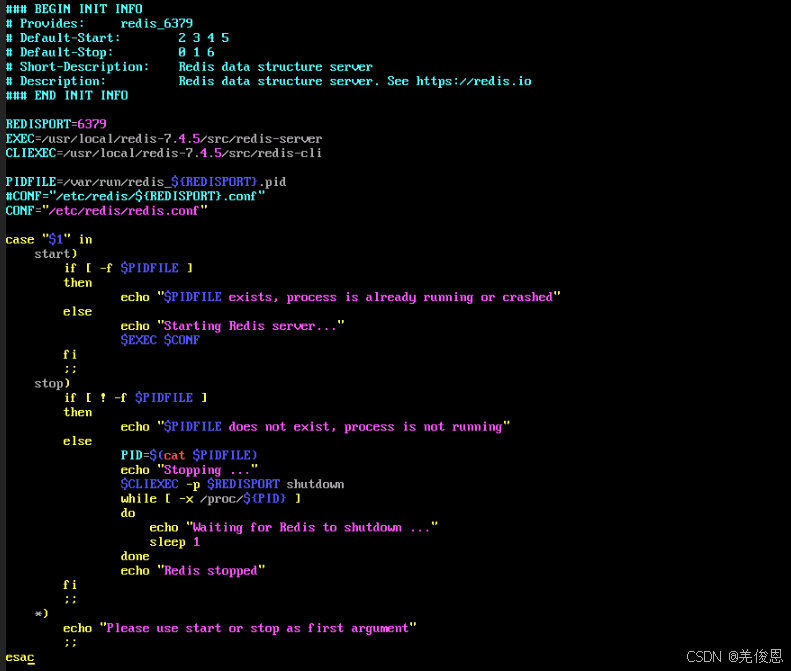
5)综上:
1、CPU 100% 不会导致 Redis 崩溃:即使 Redis 把 CPU 跑满,内核也只是拼命调度它。只要没有发生 RCU Stall 这种内核级死锁,Redis 依然能响应信号。现场CPU高的那台,虽然没看到 OOM 日志,且 Redis 打印了"Received SIGTERM",这大概率是外部管理系统(如 systemd、K8s 或运维脚本(现场有pc-)) 因为检测到 CPU 过高或其他原因,主动发信号让 Redis 停机的,而非内核自动触发的崩溃。CPU长期100%需先区分用户态(%us高)或内核态(%sy高)耗尽,再用top/ps/pidstat定位高占用进程与线程,结合jstack、SHOW PROCESSLIST、strace等分析根因,最后通过cpulimit或cgroups限频;
2、如果是 OOM,日志会完全不同:如果是内存不足导致 Redis 被杀,你在 dmesg 或 /var/log/messages 中一定能看到 Out of memory: Kill process ... redis-server 这样的字样。
三、附录,官方redis.conf配置
bash
include redis.conf

loadmodule ./modules/redisbloom/redisbloom.so
loadmodule ./modules/redisearch/redisearch.so
loadmodule ./modules/redisjson/rejson.so
loadmodule ./modules/redistimeseries/redistimeseries.so

############################## QUERY ENGINE CONFIG ############################

# Keep numeric ranges in numeric tree parent nodes of leafs for `x` generations.
# numeric, valid range: [0, 2], default: 0
#
# search-_numeric-ranges-parents 0

# The number of iterations to run while performing background indexing
# before we call usleep(1) (sleep for 1 micro-second) and make sure that we
# allow redis to process other commands.
# numeric, valid range: [1, UINT32_MAX], default: 100
#
# search-bg-index-sleep-gap 100

# The default dialect used in search queries.
# numeric, valid range: [1, 4], default: 1
#
# search-default-dialect 1

# the fork gc will only start to clean when the number of not cleaned document
# will exceed this threshold.
# numeric, valid range: [1, LLONG_MAX], default: 100
#
# search-fork-gc-clean-threshold 100

# interval (in seconds) in which to retry running the forkgc after failure.
# numeric, valid range: [1, LLONG_MAX], default: 5
#
# search-fork-gc-retry-interval 5

# interval (in seconds) in which to run the fork gc (relevant only when fork
# gc is used).
# numeric, valid range: [1, LLONG_MAX], default: 30
#
# search-fork-gc-run-interval 30

# the amount of seconds for the fork GC to sleep before exiting.
# numeric, valid range: [0, LLONG_MAX], default: 0
#
# search-fork-gc-sleep-before-exit 0

# Scan this many documents at a time during every GC iteration.
# numeric, valid range: [1, LLONG_MAX], default: 100
#
# search-gc-scan-size 100

# Max number of cursors for a given index that can be opened inside of a shard.
# numeric, valid range: [0, LLONG_MAX], default: 128
#
# search-index-cursor-limit 128

# Maximum number of results from ft.aggregate command.
# numeric, valid range: [0, (1ULL << 31)], default: 1ULL << 31
#
# search-max-aggregate-results 2147483648

# Maximum prefix expansions to be used in a query.
# numeric, valid range: [1, LLONG_MAX], default: 200
#
# search-max-prefix-expansions 200

# Maximum runtime document table size (for this process).
# numeric, valid range: [1, 100000000], default: 1000000
#
# search-max-doctablesize 1000000

# max idle time allowed to be set for cursor, setting it high might cause
# high memory consumption.
# numeric, valid range: [1, LLONG_MAX], default: 300000
#
# search-cursor-max-idle 300000

# Maximum number of results from ft.search command.
# numeric, valid range: [0, 1ULL << 31], default: 1000000
#
# search-max-search-results 1000000

# Number of worker threads to use for background tasks when the server is
# in an operation event.
# numeric, valid range: [1, 16], default: 4
#
# search-min-operation-workers 4

# Minimum length of term to be considered for phonetic matching.
# numeric, valid range: [1, LLONG_MAX], default: 3
#
# search-min-phonetic-term-len 3

# the minimum prefix for expansions (`*`).
# numeric, valid range: [1, LLONG_MAX], default: 2
#
# search-min-prefix 2

# the minimum word length to stem.
# numeric, valid range: [2, UINT32_MAX], default: 4
#
# search-min-stem-len 4

# Delta used to increase positional offsets between array
# slots for multi text values.
# Can control the level of separation between phrases in different
# array slots (related to the SLOP parameter of ft.search command)"
# numeric, valid range: [1, UINT32_MAX], default: 100
#
# search-multi-text-slop 100

# Used for setting the buffer limit threshold for vector similarity tiered
# HNSW index, so that if we are using WORKERS for indexing, and the
# number of vectors waiting in the buffer to be indexed exceeds this limit,
# we insert new vectors directly into HNSW.
# numeric, valid range: [0, LLONG_MAX], default: 1024
#
# search-tiered-hnsw-buffer-limit 1024

# Query timeout.
# numeric, valid range: [1, LLONG_MAX], default: 500
#
# search-timeout 500

# minimum number of iterators in a union from which the iterator will
# will switch to heap-based implementation.
# numeric, valid range: [1, LLONG_MAX], default: 20
# switch to heap based implementation.
#
# search-union-iterator-heap 20

# The maximum memory resize for vector similarity indexes (in bytes).
# numeric, valid range: [0, UINT32_MAX], default: 0
#
# search-vss-max-resize 0

# Number of worker threads to use for query processing and background tasks.
# numeric, valid range: [0, 16], default: 0
# This configuration also affects the number of connections per shard.
#
# search-workers 0

# The number of high priority tasks to be executed at any given time by the
# worker thread pool, before executing low priority tasks. After this number
# of high priority tasks are being executed, the worker thread pool will
# execute high and low priority tasks alternately.
# numeric, valid range: [0, LLONG_MAX], default: 1
#
# search-workers-priority-bias-threshold 1

# Load extension scoring/expansion module. Immutable.
# string, default: ""
#
# search-ext-load ""

# Path to Chinese dictionary configuration file (for Chinese tokenization). Immutable.
# string, default: ""
#
# search-friso-ini ""

# Action to perform when search timeout is exceeded (choose RETURN or FAIL).
# enum, valid values: ["return", "fail"], default: "fail"
#
# search-on-timeout fail

# Determine whether some index resources are free on a second thread.
# bool, default: yes
#
# search-_free-resource-on-thread yes

# Enable legacy compression of double to float.
# bool, default: no
#
# search-_numeric-compress no

# Disable print of time for ft.profile. For testing only.
# bool, default: yes
#
# search-_print-profile-clock yes

# Intersection iterator orders the children iterators by their relative estimated
# number of results in ascending order, so that if we see first iterators with
# a lower count of results we will skip a larger number of results, which
# translates into faster iteration. If this flag is set, we use this
# optimization in a way where union iterators are being factorize by the number
# of their own children, so that we sort by the number of children times the
# overall estimated number of results instead.
# bool, default: no
#
# search-_prioritize-intersect-union-children no

# Set to run without memory pools.
# bool, default: no
#
# search-no-mem-pools no

# Disable garbage collection (for this process).
# bool, default: no
#
# search-no-gc no

# Enable commands filter which optimize indexing on partial hash updates.
# bool, default: no
#
# search-partial-indexed-docs no

# Disable compression for DocID inverted index. Boost CPU performance.
# bool, default: no
#
# search-raw-docid-encoding no

# Number of search threads in the coordinator thread pool.
# numeric, valid range: [1, LLONG_MAX], default: 20
#
# search-threads 20

# Timeout for topology validation (in milliseconds). After this timeout,
# any pending requests will be processed, even if the topology is not fully connected.
# numeric, valid range: [0, LLONG_MAX], default: 30000
#
# search-topology-validation-timeout 30000


############################## TIME SERIES CONFIG #############################

# The maximal number of per-shard threads for cross-key queries when using cluster mode
# (TS.MRANGE, TS.MREVRANGE, TS.MGET, and TS.QUERYINDEX).
# Note: increasing this value may either increase or decrease the performance.
# integer, valid range: [1..16], default: 3
# This is a load-time configuration parameter.
#
# ts-num-threads 3


# Default compaction rules for newly created key with TS.ADD, TS.INCRBY, and TS.DECRBY.
# Has no effect on keys created with TS.CREATE.
# This default value is applied to each new time series upon its creation.
# string, see documentation for rules format, default: no compaction rules
#
# ts-compaction-policy ""

# Default chunk encoding for automatically-created compacted time series.
# This default value is applied to each new compacted time series automatically
# created when ts-compaction-policy is specified.
# valid values: COMPRESSED, UNCOMPRESSED, default: COMPRESSED
#
# ts-encoding COMPRESSED


# Default retention period, in milliseconds. 0 means no expiration.
# This default value is applied to each new time series upon its creation.
# If ts-compaction-policy is specified - it is overridden for created
# compactions as specified in ts-compaction-policy.
# integer, valid range: [0 .. LLONG_MAX], default: 0
#
# ts-retention-policy 0

# Default policy for handling insertion (TS.ADD and TS.MADD) of multiple
# samples with identical timestamps.
# This default value is applied to each new time series upon its creation.
# string, valid values: BLOCK, FIRST, LAST, MIN, MAX, SUM, default: BLOCK
#
# ts-duplicate-policy BLOCK

# Default initial allocation size, in bytes, for the data part of each new chunk
# This default value is applied to each new time series upon its creation.
# integer, valid range: [48 .. 1048576]; must be a multiple of 8, default: 4096
#
# ts-chunk-size-bytes 4096

# Default values for newly created time series.
# Many sensors report data periodically. Often, the difference between the measured
# value and the previous measured value is negligible and related to random noise
# or to measurement accuracy limitations. In such situations it may be preferable
# not to add the new measurement to the time series.
# A new sample is considered a duplicate and is ignored if the following conditions are met:
# - The time series is not a compaction;
# - The time series' DUPLICATE_POLICY IS LAST;
# - The sample is added in-order (timestamp >= max_timestamp);
# - The difference of the current timestamp from the previous timestamp
#   (timestamp - max_timestamp) is less than or equal to ts-ignore-max-time-diff
# - The absolute value difference of the current value from the value at the previous maximum timestamp
#   (abs(value - value_at_max_timestamp) is less than or equal to ts-ignore-max-val-diff.
# where max_timestamp is the timestamp of the sample with the largest timestamp in the time series,
# and value_at_max_timestamp is the value at max_timestamp.
# ts-ignore-max-time-diff: integer, valid range: [0 .. LLONG_MAX], default: 0
# ts-ignore-max-val-diff: double, Valid range: [0 .. DBL_MAX], default: 0
#
# ts-ignore-max-time-diff 0
# ts-ignore-max-val-diff 0


########################### BLOOM FILTERS CONFIG ##############################

# Defaults values for new Bloom filters created with BF.ADD, BF.MADD, BF.INSERT, and BF.RESERVE
# These defaults are applied to each new Bloom filter upon its creation.

# Error ratio
# The desired probability for false positives.
# For a false positive rate of 0.1% (1 in 1000) - the value should be 0.001.
# double, Valid range: (0 .. 1), value greater than 0.25 is treated as 0.25, default: 0.01
#
# bf-error-rate 0.01

# Initial capacity
# The number of entries intended to be added to the filter.
# integer, valid range: [1 .. 1GB], default: 100
#
# bf-initial-size 100

# Expansion factor
# When capacity is reached, an additional sub-filter is created.
# The size of the new sub-filter is the size of the last sub-filter multiplied
# by expansion.
# integer, [0 .. 32768]. 0 is equivalent to NONSCALING. default: 2
#
# bf-expansion-factor 2


########################### CUCKOO FILTERS CONFIG #############################

# Defaults values for new Cuckoo filters created with
# CF.ADD, CF.ADDNX, CF.INSERT, CF.INSERTNX, and CF.RESERVE
# These defaults are applied to each new Cuckoo filter upon its creation.

# Initial capacity
# A filter will likely not fill up to 100% of its capacity.
# Make sure to reserve extra capacity if you want to avoid expansions.
# value is rounded to the next 2^n integer.
# integer, valid range: [2*cf-bucket-size .. 1GB], default: 1024
#
# cf-initial-size 1024

# Number of items in each bucket
# The minimal false positive rate is 2/255 ~ 0.78% when bucket size of 1 is used.
# Larger buckets increase the error rate linearly, but improve the fill rate.
# integer, valid range: [1 .. 255], default: 2
#
# cf-bucket-size 2

# Maximum iterations
# Number of attempts to swap items between buckets before declaring filter
# as full and creating an additional filter.
# A lower value improves performance. A higher value improves fill rate.
# integer, Valid range: [1 .. 65535], default: 20
#
# cf-max-iterations 20

# Expansion factor
# When a new filter is created, its size is the size of the current filter
# multiplied by this factor.
# integer, Valid range: [0 .. 32768], 0 is equivalent to NONSCALING, default: 1
#
# cf-expansion-factor 1

# Maximum expansions
# integer, Valid range: [1 .. 65536], default: 32
#
# cf-max-expansions 32


################################## SECURITY ###################################
#
# The following is a list of command categories and their meanings:
#
# * search - Query engine related.
# * json - Data type: JSON related.
# * timeseries -  Data type: time series related.
# * bloom - Data type:  Bloom filter related.
# * cuckoo - Data type: cuckoo filter related.
# * topk -  Data type: top-k related.
# * cms - Data type: count-min sketch related.
# * tdigest -  Data type: t-digest related.