lightweight-charts-python
MIT License
lightweight-charts-python 致力于提供简单、Pythonic 的方式接入 TradingView 的 Lightweight Charts。
English Version ReadMe: <README_EN.md>
尝试继续维护
本人对 TypeScript 了解比较少,主要依赖 DeepSeek AI 辅助维护
比对了大量的K线绘制库,发现 lightweight-charts-python 唯一功能足够全,性能足够强,易于嵌入QtUI的库,并且存在刚需的功能,遂尝试继续维护
当前已基本排除完bug,examples 全部例子已在windows测试通过
lightweight-chart 主库已更新到 v5.2.0,并添加了一部分v5的新功能
我的主要使用环境为 windows + python 3.13 + PySide6 + WebView,其他环境上面可能有问题。
其他活跃的同类储存库,各有特别的新功能,值得尝试,我也参考了它们的代码
https://github.com/gopalparashar421/lightweight-charts-python
https://github.com/smalinin/bn_lightweight-charts-python
https://github.com/EsIstJosh/lightweight-charts-python
🤣如果要说我的项目有啥明显的优势,可能是为了长时间运行,而增加的精细资源回收,几乎不存在内存泄露。
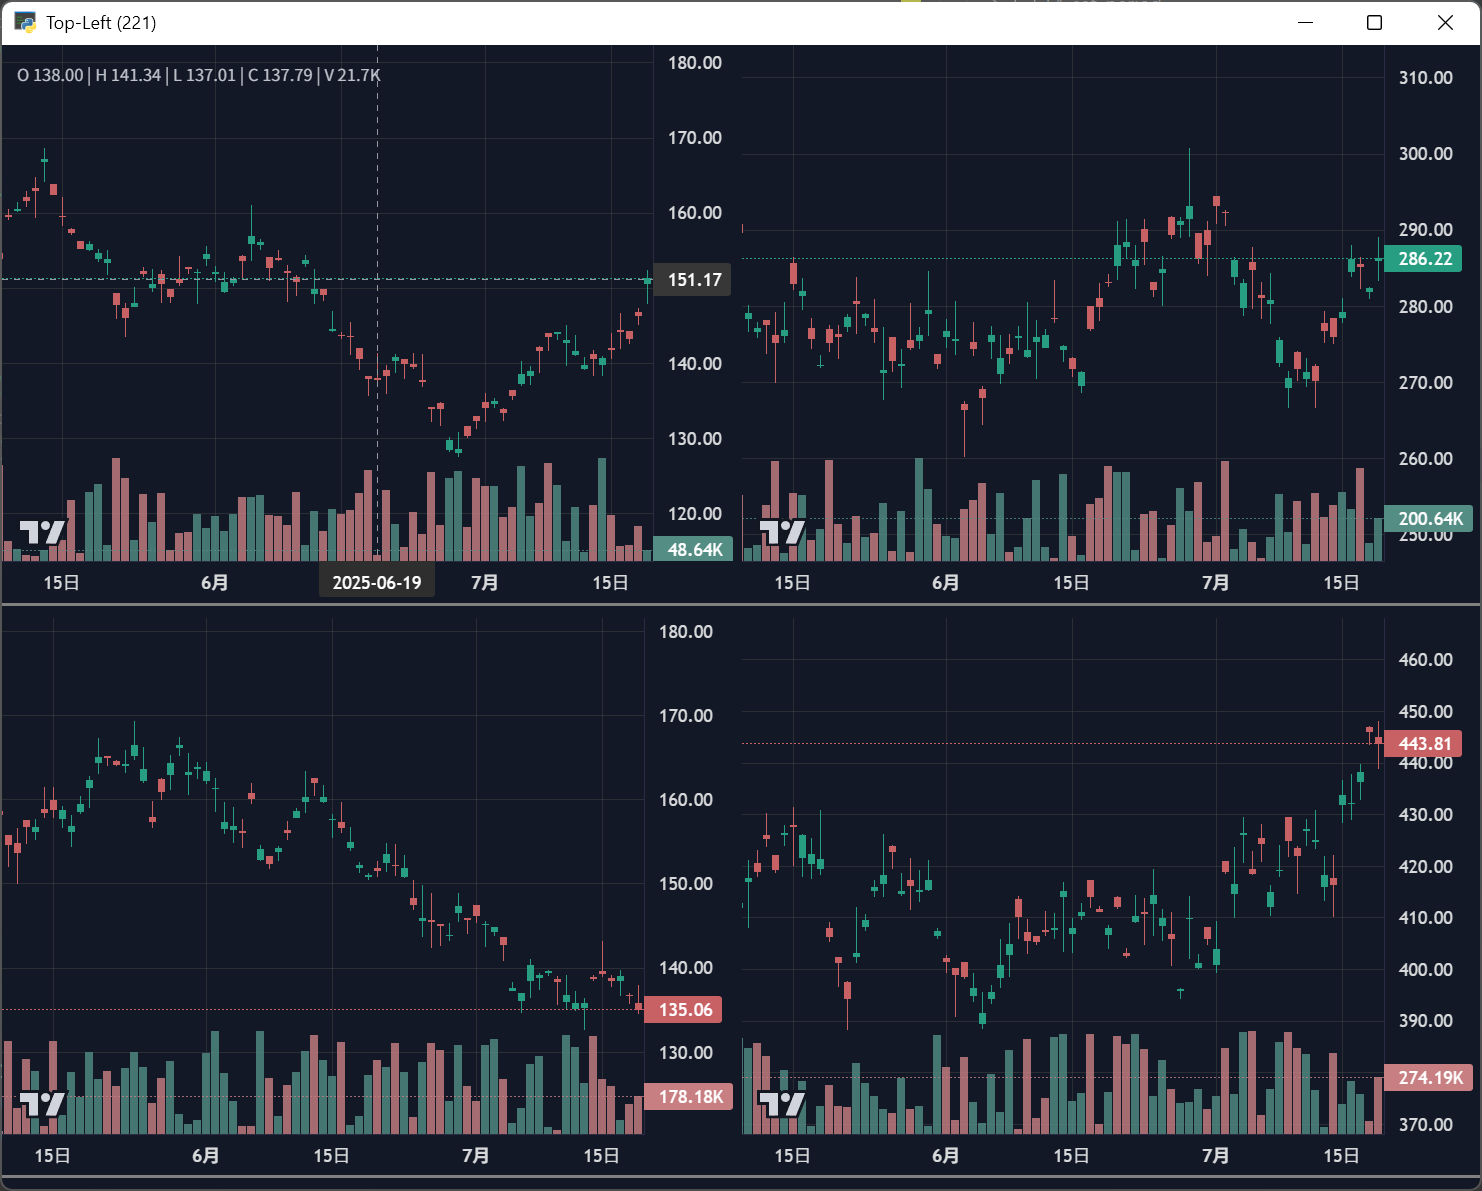
对了,还有支持类似figure的 Grid布局,调整布局更加轻松精确。
还有批量更新API,支持一次性多个数据点,批量更新性能大幅提升。
同时也欢迎其他仓库按需取用代码。
⬇️下方有更多示例画廊
🤖 更新与增强
以下是合并优化后的 Markdown 版本,保留了所有信息,并采用有序列表 + 表情符号,结构清晰易读:
-
✅ 序列批量更新 API ---
Line.update_batch()/Histogram.update_batch()一次性更新多个数据点,性能大幅提升 -
🚀 K线批量更新 ---
chart.update_bars()/chart.update_from_ticks()批量数据处理加速 10x -
📊 持仓量可视化 --- Open Interest 独立 Y 轴缩放,与成交量叠加显示
-
🔄 Reflex 集成 ---
ReflexChart(StaticLWC)在 Reflex 应用中嵌入 K线图;通过 postMessage 桥接实现增量实时更新;JS→Python 回调桥接将 crosshair_move 等事件自动转发到 State -
🧩 初始化幂等性 --- 解决 Reflex 编译/运行时模块双重导入导致的图表重复创建问题
-
📚 示例 26 --- Line 和 Histogram 的 batch update 性能对比演示
-
📚 示例 27 --- 完整 Reflex 示例(SMA 指标 + bar 推送 + crosshair 回调),附带
clean.ps1/run.ps1脚本 -
🖥️ 跨进程嵌入 Qt ---
CrossProcessChart将 pywebview 图表窗口通过原生句柄嵌入 PySide6/PyQt6 QWidget,支持无边框、窗口大小同步,类似 Chrome 多进程架构(Windows + Linux/X11) -
📚 示例 28 --- CrossProcessChart 跨进程嵌入 PySide6 QWidget 完整演示
-
🎛️ 网格布局系统 ---
position参数支持三种格式:整数(如111)、元组(如(2,2,1))、字符串(已弃用),类似 matplotlib 的 subplot -
🔧 运行时位置控制 --- 新增
get_position()和set_position()方法,支持动态调整图表位置 -
📏 相对大小控制 ---
width/height参数相对于网格单元,支持内缩(<1.0)和侵占(>1.0) -
📚 示例 29 --- 网格布局完整演示
-
🔗 图表同步功能 ---
create_subchart()支持多图表同步时间轴和十字光标 -
📚 示例 31 --- 图表同步功能完整演示
-
⚠️ 网格冲突检测 --- 自动检测同一窗口中图表网格规格冲突,防止布局混乱
-
🧹 代码优化 --- 重构
parse_position()和_convert_string_to_grid()函数,提高代码可维护性 -
🌊 实时数据流式更新 --- 支持直接从 tick 数据更新 K线
-
📈 多面板图表 --- 使用
create_subchart()创建子图(与图表同步功能协同) -
✏️ 工具箱 --- 在图表上直接绘制趋势线、矩形、射线、水平线
-
🎯 事件系统 --- 时间周期选择器、搜索、快捷键等
-
📋 表格组件 --- 用于自选股、下单、持仓管理
-
🔌 Polygon.io 集成 --- 直接获取市场数据
-
🏷️ 常驻图例 --- 鼠标移出图表时 OHLC 仍可见
-
🎨 垂直区间高亮 --- 半透明填充标记日期范围
-
🧹 资源清理 API ---
reset()、clear_handlers()、audit()、delete() -
📐 PriceLine 对象 ---
create_price_line().delete() -
🗑️ Table.delete() --- 销毁表格并清理 JS 状态
-
🔤 人类可读的 ID ---
window.Chart_1、window.Line_3等 -
📊 资源审计 ---
chart.audit(use_js=True)返回完整 TOML 格式的 JS 变量状态 -
✅ 全面的清理测试 ---
test_cleanup.py验证所有资源类型的 Python + JS 无泄漏 -
🗂️ 多 Chart 实例 --- 完全独立的图表对象
🧰 主要支持环境 --- PySide6、PyQt6、wxPython
建议让 AI编程助手 先阅读 QUICK_REFERENCE.md 文件,快速了解全项目
使用PYPI安装
bash
pip install lightweight-charts-onesixth使用源码安装
bash
pip install https://github.com/One-sixth/lightweight-charts-python构建
构建本包,需要安装有 node.js 环境,需要调用 npm 命令
先构建 JS bundle 库。
下载node包的依赖
npm install @rollup/plugin-typescript --save-dev
npm audit fix --force
构建和复制成品到python源码目录
npx rollup -c rollup.config.js
cp dist/bundle.js lightweight_charts/js/bundle.js
构建 whl 包
python -m build构建完成的whl包在dist目录中
核心 API 速查
| 方法 | 说明 |
|---|---|
chart.set(df) |
设置 K线数据 |
chart.update(series) |
更新最后一根 K线 |
chart.update_from_tick(tick) |
从逐笔成交更新 K线 |
chart.marker(text, ...) |
添加价格标记 |
chart.marker_auto_scale(enable) |
控制标记是否参与价格轴缩放 |
chart.pop(count) |
从末尾移除 N 个数据点 |
chart.create_line(name, ...) |
创建折线指标 |
chart.create_histogram(name, ...) |
创建柱状图指标 |
chart.create_subchart(...) |
创建子面板 |
chart.create_price_line(price, ...) |
创建价格线 |
chart.horizontal_line(price, ...) |
创建水平线 |
chart.vertical_span(start, end, ...) |
创建垂直高亮区间 |
chart.get_position() |
获取图表渲染位置 (x, y, width, height) 百分比(show 前后均可) |
chart.set_position(x, y, width, height) |
动态设置图表渲染位置(show 前后均可,传入 None 恢复默认) |
chart.audit(use_js=False) |
资源审计(Python 侧) |
chart.audit(use_js=True) |
资源审计(JS 侧,TOML 格式) |
chart.reset() |
重置图表到初始状态 |
chart.screenshot(...) |
截图(v5.2.0+ 增强:支持 add_top_layer 和 include_crosshair) |
chart.clear_handlers() |
清空所有事件处理器 |
chart.set_price_format(type, base, precision) |
设置价格轴格式,避免浮点精度问题(v5.2.0+) |
文档与支持
建议通过 examples 例子来学习,ReadMe 下方有大量参考代码和画廊
若要了解全部功能,可以阅读 QUICK_REFERENCE.md 文件,我尽量让它包含了所有功能的详细说明和示例代码
免责声明: 本包为独立开发,未经 TradingView 背书、赞助或批准。作者与 TradingView 无任何官方关系,本包不代表 TradingView 的观点或立场。
完整示例目录
| 序号 | 示例名称 | 功能说明 |
|---|---|---|
| 1 | 1_setting_data |
基础数据设置 |
| 2 | 2_live_data |
实时 K线更新 |
| 3 | 3_tick_data |
Tick 数据更新 |
| 4 | 4_line_indicators |
折线指标 SMA |
| 5 | 5_styling |
样式定制 |
| 6 | 6_callbacks |
回调事件 |
| 7 | 7_multi_pane |
多面板图表 |
| 8 | 8_volume_open_interest |
成交量+持仓量 |
| 9 | 9_multi_chart |
多 Chart 实例 |
| 10 | 10_persistent_legend |
常驻图例 |
| 11 | 11_vertical_span |
垂直区间高亮 |
| 12 | 12_audit |
资源审计 |
| 13 | 13_batch_update |
批量更新 API |
| 14 | 14_set_period |
时间周期锁定 |
| 15 | 15_pyside6_simple |
PySide6 集成 |
| 16 | 16_pyside6_race |
PySide6 性能测试 |
| 18 | 18_hovered_series_on_top |
悬停系列置顶 |
| 19 | 19_timescale_options |
时间轴选项 |
| 20 | 20_tick_mark_density |
刻度密度控制 |
| 21 | 21_marker_auto_scale |
标记自动缩放 |
| 22 | 22_pop |
移除数据点 |
| 23 | 23_crosshair_move |
十字光标事件 |
| 24 | 24_price_format |
价格格式设置 |
| 25 | 25_screenshot_enhanced |
增强截图 |
| 26 | 26_series_batch_update |
序列批量更新 |
| 27 | 27_reflex_chart |
Reflex 集成 |
| 28 | 28_cross_process_chart |
跨进程嵌入 Qt |
| 29 | 29_grid_layout |
网格布局系统 |
| 30 | 30_table_component |
表格组件(自选股/持仓管理) |
| 31 | 31_chart_sync |
图表同步功能(时间轴+十字光标) |
示例展示
python
### 示例 1:显示 CSV 数据

import pandas as pd
from lightweight_charts import Chart

if __name__ == '__main__':
    chart = Chart()
    df = pd.read_csv('ohlcv.csv')
    chart.set(df)
 _id=img-ROPPelbz-1779980347202)

---

### 示例 2:实时更新 K线

```python
import pandas as pd
from time import sleep
from lightweight_charts import Chart

if __name__ == '__main__':
    chart = Chart()
    df1 = pd.read_csv('ohlcv.csv')
    df2 = pd.read_csv('next_ohlcv.csv')
    chart.set(df1)
    chart.show()
    for _, bar in df2.iterrows():
        chart.updat_id=img-P9E8ZQ55-1779980347202)

---

### 示例 3:从 Tick 数据更新

```python
import pandas as pd
from time import sleep
from lightweight_charts import Chart

if __name__ == '__main__':
    chart = Chart()
    chart.set(pd.read_csv('ohlc.csv'))
    chart.show()
    for _, tick in pd.read_csv('ticks.csv').iterrows():
        chart.update_from_tick(_id=img-WMBass0U-1779980347202)
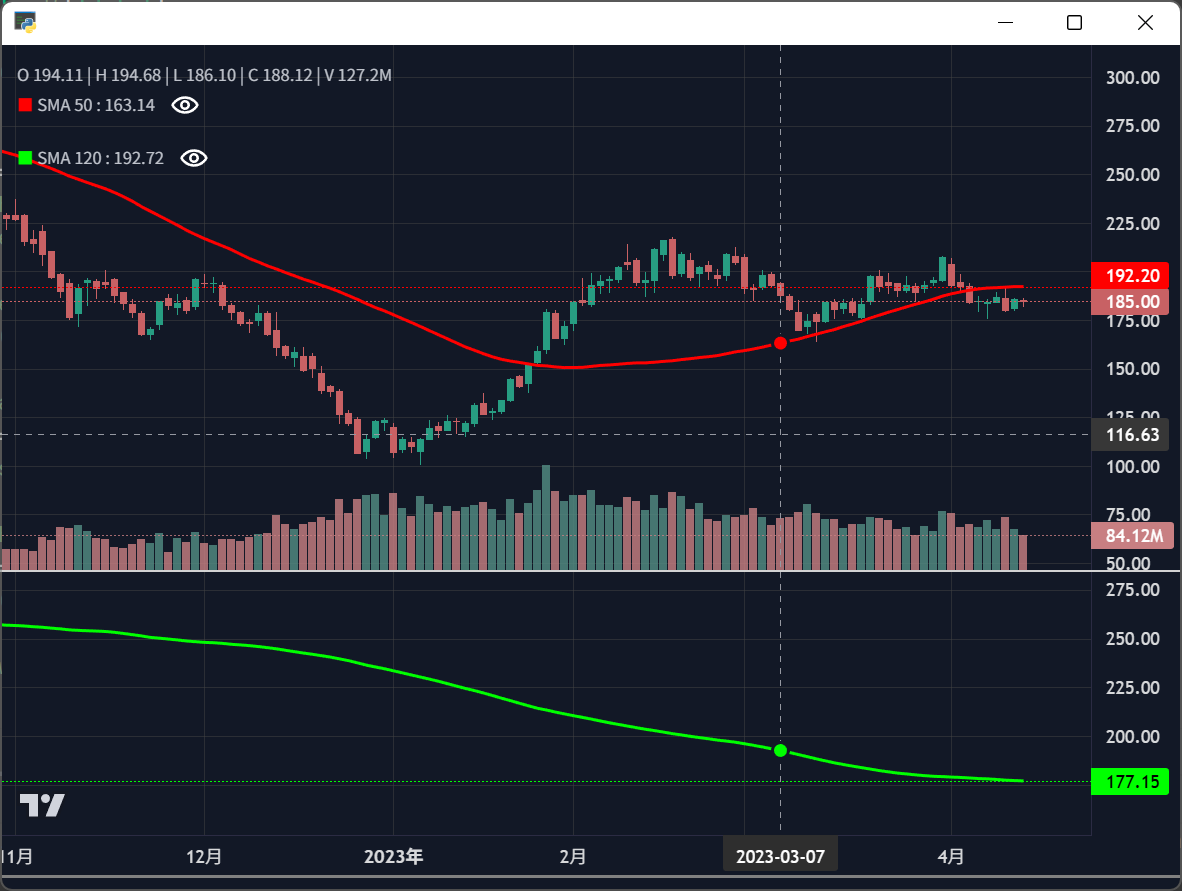
示例 4:折线指标(SMA)
python
import pandas as pd
from lightweight_charts import Chart

def calculate_sma(df, period=50):
    return pd.DataFrame({
        'time': df['date'],
        f'SMA {period}': df['close'].rolling(period).mean()
    }).dropna()

if __name__ == '__main__':
    chart = Chart()
    df = pd.read_csv('ohlcv.csv')
    chart.set(df)
    line = chart.create_line('SMA 50')
    line.set(calculate_sma(df, 50))
 _id=img-MzGI5BU7-1779980347203)

---

### 示例 5:样式定制

```python
import pandas as pd
from lightweight_charts import Chart

if __name__ == '__main__':
    chart = Chart()
    df = pd.read_csv('ohlcv.csv')
    chart.layout(background_color='#090008', text_color='#FFFFFF')
    chart.candle_style(up_color='#00ff55', down_color='#ed4807')
    chart.watermark('1D', color='rgba(180,180,240,0.7)')
    chart.set(df)
 _id=img-nI4SiE24-1779980347203)

---

### 示例 6:回调事件

```python
import pandas as pd
from lightweight_charts import Chart

def on_search(chart, searched_string):
    new_data = get_bar_data(searched_string, chart.topbar['timeframe'].value)
    if not new_data.empty:
        chart.topbar['symbol'].set(searched_string)
        chart.set(new_data)

if __name__ == '__main__':
    chart = Chart(toolbox=True)
    chart.events.search += on_search
    chart.topbar.textbox('symbol', 'TSLA')
    chart.topbar.switcher('timeframe', ('1min', '5min', '30min'))
    chart.set(get_bar_data('TSLA', '5min'))
 _id=img-e4BJQLyf-1779980347203)

---

### 示例 7:多面板图表

```python
import pandas as pd
from lightweight_charts import HTMLChart

def demo():
    chart = HTMLChart(width=1200, height=800)
    df = pd.read_csv('ohlcv.csv')
    chart.set(df)
    line7 = chart.create_line('SMA 7', color='red')
    line7.set(df[['date', 'close']].rename(columns={'close': 'SMA 7'}))
    chart.show()

if __name__ _id=img-LoShhFha-1779980347203)

---

### 示例 8:成交量 + 持仓量

```python
import pandas as pd
from lightweight_charts import Chart

if __name__ == '__main__':
    chart = Chart(toolbox=True)
    df = generate_data()  # 包含 open_interest 列
    chart.set(df)
 _id=img-390gEgVS-1779980347203)

---

### 示例 9:多 Chart 实例

```python
import asyncio
from threading import Thread
from lightweight_charts import Chart

def run_chart(chart):
    asyncio.run(chart.show_async())

if __name__ == '__main__':
    chart1 = Chart(title='AAPL')
    chart2 = Chart(title='TSLA')
    chart1.set(df1)
    chart2.set(df2)
    t1 = Thread(target=run_chart, args=(chart1,), daemon=True)
    t2 = Thread(target=run_chart, args=(chart2,), daemon=True)
    _id=img-i2qFeY8L-1779980347203)

---

### 示例 10:常驻图例

```python
import pandas as pd
from lightweight_charts import Chart

if __name__ == '__main__':
    chart = Chart()
    df = generate_data()
    chart.legend(visible=True, ohlc=True, persistent=True)
    chart.set(df)
 _id=img-g1vDKEJj-1779980347203)

---

### 示例 11:垂直区间高亮

```python
import pandas as pd
from lightweight_charts import Chart

if __name__ == '__main__':
    chart = Chart()
    df = pd.read_csv('ohlcv.csv')
    chart.set(df)
    chart.vertical_span(start_time='2024-01-05', end_time='2024-06-10', color='rgba(252,219,3,0.15)')
 _id=img-5fA84cXP-1779980347203)

---

### 示例 12:资源审计

```python
from lightweight_charts import Chart

if __name__ == '__main__':
    chart = Chart(toolbox=True)
    chart.set(df)
    # 创建各种资源...
    result = chart.audit(use_js=True)  # JS侧状态检查
    print(result)
 _id=img-0gMhRheq-1779980347203)

---

### 示例 13:批量更新

```python
import pandas as pd
from lightweight_charts import Chart

if __name__ == '__main__':
    chart = Chart()
    chart.set(initial_df)
    chart.show()
    # 批量更新
    chart.update_bars(new_bars_df)
    chart.up_id=img-T7CUaESm-1779980347203)

---

### 示例 14:时间周期锁定

```python
import pandas as pd
from lightweight_charts import Chart

if __name__ == '__main__':
    chart = Chart()
    chart.set(df_5min)
    chart.set_period(3600)  # 锁定为1小时
    chart.set(df_30min)  # 重要:set_period 后需重新 set() 使其生效,仍按1小时显示
 _id=img-fSHhLRbM-1779980347204)

---

### 示例 15:PySide6 集成

```python
import sys
from PySide6.QtWidgets import QMainWindow, QVBoxLayout, QWidget
from lightweight_charts.widgets import QtChart

class MainWindow(QMainWindow):
    def __init__(self):
        super().__init__()
        self.chart = QtChart()
        layout = QVBoxLayout()
        layout.addWidget(self.chart.get_webview())
        self.chart.set(df)

if __name__ == '__main__':
    app = QApplication(sys.argv)
    window = MainWindow()
    window.show()_id=img-WtoIJhyN-1779980347204)

---

### 示例 16:PySide6 性能测试

```python
import sys
from PySide6.QtWidgets import QMainWindow
from lightweight_charts.widgets import QtChart

class SpeedRaceWindow(QMainWindow):
    def run_batch_race(self):
        start = time.perf_counter()
        self.chart.update_bars(new_bars)
        elapsed = time.perf_counter() - start
        print(f'upda_id=img-BeeCnmnK-1779980347204)

---

### 示例 18:悬停系列置顶

```python
from lightweight_charts import Chart

if __name__ == '__main__':
    chart = Chart()
    chart.chart_options(hovered_series_on_top=True)  # v5.2.0+
    chart.set(df)
 _id=img-BfluTqaT-1779980347204)

---

### 示例 19:时间轴选项

```python
from lightweight_charts import Chart

if __name__ == '__main__':
    chart = Chart()
    chart.time_scale(
        right_offset_pixels=50,
        enable_conflation=True,
        precompute_conflation_on_init=True
    )
    chart.set(large_df)
 _id=img-RHiBTLCA-1779980347204)

---

### 示例 20:刻度密度控制

```python
from lightweight_charts import Chart

if __name__ == '__main__':
    chart = Chart()
    chart.price_scale(tick_mark_density=2.5)  # v5.2.0+
    chart.set(df)
 _id=img-1aVF2XmY-1779980347204)

---

### 示例 21:标记自动缩放

```python
from lightweight_charts import Chart

if __name__ == '__main__':
    chart = Chart(marker_auto_scale=False)
    chart.set(df)
    chart.marker(time='2024-01-15', position='above', text='Event')
 _id=img-oLA0VJ7x-1779980347204)

---

### 示例 22:移除数据点

```python
from lightweight_charts import Chart

if __name__ == '__main__':
    chart = Chart()
    chart.set(df)
    chart.pop(50)  # 移除最后50个数据点
 _id=img-uKrBxUDX-1779980347204)

---

### 示例 23:十字光标事件

```python
def on_crosshair_move(chart, payload):
    dt = pd.to_datetime(payload['time'], unit='s')
    print(f'{dt} | price = {payload.get("price")}')

if __name__ == '__main__':
    chart = Chart()
    chart.events.crosshair_move += on_crosshair_move
    chart.set(df)
 _id=img-Hs8DOtCu-1779980347204)

---

### 示例 24:价格格式设置

```python
from lightweight_charts import Chart

if __name__ == '__main__':
    chart = Chart()
    chart.set(df)
    chart.set_price_format(type='base', base=100, precision=2)  # v5.2.0+
 _id=img-ftfnBx9s-1779980347204)

---

### 示例 25:增强截图

```python
from lightweight_charts import Chart
import time

if __name__ == '__main__':
    chart = Chart()
    chart.set(df)
    chart.watermark('截图演示')
    chart.show(block=False)
    time.sleep(2)
    img = chart.screenshot(add_top_layer=True, include_crosshair=True)
    with open('screenshot.png', 'wb') a_id=img-v9ekXqUY-1779980347204)

---

### 示例 26:序列批量更新

```python
from lightweight_charts import Chart

if __name__ == '__main__':
    chart = Chart()
    chart.set(df)
    line = chart.create_line('SMA 20')
    line.update_batch(sma_data)  # 批量更新序列
 _id=img-DlyNLZ7Y-1779980347204)

---

### 示例 27:Reflex 集成

```python
import reflex as rx
from lightweight_charts import ReflexChart

chart = ReflexChart(width=1000, height=600, auto_flush=True)
chart.set(pd.read_csv('ohlcv.csv'))

class ChartState(rx.State):
    def tick(self):
        chart.update(_next_bar())
   _id=img-NuJ01tOS-1779980347204)

---

### 示例 28:跨进程嵌入 Qt

```python
from PySide6.QtWidgets import QMainWindow
from lightweight_charts import CrossProcessChart

class MainWindow(QMainWindow):
    def __init__(self):
        self.chart = CrossProcessChart(parent=self, width=800, height=500)
 _id=img-0NcOulfK-1779980347204)

---

### 示例 29:网格布局

```python
from lightweight_charts import Chart

if __name__ == '__main__':
    chart1 = Chart(position=221)  # 2行2列第1个
    chart2 = chart1.create_subchart(position=222)
    chart3 = chart1.create_subchart(position=223)
    chart4 = chart1.create_subchart(position=224)
    chart1.set(df)
  _id=img-zFFNa5gs-1779980347204)

---

### 示例 30:表格组件

```python
from lightweight_charts import Chart

if __name__ == '__main__':
    chart = Chart(width=1000, height=600)
    chart.set(df)

    # 创建自选股表格
    watchlist = chart.create_table(
        width=0.22,
        height=0.4,
        headings=('Symbol', 'Price', 'Chg%', 'Volume'),
        widths=(0.35, 0.25, 0.2, 0.2),
        alignments=('left', 'right', 'right', 'right'),
        position=(0.02, 0.1),  # 使用相对坐标 (x, y),范围 0-1
        draggable=True,
        func=on_watchlist_click
    )

    # 添加数据
    watchlist.new_row('AAPL', '198.50', '+1.2%', '12.5M')
    watchlist.new_row('GOOGL', '141.80', '-0.8%', '8.2M')
    watchlist.new_row('MSFT', '420.30', '+2.1%', '15.8M')

    # 设置样式
    watchlist.header(color='rgba(70, 130, 180, 0.8)', text_color='#FFFFFF')
    watchlist.rows[0].background_color('rgba(0, 255, 0, 0.1)')

    chart.show(block=True)


**position 参数说明:**

| 格式 | 示例 | 说明 |
|------|------|------|
| 元组 (x, y) | `(0.02, 0.1)` | 推荐:相对坐标,范围 0-1 |
| 元组 (x, y) | `(100, 50)` | 像素坐标,值 >= 1 时视为像素 |
| 字符串(已废弃) | `'left'`, `'right'` | 不推荐,会触发 Depr_id=img-OcqcvxAL-1779980347204)

---

### 示例 31:图表同步

```python
from lightweight_charts import Chart

if __name__ == '__main__':
    # 创建主图表 - 使用 2x2 网格布局
    chart = Chart(width=1200, height=800, title='Chart Sync Demo', position=(2, 2, 1))

    # 创建右侧子图表(完全同步时间轴和十字光标)
    subchart_right = chart.create_subchart(
        position=(2, 2, 2),
        sync_id=chart.id,           # 同步到主图表
        sync_crosshairs_only=False  # 完全同步
    )

    # 创建底部子图表(仅同步十字光标)
    subchart_bottom = chart.create_subchart(
        position=223,            # 等同于 (2, 2, 3)
        width=2.0,               # 横跨两列
        sync_id=chart.id,
        sync_crosshairs_only=True  # 仅同步十字光标
    )

    chart.set(df)
    subchart_right.set(df2)
    subchart_bottom.set(df3)
    chart.show(block=True)
sync_id 参数说明:
| 参数 | 类型 | 说明 |
|---|---|---|
sync_id |
bool 或 str |
True 同步到父图表;字符串为目标图表的 id |
sync_crosshairs_only |
`b_id=img-tvHegkjK-1779980347204) |