📌 学习目标
- 掌握显示带地形高程(三维地形)的卫星影像的实现方法
- 理解相关API的使用
- 能够独立完成类似功能开发
🎯 核心概念
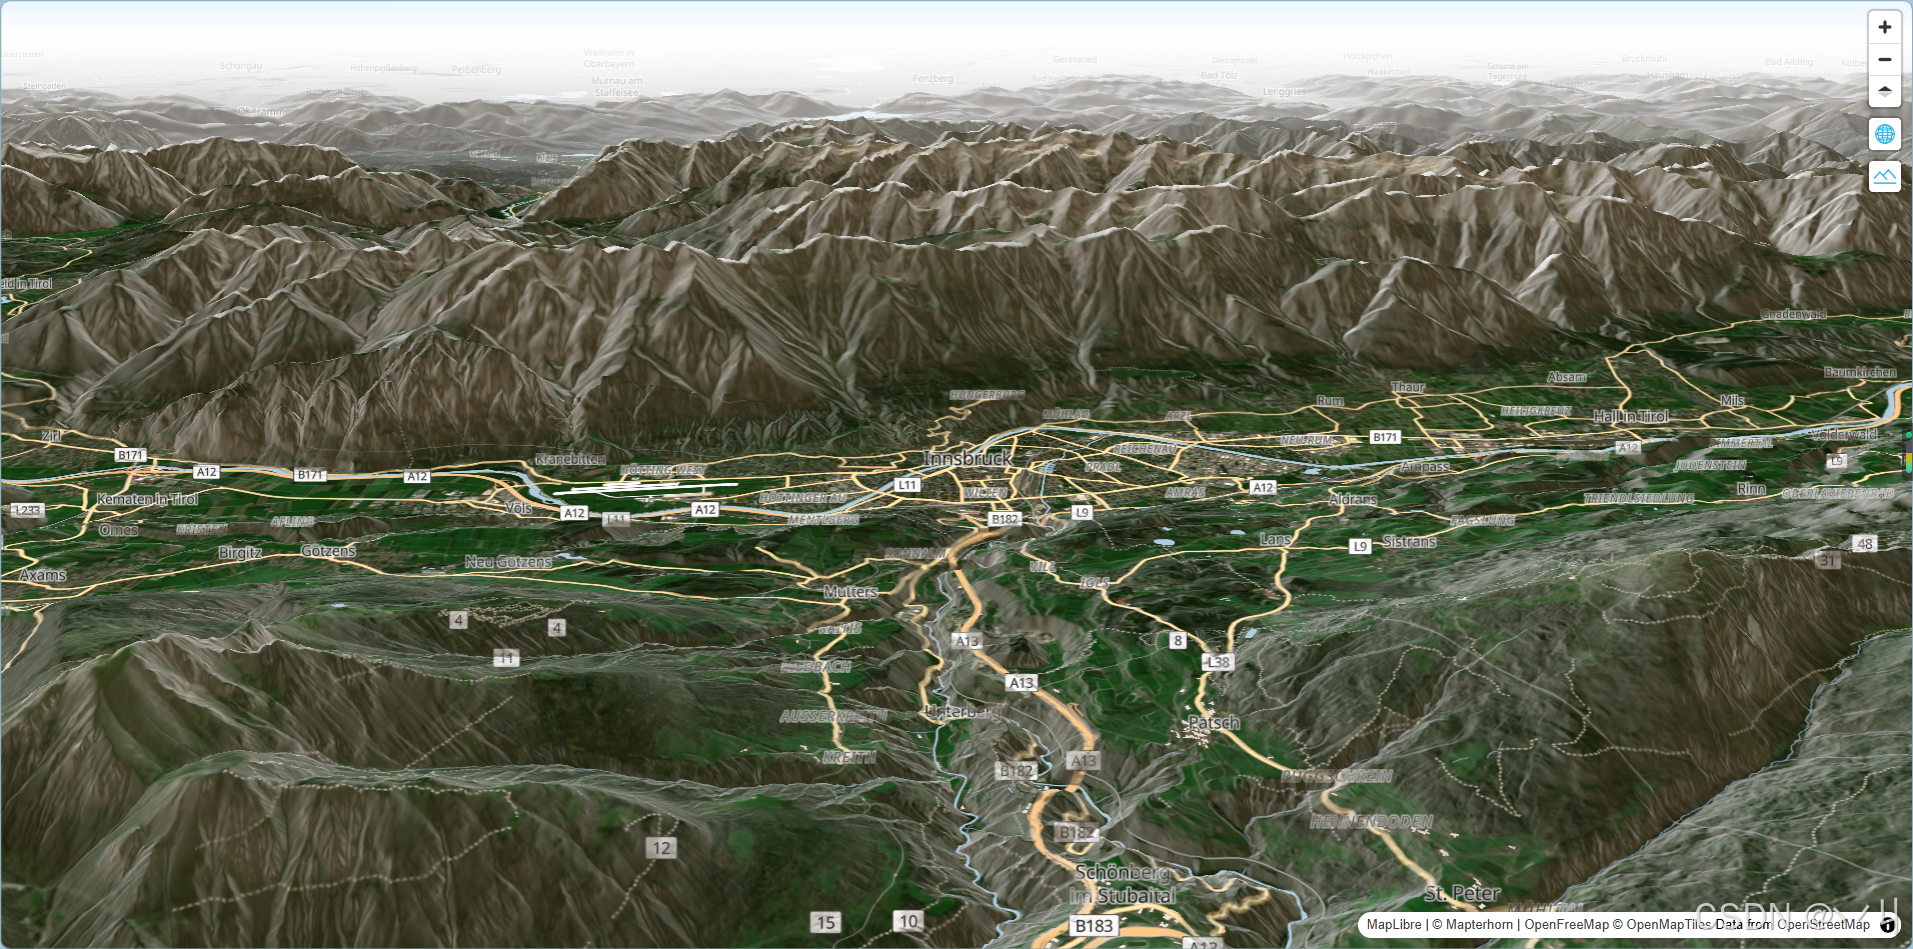
显示带有地形高程的混合卫星地图。
💻 完 整 代 码
代码示例
js
const map = new maplibregl.Map({
    container: 'map',
    zoom: 12,
    center: [11.39085, 47.27574],
    pitch: 70,
    maxPitch: 95
});

map.setStyle('https://tiles.openfreemap.org/styles/bright', {
        transformStyle: (previousStyle, nextStyle) => {
            nextStyle.projection = {type: 'globe'};
            nextStyle.sources = {
                ...nextStyle.sources,
                satelliteSource: {
                    type: 'raster',
                    tiles: [
                        'https://tiles.maps.eox.at/wmts/1.0.0/s2cloudless-2020_3857/default/g/{z}/{y}/{x}.jpg'
                    ],
                    tileSize: 256
                },
                terrainSource: {
                    type: 'raster-dem',
                    url: 'https://tiles.mapterhorn.com/tilejson.json'
                },
                hillshadeSource: {
                    type: 'raster-dem',
                    url: 'https://tiles.mapterhorn.com/tilejson.json'
                }
            }
            nextStyle.terrain = {
                source: 'terrainSource',
                exaggeration: 1
            }

            nextStyle.sky = {
                'atmosphere-blend': [
                    'interpolate',
                    ['linear'],
                    ['zoom'],
                    0, 1,
                    2, 0
                ],
            }

            nextStyle.layers.push({
                id: 'hills',
                type: 'hillshade',
                source: 'hillshadeSource',
                layout: { visibility: 'visible' },
                paint: { 'hillshade-shadow-color': '#473B24' }
            })

            const firstNonFillLayer = nextStyle.layers.find(layer => layer.type !== 'fill' && layer.type !== 'background');
            nextStyle.layers.splice(nextStyle.layers.indexOf(firstNonFillLayer), 0, {
                id: 'satellite',
                type: 'raster',
                source: 'satelliteSource',
                layout: { visibility: 'visible' },
                paint: { 'raster-opacity': 1 }
            });

            return nextStyle;
        }
    })

map.addControl(
    new maplibregl.NavigationControl({
        visualizePitch: true,
        showZoom: true,
        showCompass: true
    })
);


map.addControl(
    new maplibregl.GlobeControl()
);

map.addControl(
    new maplibregl.TerrainControl({
        source: 'terrainSource',
        exaggeration: 1
    })
);
代码示例
html
<!DOCTYPE html>
<html lang="en">
<head>
    <title>Display a hybrid satellite map with terrain elevation</title>
    <meta property="og:description" content="显示带地形高程的混合卫星地图。" />
    <meta property="og:created" content="2025-06-25" />
    <meta charset='utf-8'>
    <meta name="viewport" content="width=device-width, initial-scale=1">
    <link rel='stylesheet' href='https://unpkg.com/maplibre-gl@5.24.0/dist/maplibre-gl.css' />
    <script src='https://unpkg.com/maplibre-gl@5.24.0/dist/maplibre-gl.js'></script>
    <style>
        body { margin: 0; padding: 0; }
        html, body, #map { height: 100%; }
    </style>
</head>
<body>
<div id="map"></div>
<script>
    const map = new maplibregl.Map({
        container: 'map',
        zoom: 12,
        center: [11.39085, 47.27574],
        pitch: 70,
        maxPitch: 95
    });

    map.setStyle('https://tiles.openfreemap.org/styles/bright', {
            transformStyle: (previousStyle, nextStyle) => {
                nextStyle.projection = {type: 'globe'};
                nextStyle.sources = {
                    ...nextStyle.sources,
                    satelliteSource: {
                        type: 'raster',
                        tiles: [
                            'https://tiles.maps.eox.at/wmts/1.0.0/s2cloudless-2020_3857/default/g/{z}/{y}/{x}.jpg'
                        ],
                        tileSize: 256
                    },
                    terrainSource: {
                        type: 'raster-dem',
                        url: 'https://tiles.mapterhorn.com/tilejson.json'
                    },
                    hillshadeSource: {
                        type: 'raster-dem',
                        url: 'https://tiles.mapterhorn.com/tilejson.json'
                    }
                }
                nextStyle.terrain = {
                    source: 'terrainSource',
                    exaggeration: 1
                }

                nextStyle.sky = {
                    'atmosphere-blend': [
                        'interpolate',
                        ['linear'],
                        ['zoom'],
                        0, 1,
                        2, 0
                    ],
                }

                nextStyle.layers.push({
                    id: 'hills',
                    type: 'hillshade',
                    source: 'hillshadeSource',
                    layout: { visibility: 'visible' },
                    paint: { 'hillshade-shadow-color': '#473B24' }
                })

                const firstNonFillLayer = nextStyle.layers.find(layer => layer.type !== 'fill' && layer.type !== 'background');
                nextStyle.layers.splice(nextStyle.layers.indexOf(firstNonFillLayer), 0, {
                    id: 'satellite',
                    type: 'raster',
                    source: 'satelliteSource',
                    layout: { visibility: 'visible' },
                    paint: { 'raster-opacity': 1 }
                });

                return nextStyle;
            }
        })

    map.addControl(
        new maplibregl.NavigationControl({
            visualizePitch: true,
            showZoom: true,
            showCompass: true
        })
    );


    map.addControl(
        new maplibregl.GlobeControl()
    );

    map.addControl(
        new maplibregl.TerrainControl({
            source: 'terrainSource',
            exaggeration: 1
        })
    );
</script>
</body>
</html>
🔍 代码解析
初始化地图
使用 new maplibregl.Map() 创建地图实例,配置基本参数。本示例的核心特色是展示如何创建带有地形高程的混合卫星地图,包括 globe 投影、卫星影像、地形数据和山体阴影。
javascript
const map = new maplibregl.Map({
    container: 'map',
    zoom: 12,
    center: [11.39085, 47.27574],  // 意大利南蒂罗尔地区
    pitch: 70,       // 初始俯仰角 70°
    maxPitch: 95     // 最大俯仰角 95°
});
关键配置项
- container: 地图容器的 DOM 元素 ID
- zoom: 初始缩放级别为 12,显示城市级别细节
- center : 地图初始中心点
[11.39085, 47.27574](意大利南蒂罗尔地区,阿尔卑斯山脉) - pitch: 初始俯仰角为 70°,呈现明显的3D立体效果
- maxPitch: 最大俯仰角为 95°,允许用户倾斜到接近垂直的视角
样式转换配置
javascript
map.setStyle('https://tiles.openfreemap.org/styles/bright', {
    transformStyle: (previousStyle, nextStyle) => {
        // 1. 设置 globe 投影
        nextStyle.projection = {type: 'globe'};

        // 2. 添加数据源
        nextStyle.sources = {
            ...nextStyle.sources,
            satelliteSource: {
                type: 'raster',
                tiles: ['https://tiles.maps.eox.at/wmts/1.0.0/s2cloudless-2020_3857/default/g/{z}/{y}/{x}.jpg'],
                tileSize: 256
            },
            terrainSource: {
                type: 'raster-dem',
                url: 'https://tiles.mapterhorn.com/tilejson.json'
            },
            hillshadeSource: {
                type: 'raster-dem',
                url: 'https://tiles.mapterhorn.com/tilejson.json'
            }
        };

        // 3. 配置地形
        nextStyle.terrain = {
            source: 'terrainSource',
            exaggeration: 1
        };

        // 4. 配置天空效果(大气混合)
        nextStyle.sky = {
            'atmosphere-blend': ['interpolate', ['linear'], ['zoom'], 0, 1, 2, 0]
        };

        // 5. 添加山体阴影图层
        nextStyle.layers.push({
            id: 'hills',
            type: 'hillshade',
            source: 'hillshadeSource',
            paint: { 'hillshade-shadow-color': '#473B24' }
        });

        // 6. 在非填充图层之前插入卫星图层
        const firstNonFillLayer = nextStyle.layers.find(
            layer => layer.type !== 'fill' && layer.type !== 'background'
        );
        nextStyle.layers.splice(nextStyle.layers.indexOf(firstNonFillLayer), 0, {
            id: 'satellite',
            type: 'raster',
            source: 'satelliteSource',
            paint: { 'raster-opacity': 1 }
        });

        return nextStyle;
    }
});
transformStyle 回调的作用:在样式加载过程中修改样式对象,允许动态添加数据源、图层和配置。
数据源说明
- satelliteSource: Sentinel-2 卫星影像数据源,提供全球覆盖的光学影像
- terrainSource: 地形高程数据源(DEM),用于渲染3D地形
- hillshadeSource: 山体阴影数据源,用于增强地形立体感
添加控件
javascript
// 导航控件(显示缩放和指南针)
map.addControl(new maplibregl.NavigationControl({
    visualizePitch: true,  // 显示俯仰角指示器
    showZoom: true,        // 显示缩放按钮
    showCompass: true      // 显示指南针
}));

// Globe 控件(控制 globe 投影设置)
map.addControl(new maplibregl.GlobeControl());

// 地形控件(调整地形夸张程度)
map.addControl(new maplibregl.TerrainControl({
    source: 'terrainSource',
    exaggeration: 1
}));
⚙️ 参数说明
地图初始化参数
| 参数 | 类型 | 必填 | 默认值 | 说明 |
|---|---|---|---|---|
| container | string | 是 | - | 地图容器元素的 ID |
| zoom | number | 否 | 0 |
初始缩放级别,范围 0-22 |
| center | number, number | 否 | [0, 0] |
初始中心点坐标,格式为 [经度, 纬度] |
| pitch | number | 否 | 0 |
初始俯仰角(度),范围 0-85 |
| maxPitch | number | 否 | 60 |
最大俯仰角(度),本示例设置为 95 |
数据源配置
| 数据源 | 类型 | 说明 |
|---|---|---|
| satelliteSource | raster | Sentinel-2 卫星影像源,提供全球光学影像 |
| terrainSource | raster-dem | 地形高程数据源(DEM),用于渲染3D地形 |
| hillshadeSource | raster-dem | 山体阴影数据源,用于增强地形立体感 |
terrain 配置
| 属性 | 类型 | 必填 | 默认值 | 说明 |
|---|---|---|---|---|
| source | string | 是 | - | 地形数据源名称 |
| exaggeration | number | 否 | 1 |
地形夸张系数,值越大地形越陡峭 |
sky 配置(大气效果)
| 属性 | 类型 | 说明 |
|---|---|---|
| atmosphere-blend | expression | 大气混合效果,随缩放级别变化 |
hillshade 图层配置
| 属性 | 类型 | 必填 | 默认值 | 说明 |
|---|---|---|---|---|
| id | string | 是 | - | 图层唯一标识 |
| type | string | 是 | - | 图层类型,山体阴影为 hillshade |
| source | string | 是 | - | 数据源名称 |
| paint.hillshade-shadow-color | string | 否 | - | 阴影颜色 |
控件配置
| 控件 | 说明 | 用途 |
|---|---|---|
| NavigationControl | 导航控件 | 缩放按钮和指南针 |
| GlobeControl | Globe 控件 | 控制 globe 投影设置 |
| TerrainControl | 地形控件 | 调整地形夸张程度 |
🎨 效果说明
运行代码后,页面显示一个带有地形高程的混合卫星地图:
- 3D Globe 投影: 地图以球体形式展示,支持360度旋转查看全球
- 卫星影像: 使用 Sentinel-2 卫星数据覆盖全球,提供高分辨率光学影像
- 地形高程: 基于 DEM(数字高程模型)数据渲染真实地形起伏,呈现山脉、平原等地形特征
- 山体阴影: 添加光影效果增强地形立体感,使地形更加直观
- 天空效果: 大气混合效果随缩放级别变化,在全球视图时呈现更真实的天空效果
地图默认显示意大利南蒂罗尔地区(阿尔卑斯山脉),俯仰角 70°,呈现强烈的3D透视效果。用户可以:
- 鼠标拖拽旋转 globe,从任意角度观察地球
- 滚轮缩放,从全球视图到局部细节
- 右键倾斜视角,调整俯仰角
- 使用导航控件进行缩放和方向调整
- 使用 Globe 控件调整 globe 投影设置
- 使用 Terrain 控件实时调整地形夸张程度
视觉效果层次(从下到上):
- 卫星影像层: 最底层,提供真实地表纹理
- 山体阴影层: 叠加在卫星影像上,增强地形立体感
- 矢量图层: 道路、建筑等矢量要素
- 天空效果: 大气光晕效果
这种组合创造出极具沉浸感的3D地球可视化体验。
💡 常 见 问 题
Q1: 地形不显示怎么办?
A: 按以下步骤排查:
- 确认地形数据源 URL 可访问(在浏览器中直接访问测试)
- 检查浏览器控制台(F12)是否有跨域错误或其他错误
- 确认已正确配置 terrain 选项,source 名称与数据源名称一致
- 尝试降低 exaggeration 值(从 1 开始)
- 检查是否使用了支持地形的投影(globe 投影或 Web Mercator)
Q2: 如何调整地形高度?
A: 修改 terrain 的 exaggeration 参数:
javascript
nextStyle.terrain = {
    source: 'terrainSource',
    exaggeration: 2  // 增大地形高度,值越大越陡峭
};
Q3: Globe 投影和 Web Mercator 投影有什么区别?
A:
- Globe 投影: 球面投影,展示真实的地球形状,适合全球范围展示
- Web Mercator 投影: 平面投影,在两极会有拉伸变形,适合局部区域详细查看
Globe 投影更适合需要展示地球整体形状的场景,而 Web Mercator 更适合需要精确距离测量的应用。
Q4: 卫星影像加载慢怎么办?
A: 可能原因包括:网络延迟、数据源距离、缩放级别过高。建议:
- 使用 CDN 加速的数据源
- 选择就近的数据源
- 设置合理的 minzoom/maxzoom 限制加载级别
- 考虑使用本地缓存
Q5: 山体阴影和地形有什么关系?
A: 山体阴影是基于地形数据计算的光影效果,用于增强地形的立体感。两者使用相同的 DEM 数据源,但山体阴影是可视化效果,而地形是实际的高程数据。
Q6: 如何切换回平面投影?
A: 修改 projection 配置:
javascript
nextStyle.projection = {type: 'mercator'}; // 切换到 Web Mercator📝 练习任务
- 基础练习 :修改
pitch参数为 45°,观察视角变化,比较不同俯仰角的视觉效果 - 进阶挑战 :修改
exaggeration参数为 2,增强地形效果,并观察地形变化 - 拓展练习:添加一个滑块控件,允许用户实时调整卫星影像的透明度
- 拓展思考:如何实现卫星影像透明度的动态调整?需要修改哪些图层属性?
🌟 最佳实践
- 数据源选择: 选择稳定可靠的地形和影像数据源,优先使用 CDN 加速的服务
- 性能优化: 合理设置地形数据源的 minzoom/maxzoom,避免不必要的加载
- 夸张系数: 根据场景选择合适的地形夸张系数(通常 1-3),避免过度夸张导致失真
- 投影选择: 根据应用场景选择 Globe 或 Web Mercator 投影,Globe 适合全球展示,Web Mercator 适合局部分析
- 控件配置: 提供地形控制面板,让用户可以调整夸张程度等参数
- 移动端适配: 在移动设备上降低地形复杂度或禁用地形,提升性能
- 错误处理: 添加数据源加载失败的降级方案,如显示默认底图
- 图层顺序: 合理安排图层顺序,确保卫星影像在底层,山体阴影在中间,矢量图层在顶层
- 天空效果: 根据缩放级别调整天空效果,提升视觉体验
- 缓存策略: 对地形和影像数据实施缓存,减少重复请求
🔗 延伸阅读
-
下一课预告:将继续学习地图图层的基础知识
本文是MapLibre GL JS实践课程系列的一部分,欢迎关注收藏