现有的绘图模板太复杂了,平时绘图时,只想在plot(x,y)里加几个字符来确定配色。在此想法的基础上,编写了matlab函数,能方便色彩调用
| 函数名 | 对应图片 | 颜色数 | 风格特征 |
|---|---|---|---|
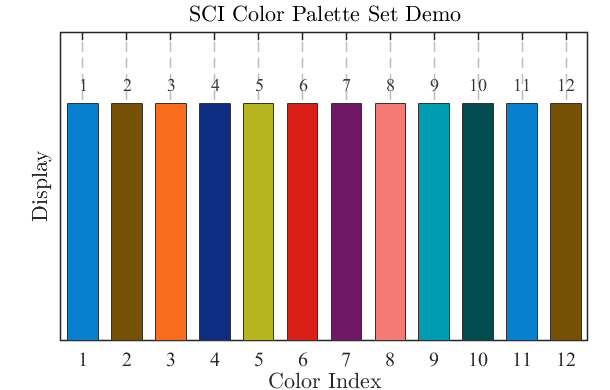
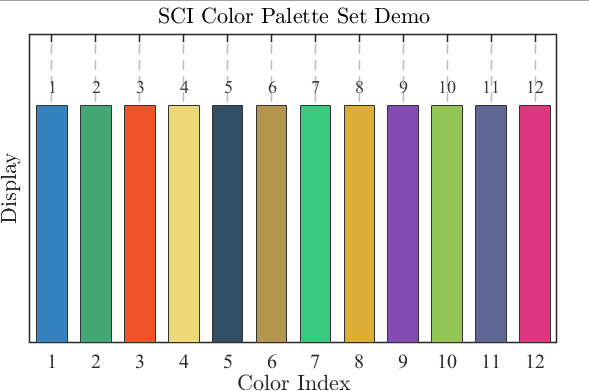
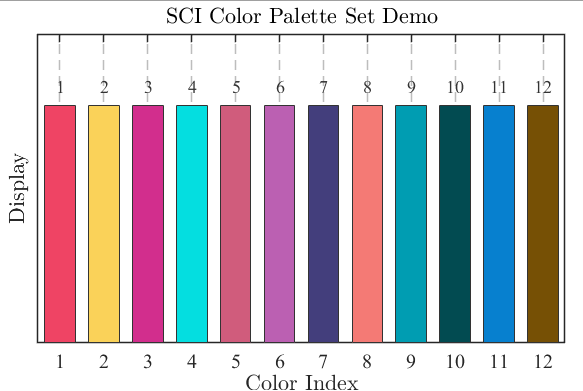
sci_color_set1 |
图片(1) | 12 | 蓝-棕-红冷暖对比 |
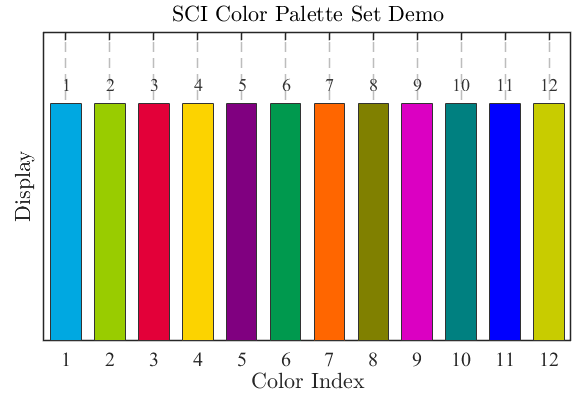
sci_color_set2 |
图片(2) | 12 | 高饱和彩虹色 |
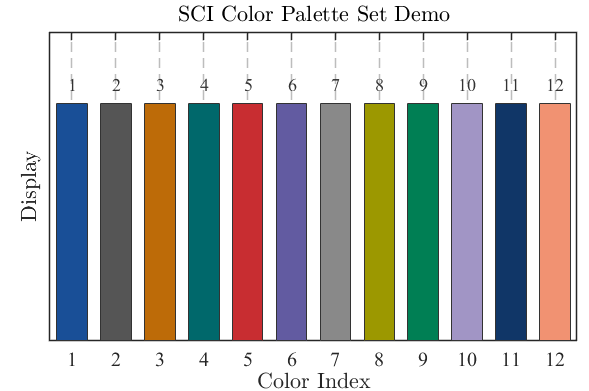
sci_color_set3 |
图片(3) | 12 | 低饱和商务灰调 |
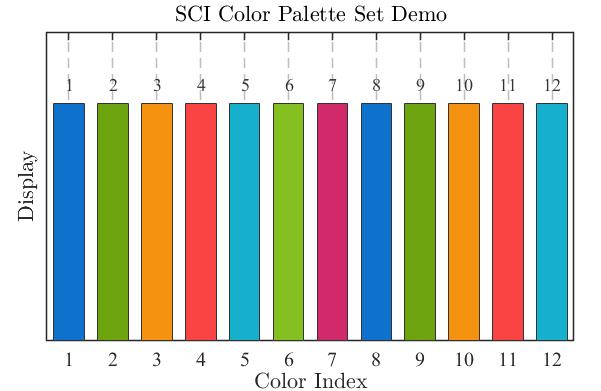
sci_color_set4 |
图片(4) | 12 | 蓝-绿-橙-红循环 |
sci_color_set5 |
图片(5) | 12 | 莫兰迪柔和色 |
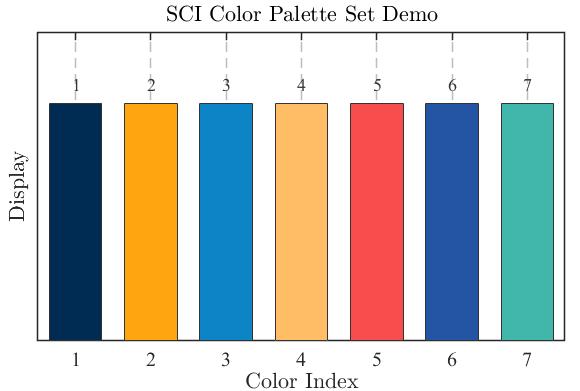
sci_color_set6 |
图片(6) | 7 | 深蓝-暖黄-青绿 |
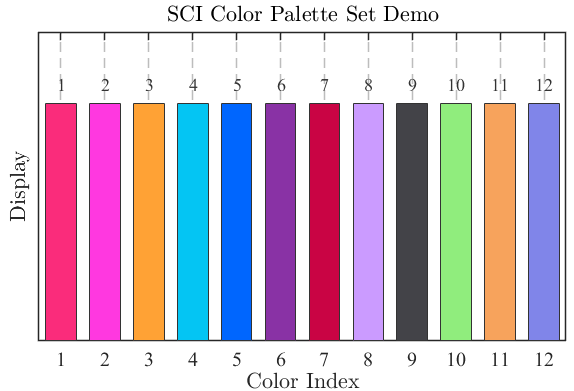
sci_color_set7 |
图片(7) | 12 | 霓虹高亮糖果色 |
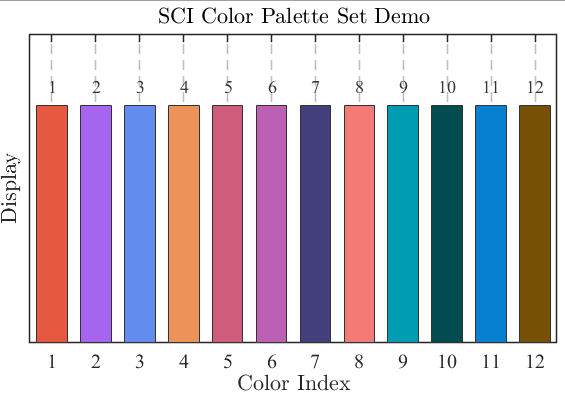
sci_color_set8 |
图片(8) | 12 | 暖红-紫-蓝渐变 |
sci_color_set9 |
图片(9) | 12 | 红-粉-青对比 |
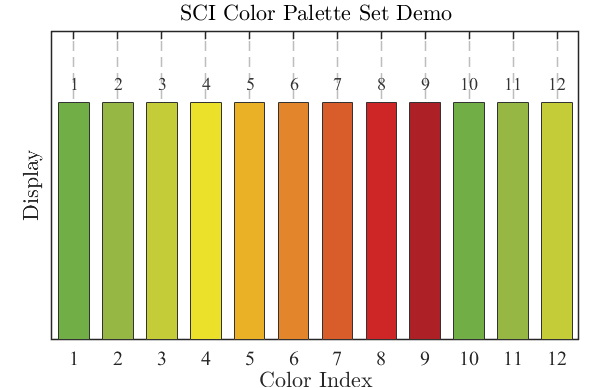
sci_color_set10 |
图片(10) | 12 | 青红色调对比 |
matlab基础颜色
matlab
%使用时注意代码里是否有归一化,如果有归一化,需要修改,如红色为[255, 0, 0]/255
'r'  % 红色 [1, 0, 0]
'g'  % 绿色 [0, 1, 0]
'b'  % 蓝色 [0, 0, 1]
'c'  % 青色 [0, 1, 1]
'm'  % 品红 [1, 0, 1]
'y'  % 黄色 [1, 1, 0]
'k'  % 黑色 [0, 0, 0]
'w'  % 白色 [1, 1, 1]
0.调用代码
matlab
%% 配色设置,选择对应的色系即可
C_000    = [0 0 0];%纯黑色
C_1  = sci_color_set(1);%在这里设置色系
C_2  = sci_color_set(3);%在这里设置色系
C_3 = sci_color_set(5);%在这里设置色系
C_4 = sci_color_set(7);%在这里设置色系
C_5 = sci_color_set(9);%在这里设置色系

%% 画图对比
figure(1)
plot(time,Res_000,'Color', C_000);
hold on
plot(time,Res_1,'Color',C_1)
hold on
plot(time,Res_2,'Color',C_2)
hold on
plot(time,Res_3,'Color',C_3)
hold on
plot(time,Res_4,'Color',C_4)
hold on
plot(time,Res_5,'Color',C_5)
1.主函数:查看对应色系的颜色示意图及具体编号
matlab
%% 示例:遍历 sci_color_set 的所有配色,绘制柱状图
clc; clear; close all;

figure('Name', 'Color Palette Demo', 'Color', 'w', ...
       'Units', 'centimeters', 'Position', [3 3 12 7]);
hold on; box on; grid on;

% 获取全部颜色
colors = sci_color_set10();%%%%%%%%%%%%%%%%%%%%%%%%%%%%%%%%%%%%%%%%%%%%%%%%%%%%%%%%%%%%%%%%%%%%%%%%%%%%%%%%%%%
n = size(colors, 1);

% 绘制柱状图(统一高度,展示颜色)
h = bar(1:n, ones(1,n), 0.7, 'FaceColor', 'flat', ...
        'EdgeColor', [0.2 0.2 0.2], 'LineWidth', 0.3);
h.CData = colors;

% 坐标轴与标签
xlim([0.5, n+0.5]);
ylim([0, 1.3]);
xlabel('Color Index', 'Interpreter', 'latex', 'FontSize', 12);
ylabel('Display', 'Interpreter', 'latex', 'FontSize', 12);
title('SCI Color Palette Set Demo', 'Interpreter', 'latex', 'FontSize', 13);

% 全局字体与刻度
set(gca, 'FontName', 'Times New Roman', 'FontSize', 10, ...
         'TickDir', 'in', 'TickLength', [0.015 0.025], ...
         'XTick', 1:n, 'YTick', [], 'LineWidth', 0.8, ...
         'GridLineStyle', '--', 'GridAlpha', 0.3);

% 在柱子上方标注编号
for i = 1:n
    text(i, 1.08, sprintf('%d', i), ...
         'HorizontalAlignment', 'center', ...
         'FontName', 'Times New Roman', 'FontSize', 9, ...
         'Color', [0.2 0.2 0.2]);
end

% 可选:保存高分辨率图片
% print(gcf, 'ColorPalette_Set5_Bar', '-dtiff', '-r600');
2.具体色系示意函数
(1)sci_color_set1
matlab
%% ==================== Set 1 (对应 图片1) ====================
function colors = sci_color_set1(index)
%SCI_COLOR_SET1 返回SCI论文级配色方案1 (RGB, 0-1)
%   序号  HEX       RGB
%   1     #0780cf   [7,128,207]
%   2     #765005   [118,80,5]
%   3     #fa6d1d   [250,109,29]
%   4     #0e2c82   [14,44,130]
%   5     #b6b51f   [182,181,31]
%   6     #da1f18   [218,31,24]
%   7     #701866   [112,24,102]
%   8     #f47a75   [244,122,117]
%   9     #009db2   [0,157,178]
%   10    #024b51   [2,75,81]
%   11    #0780cf   [7,128,207]
%   12    #765005   [118,80,5]

    rgb_map = [
         7,128,207; 118,80,5; 250,109,29; 14,44,130;
       182,181,31; 218,31,24; 112,24,102; 244,122,117;
         0,157,178;   2,75,81;   7,128,207; 118,80,5
    ] / 255;

    if nargin == 0
        colors = rgb_map;
    else
        index = mod(index-1, size(rgb_map,1)) + 1;
        colors = rgb_map(index, :);
    end
end
(2)sci_color_set2
matlab
%% ==================== Set 2 (对应 图片2) ====================
function colors = sci_color_set2(index)
%SCI_COLOR_SET2 返回SCI论文级配色方案2 (RGB, 0-1)
%   序号  HEX       RGB
%   1     #00a8e1   [0,168,225]
%   2     #99cc00   [153,204,0]
%   3     #e30039   [227,0,57]
%   4     #fcd300   [252,211,0]
%   5     #800080   [128,0,128]
%   6     #00994e   [0,153,78]
%   7     #ff6600   [255,102,0]
%   8     #808000   [128,128,0]
%   9     #db00c2   [219,0,194]
%   10    #008080   [0,128,128]
%   11    #0000ff   [0,0,255]
%   12    #c8cc00   [200,204,0]

    rgb_map = [
         0,168,225; 153,204,0; 227,0,57; 252,211,0;
         128,0,128;   0,153,78; 255,102,0; 128,128,0;
         219,0,194;   0,128,128;   0,0,255; 200,204,0
    ] / 255;

    if nargin == 0
        colors = rgb_map;
    else
        index = mod(index-1, size(rgb_map,1)) + 1;
        colors = rgb_map(index, :);
    end
end
(3)sci_color_set3
matlab
%% ==================== Set 3 (对应 图片3) ====================
function colors = sci_color_set3(index)
%SCI_COLOR_SET3 返回SCI论文级配色方案3 (RGB, 0-1)
%   序号  HEX       RGB
%   1     #194f97   [25,79,151]
%   2     #555555   [85,85,85]
%   3     #bd6b08   [189,107,8]
%   4     #00686b   [0,104,107]
%   5     #c82d31   [200,45,49]
%   6     #625ba1   [98,91,161]
%   7     #898989   [137,137,137]
%   8     #9c9800   [156,152,0]
%   9     #007f54   [0,127,84]
%   10    #a195c5   [161,149,197]
%   11    #103667   [16,54,103]
%   12    #f19272   [241,146,114]

    rgb_map = [
         25,79,151;  85,85,85; 189,107,8;   0,104,107;
        200,45,49;  98,91,161; 137,137,137; 156,152,0;
          0,127,84; 161,149,197;  16,54,103; 241,146,114
    ] / 255;

    if nargin == 0
        colors = rgb_map;
    else
        index = mod(index-1, size(rgb_map,1)) + 1;
        colors = rgb_map(index, :);
    end
end
(4)sci_color_set4
matlab
%% ==================== Set 4 (对应 图片4) ====================
function colors = sci_color_set4(index)
%SCI_COLOR_SET4 返回SCI论文级配色方案4 (RGB, 0-1)
%   序号  HEX       RGB
%   1     #0e72cc   [14,114,204]
%   2     #6ca30f   [108,163,15]
%   3     #f59311   [245,147,17]
%   4     #fa4343   [250,67,67]
%   5     #16afcc   [22,175,204]
%   6     #85c021   [133,192,33]
%   7     #d12a6a   [209,42,106]
%   8     #0e72cc   [14,114,204]
%   9     #6ca30f   [108,163,15]
%   10    #f59311   [245,147,17]
%   11    #fa4343   [250,67,67]
%   12    #16afcc   [22,175,204]

    rgb_map = [
        14,114,204; 108,163,15; 245,147,17; 250,67,67;
        22,175,204; 133,192,33; 209,42,106; 14,114,204;
        108,163,15; 245,147,17; 250,67,67;  22,175,204
    ] / 255;

    if nargin == 0
        colors = rgb_map;
    else
        index = mod(index-1, size(rgb_map,1)) + 1;
        colors = rgb_map(index, :);
    end
end
(5)sci_color_set5
matlab
%% ==================== Set 5 (对应 图片5) ====================
function colors = sci_color_set5(index)
%SCI_COLOR_SET5 返回SCI论文级配色方案5 (RGB, 0-1)
%   序号  HEX       RGB
%   1     #3682be   [54,130,190]
%   2     #45a776   [69,167,118]
%   3     #f05326   [240,83,38]
%   4     #eed777   [238,215,119]
%   5     #334f65   [51,79,101]
%   6     #b3974e   [179,151,78]
%   7     #38cb7d   [56,203,125]
%   8     #ddae33   [221,174,51]
%   9     #844bb3   [132,75,179]
%   10    #93c555   [147,197,85]
%   11    #5f6694   [95,102,148]
%   12    #df3881   [223,56,129]

    rgb_map = [
        54,130,190;  69,167,118; 240,83,38; 238,215,119;
        51,79,101;  179,151,78;  56,203,125; 221,174,51;
       132,75,179; 147,197,85;  95,102,148; 223,56,129
    ] / 255;

    if nargin == 0
        colors = rgb_map;
    else
        index = mod(index-1, size(rgb_map,1)) + 1;
        colors = rgb_map(index, :);
    end
end
(6)sci_color_set6
matlab
%% ==================== Set 6 (对应 图片6) ====================
function colors = sci_color_set6(index)
%SCI_COLOR_SET6 返回SCI论文级配色方案6 (RGB, 0-1)
%   序号  HEX       RGB
%   1     #002c53   [0,44,83]
%   2     #ffa510   [255,165,16]
%   3     #0c84c6   [12,132,198]
%   4     #ffbd66   [255,189,102]
%   5     #f74d4d   [247,77,77]
%   6     #2455a4   [36,85,164]
%   7     #41b7ac   [65,183,172]

    rgb_map = [
         0,44,83; 255,165,16; 12,132,198; 255,189,102;
       247,77,77;  36,85,164;  65,183,172
    ] / 255;

    if nargin == 0
        colors = rgb_map;
    else
        index = mod(index-1, size(rgb_map,1)) + 1;
        colors = rgb_map(index, :);
    end
end
(7)sci_color_set7
matlab
%% ==================== Set 7 (对应 图片7) ====================
function colors = sci_color_set7(index)
%SCI_COLOR_SET7 返回SCI论文级配色方案7 (RGB, 0-1)
%   序号  HEX       RGB
%   1     #fa2c7b   [250,44,123]
%   2     #ff38e0   [255,56,224]
%   3     #ffa235   [255,162,53]
%   4     #04c5f3   [4,197,243]
%   5     #0066fe   [0,102,254]
%   6     #8932a5   [137,50,165]
%   7     #c90444   [201,4,68]
%   8     #cb9bff   [203,155,255]
%   9     #434348   [67,67,72]
%   10    #90ed7d   [144,237,125]
%   11    #f7a35c   [247,163,92]
%   12    #8085e9   [128,133,233]

    rgb_map = [
       250,44,123; 255,56,224; 255,162,53;   4,197,243;
         0,102,254; 137,50,165; 201,4,68;   203,155,255;
        67,67,72; 144,237,125; 247,163,92; 128,133,233
    ] / 255;

    if nargin == 0
        colors = rgb_map;
    else
        index = mod(index-1, size(rgb_map,1)) + 1;
        colors = rgb_map(index, :);
    end
end
(8)sci_color_set8
matlab
%% ==================== Set 8 (对应 图片8) ====================
function colors = sci_color_set8(index)
%SCI_COLOR_SET8 返回SCI论文级配色方案8 (RGB, 0-1)
%   序号  HEX       RGB
%   1     #e75840   [231,88,64]
%   2     #a565ef   [165,101,239]
%   3     #628cee   [98,140,238]
%   4     #eb9358   [235,147,88]
%   5     #d05c7c   [208,92,124]
%   6     #bb60b2   [187,96,178]
%   7     #433e7c   [67,62,124]
%   8     #f47a75   [244,122,117]
%   9     #009db2   [0,157,178]
%   10    #024b51   [2,75,81]
%   11    #0780cf   [7,128,207]
%   12    #765005   [118,80,5]

    rgb_map = [
       231,88,64; 165,101,239;  98,140,238; 235,147,88;
       208,92,124; 187,96,178;  67,62,124; 244,122,117;
         0,157,178;   2,75,81;    7,128,207; 118,80,5
    ] / 255;

    if nargin == 0
        colors = rgb_map;
    else
        index = mod(index-1, size(rgb_map,1)) + 1;
        colors = rgb_map(index, :);
    end
end
(9)sci_color_set9
matlab
%% ==================== Set 9 (对应 图片9) ====================
function colors = sci_color_set9(index)
%SCI_COLOR_SET9 返回SCI论文级配色方案9 (RGB, 0-1)
%   序号  HEX       RGB
%   1     #ef4464   [239,68,100]
%   2     #fad259   [250,210,89]
%   3     #d22e8d   [210,46,141]
%   4     #03dee0   [3,222,224]
%   5     #d05c7c   [208,92,124]
%   6     #bb60b2   [187,96,178]
%   7     #433e7c   [67,62,124]
%   8     #f47a75   [244,122,117]
%   9     #009db2   [0,157,178]
%   10    #024b51   [2,75,81]
%   11    #0780cf   [7,128,207]
%   12    #765005   [118,80,5]

    rgb_map = [
       239,68,100; 250,210,89; 210,46,141;   3,222,224;
       208,92,124; 187,96,178;  67,62,124; 244,122,117;
         0,157,178;   2,75,81;    7,128,207; 118,80,5
    ] / 255;

    if nargin == 0
        colors = rgb_map;
    else
        index = mod(index-1, size(rgb_map,1)) + 1;
        colors = rgb_map(index, :);
    end
end
(10)sci_color_set10
matlab
%% ==================== Set 1 (对应 图片1) ====================
function colors = sci_color_set10(index)
%SCI_COLOR 返回SCI论文级配色 (RGB, 0-1)
% 基于绿→黄→红渐变色谱,色盲友好,打印清晰
% colors = sci_color(index) 返回指定序号颜色
% colors = sci_color() 返回全部12色矩阵
%
% 序号 HEX RGB
% 1 #71ae46 [113,174,70] 绿
% 2 #96b744 [150,183,68] 浅绿
% 3 #c4cc38 [196,204,56] 黄绿
% 4 #ebe12a [235,225,42] 黄
% 5 #eab026 [234,176,38] 橙黄
% 6 #e3852b [227,133,43] 橙
% 7 #d85d2a [216,93,42] 红橙
% 8 #ce2626 [206,38,38] 红
% 9 #a20226 [172,32,38] 深红
% 10~12 循环前3色
rgb_map = [
113, 174, 70; % 1 绿
150, 183, 68; % 2 浅绿
196, 204, 56; % 3 黄绿
235, 225, 42; % 4 黄
234, 176, 38; % 5 橙黄
227, 133, 43; % 6 橙
216, 93, 42; % 7 红橙
206, 38, 38; % 8 红
172, 32, 38; % 9 深红
113, 174, 70; % 10
150, 183, 68; % 11
196, 204, 56; % 12
] / 255;
if nargin == 0
colors = rgb_map;
else
index = mod(index-1, 12) + 1; % 循环索引
colors = rgb_map(index, :);
end
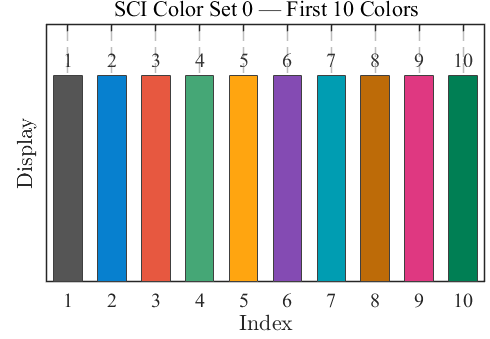
end(11)sci_color_set0(强对比度)
matlab
function colors = sci_color_set0(index)
%SCI_COLOR_SET0 精选10色通用SCI论文配色 (RGB, 0-1)
%   从9个经典色系中筛选出的10色万能盘,色盲友好,打印清晰
%   有N条曲线/柱状图,直接依次调用前N色即可
%
%   调用方式:
%   c = sci_color_set0(3)      ------ 取第3号颜色
%   c = sci_color_set0()       ------ 返回全部 10×3 颜色矩阵
%   plot(x,y,'Color',sci_color_set0(2))  ------ 直接绘图
%
%   序号  来源    HEX       RGB(0-1)              推荐用途
%   1     Set3    #555555   [0.33,0.33,0.33]      真值/基准/参考线
%   2     Set1    #0780cf   [0.03,0.50,0.81]      算法1 / 主对比
%   3     Set8    #e75840   [0.91,0.35,0.25]      算法2
%   4     Set5    #45a776   [0.27,0.65,0.46]      算法3
%   5     Set6    #ffa510   [1.00,0.65,0.06]      算法4
%   6     Set5    #844bb3   [0.52,0.29,0.70]      算法5
%   7     Set1    #009db2   [0.00,0.62,0.70]      算法6
%   8     Set3    #bd6b08   [0.74,0.42,0.03]      算法7
%   9     Set5    #df3881   [0.87,0.22,0.51]      算法8
%   10    Set3    #007f54   [0.00,0.50,0.33]      算法9

    rgb_map = [
        85,  85,  85;   % 1  Set3 #555555 深灰
         7, 128, 207;   % 2  Set1 #0780cf 学术蓝
       231,  88,  64;   % 3  Set8 #e75840 砖红
        69, 167, 118;   % 4  Set5 #45a776 青绿
       255, 165,  16;   % 5  Set6 #ffa510 金黄
       132,  75, 179;   % 6  Set5 #844bb3 紫
         0, 157, 178;   % 7  Set1 #009db2 青
       189, 107,   8;   % 8  Set3 #bd6b08 棕
       223,  56, 129;   % 9  Set5 #df3881 玫红
         0, 127,  84    % 10 Set3 #007f54 深绿
    ] / 255;

    if nargin == 0
        colors = rgb_map;
    else
        index = mod(index-1, size(rgb_map,1)) + 1;  % 循环索引
        colors = rgb_map(index, :);
    end
end