提示:本文原创作品,良心制作,干货为主,简洁清晰,一看就会
文章目录
- 前言
- 一、整体概述
-
- [1.1 实验环境](#1.1 实验环境)
- [1.2 K8s基于Prometheus Operator全链路监控指标采集流程](#1.2 K8s基于Prometheus Operator全链路监控指标采集流程)
- 二、监控Calico组件
-
- [2.1 监控 Calico Felix](#2.1 监控 Calico Felix)
- [2.2 监控kube-controllers](#2.2 监控kube-controllers)
- 三、监控ingress-nginx
-
- [3.1 打开metrics监听及svc映射端口](#3.1 打开metrics监听及svc映射端口)
- [3.2 创建servicemonitor](#3.2 创建servicemonitor)
- [3.3 grafana添加dashboard面板](#3.3 grafana添加dashboard面板)
前言
此前我们借助 Prometheus Operator 完成了 K8s 高可用集群监控,覆盖 etcd、kube-controller-manager、kube-scheduler、kube-proxy 等组件。本文继续讲解 Calico 与 ingress-nginx 的监控配置,新手可参考往期两篇文章查漏补缺
一、整体概述
1.1 实验环境
我的实验环境:
| 主机名 | ip | 作用 |
|---|---|---|
| K8s-master1 | 192.168.13.136 | k8s控制节点 |
| K8s-master2 | 192.168.13.137 | k8s控制节点 |
| K8s-master3 | 192.168.13.138 | k8s控制节点 |
| k8s-node1 | 192.168.13.139 | k8s工作节点 |
| k8s-node2 | 192.168.13.140 | k8s工作节点 |
| NFS | 192.168.13.141 | NFS服务端,提供存储 |
1.2 K8s基于Prometheus Operator全链路监控指标采集流程
用 Prometheus Operator 标准化管理 Prometheus,ServiceMonitor 声明式配置监控规则,依托 K8s 原生 Service/Endpoints 自动发现 Pod,完成指标采集存储并由 Grafana 展示的云原生监控全流程
yaml
【用户编写资源】
      ↓
1. ServiceMonitor(CRD:采集规则说明书)
   配置:标签筛选规则、metrics端口、抓取周期
      ↓(Operator持续监听CRD变更)
2. Prometheus Operator控制器
   ✅ 自动解析所有ServiceMonitor
   ✅ 自动生成prometheus.yml配置文件(内置kubernetes_sd_configs K8s服务发现+relabel规则)
   ✅ 热更新Prometheus配置,无需手动重启Prometheus Pod
      ↓(配置下发至Prometheus实例)
3. Prometheus Server
   依托配置调用K8s APIServer,触发【K8s Endpoints服务发现】
      ↓(APIServer查询集群资源关联关系)
4. Service资源(关键中转层)
   · Service依靠selector标签绑定后端Pod
   · K8s控制器自动生成对应Endpoints(Endpoints=Pod真实IP+端口清单)
   · ServiceMonitor靠spec.selector匹配Service标签,命中即纳入采集任务
      ↓(解析Endpoints列表)
5. Endpoints = 实际监控目标(每个Pod IP:metrics端口)
      ↓
6. 业务/组件Pod(kube-controller-manager/etcd/node-exporter等)
   暴露 /metrics 指标接口
      ↓
7. Prometheus定时拉取指标存入时序数据库
      ↓
8. Grafana配置Dashboard读取Prometheus数据源,可视化展示监控数据
理解上述流程,能帮助我们更好的监控下面指标
二、监控Calico组件
Calico的组件:
Felix:Calico 的 "大脑",运行在每个节点上,负责所有网络策略的实现
Typha:可选扩展组件,专门优化节点和数据存储之间的通信,提升集群规模上限
kube-controllers:Calico 的控制平面管家,负责资源清理、K8s API 同步等核心管理工作
监控配置:以上组件均可配置向 Prometheus 暴露监控指标,实现全链路监控覆盖
2.1 监控 Calico Felix
查看calico-node基本情况
yaml
## 1. 查看calico-node pod
root@k8s-master1:~# kubectl get pod -n calico-system | grep calico-node
calico-node-7zpmm                          1/1     Running   1 (5h36m ago)    24h
calico-node-8mbk7                          1/1     Running   1 (5h55m ago)    23h
calico-node-gj5pz                          1/1     Running   1 (5h36m ago)    24h
calico-node-k6wpw                          1/1     Running   1 (5h36m ago)    24h
calico-node-k95vj                          1/1     Running   1 (5h36m ago)    24h

## 查看pod标签
root@k8s-master1:~# kubectl get pod calico-node-7zpmm -n calico-system --show-labels
NAME                READY   STATUS    RESTARTS        AGE   LABELS
calico-node-7zpmm   1/1     Running   1 (5h37m ago)   24h   app.kubernetes.io/name=calico-node,controller-revision-hash=5f84f7dcd7,k8s-app=calico-node,pod-template-generation=6

## 2. 查看calico-node有没有svc,可以看到没有
root@k8s-master1:~# kubectl get svc -n calico-system
NAME                              TYPE        CLUSTER-IP      EXTERNAL-IP   PORT(S)    AGE
calico-kube-controllers-metrics   ClusterIP   None            <none>        9094/TCP   58d
calico-typha                      ClusterIP   10.105.252.79   <none>        5473/TCP   58d

## 3. 查看calico-node有没有自动生成servicemonitor,可以看到没有
root@k8s-master1:~# kubectl get servicemonitor -n monitoring | grep calico
由于calico-node没有svc和servicemonitor ,所以接下来我们要创建相关的svc和servicemonitor
打开metrics监听
在此之前我们要打开calico的metrics监听,calico在启动时,默认没有打开metrics监听
yaml
root@k8s-master1:~# kubectl patch felixconfiguration default --type merge --patch '{"spec":{"prometheusMetricsEnabled": true}}'
root@k8s-master1:~# curl http://192.168.13.136:9091/metrics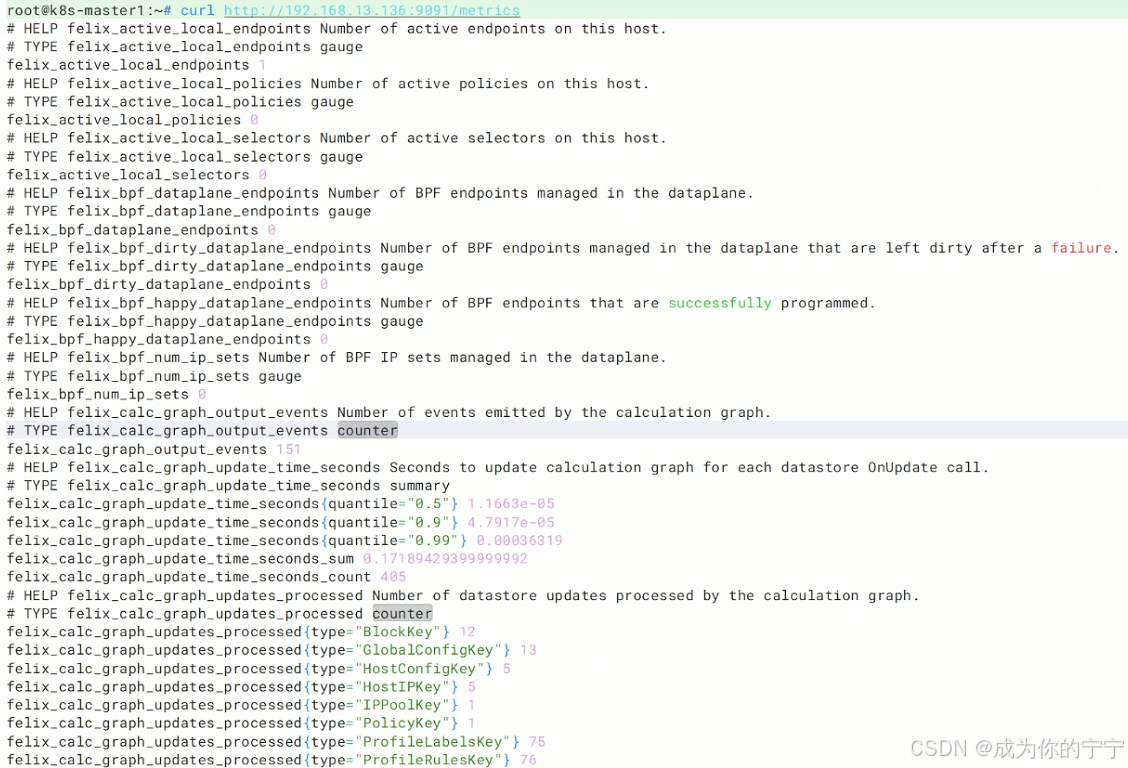
创建svc
yaml
root@k8s-master1:~# cd /k8s/svc/
root@k8s-master1:/k8s/svc# vim calico.yaml
apiVersion: v1
kind: Service
metadata:
  name: felix-metrics-svc
  namespace: calico-system
  labels:
    k8s-app: calico-node
spec:
  clusterIP: None
  selector:
    k8s-app: calico-node  # 要和pod的标签匹配
  ports:
  - name: http-metrics
    port: 9091
    targetPort: 9091
root@k8s-master1:/k8s/svc#
root@k8s-master1:/k8s/svc# kubectl apply -f calico.yaml
创建serviceMonitor
yaml
root@k8s-master1:~# cd kube-prometheus/manifests/
root@k8s-master1:~/kube-prometheus/manifests# vim calico-serviceMonitor.yaml
apiVersion: monitoring.coreos.com/v1
kind: ServiceMonitor
metadata:
  name: calico-node-metrics
  namespace: monitoring
spec:
  selector:
    matchLabels:
      k8s-app: calico-node   # 抓取calico-node的svc标签
  namespaceSelector:
    matchNames:
    - calico-system   # calico-node所在命名空间
  endpoints:
  - port: http-metrics
    interval: 15s
    path: /metrics
root@k8s-master1:~/kube-prometheus/manifests# kubectl apply -f calico-serviceMonitor.yaml
prometheus开跨命名空间的权限
由于我的calico不在kube-system下,所以我现在需要对prometheus开跨命名空间的权限,让它能发现并监控 Calico 的指标
yaml
## prometheus访问k8s看有没有权限查看calico-system命名空间下的endpoints
root@k8s-master1:~# kubectl auth can-i list endpoints  --as=system:serviceaccount:monitoring:prometheus-k8s -n calico-system
no
yaml
## prometheus开跨命名空间的权限
root@k8s-master1:~# vim kube-prometheus/manifests/prometheus-rbac.yaml
# 创建一个集群级角色
apiVersion: rbac.authorization.k8s.io/v1
kind: ClusterRole
metadata:
  name: prometheus-cross-namespace
rules:
- apiGroups: [""]
  resources: ["services", "endpoints", "pods"]
  verbs: ["get", "list", "watch"]
---
# 上面的权限绑定给Prometheus账号
apiVersion: rbac.authorization.k8s.io/v1
kind: ClusterRoleBinding
metadata:
  name: prometheus-cross-namespace-binding
subjects:
- kind: ServiceAccount
  name: prometheus-k8s
  namespace: monitoring
roleRef:
  kind: ClusterRole
  name: prometheus-cross-namespace
  apiGroup: rbac.authorization.k8s.io
root@k8s-master1:~# kubectl apply -f kube-prometheus/manifests/prometheus-rbac.yaml
yaml
## 再次查看
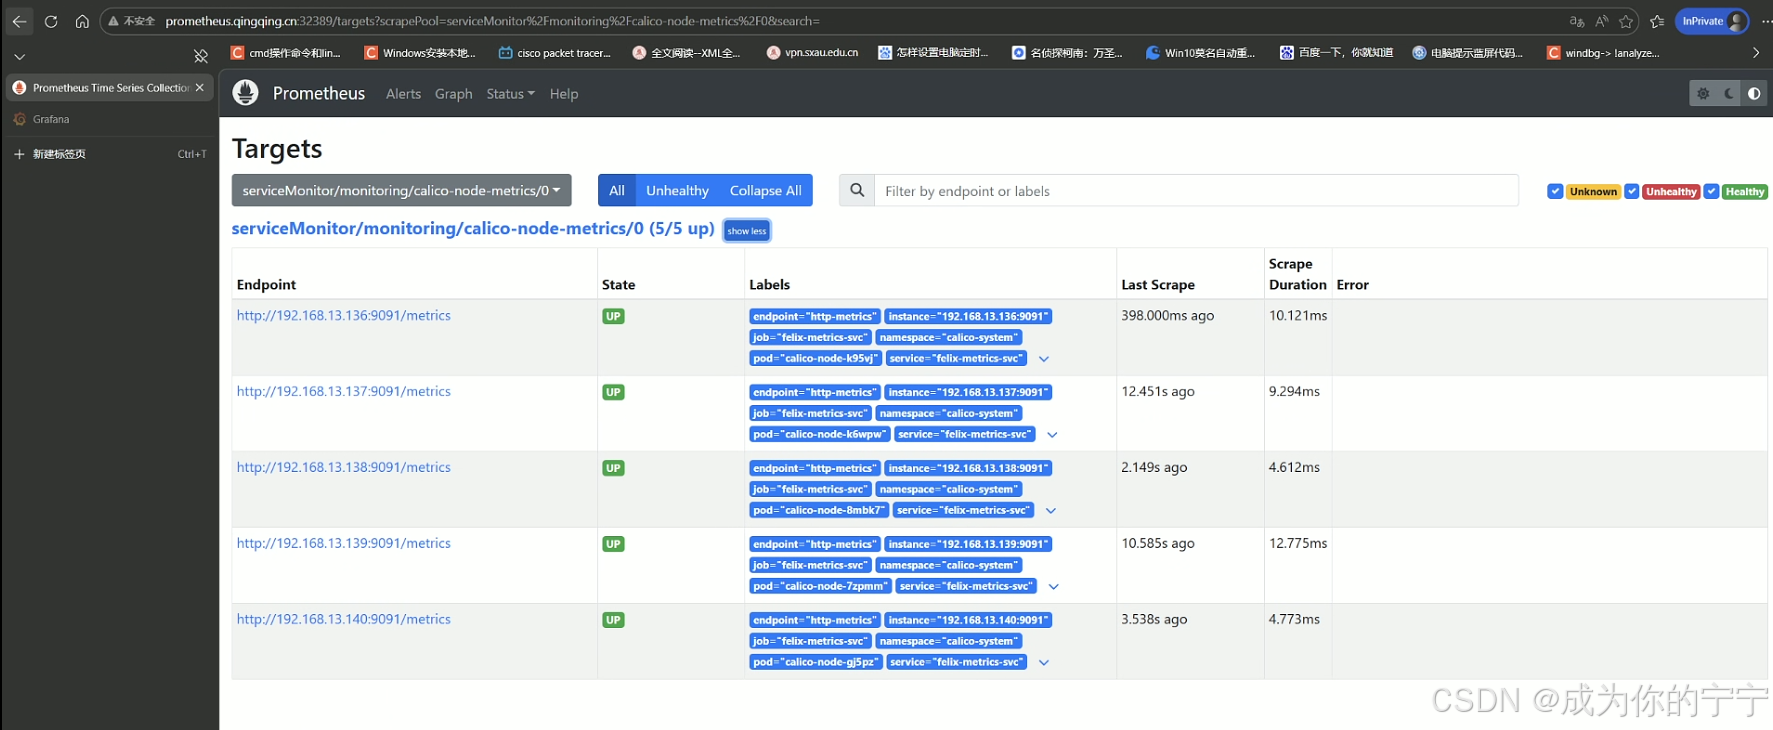
root@k8s-master1:~# kubectl auth can-i list endpoints --as=system:serviceaccount:monitoring:prometheus-k8s -n calico-system
yes浏览器访问Prometheus,可以看到已经监控到calico felix实例了
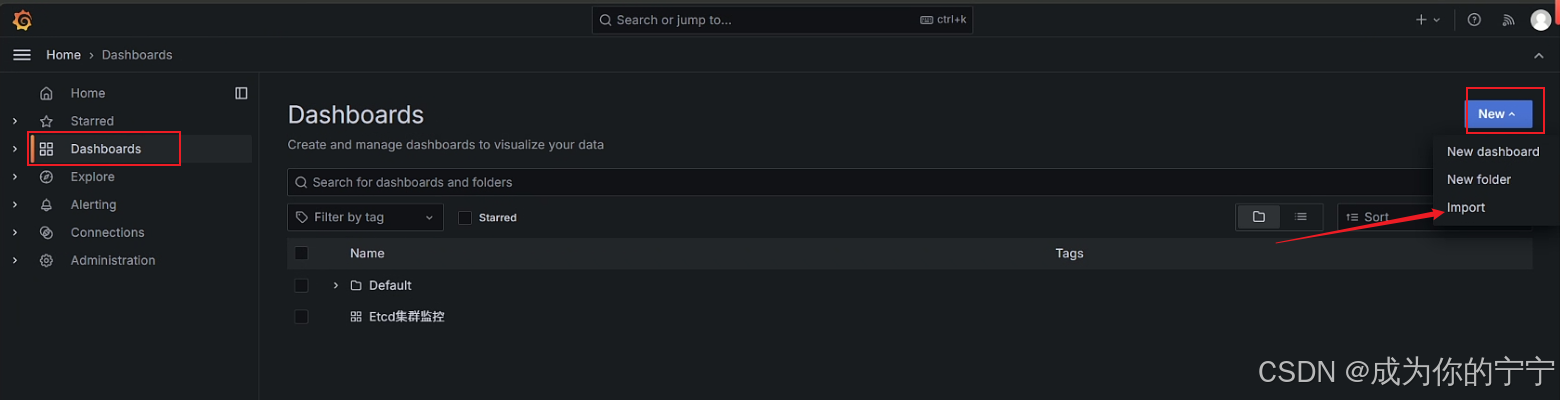
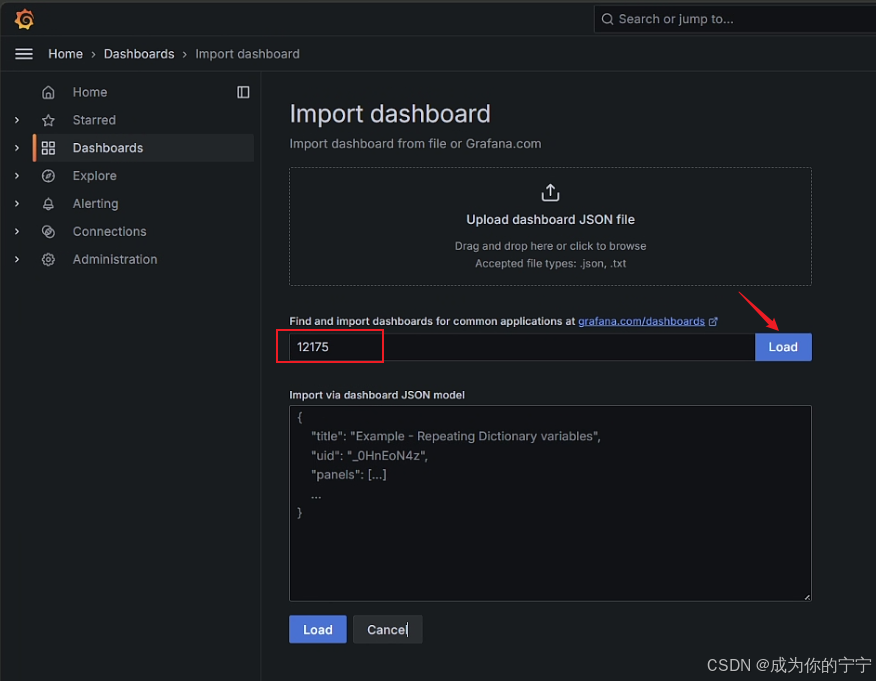
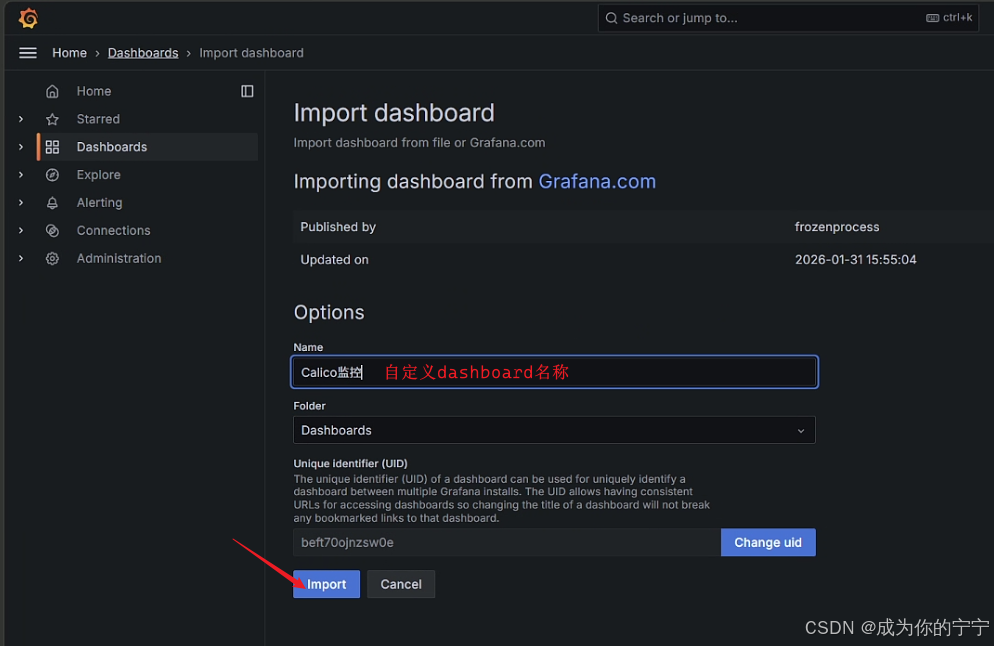
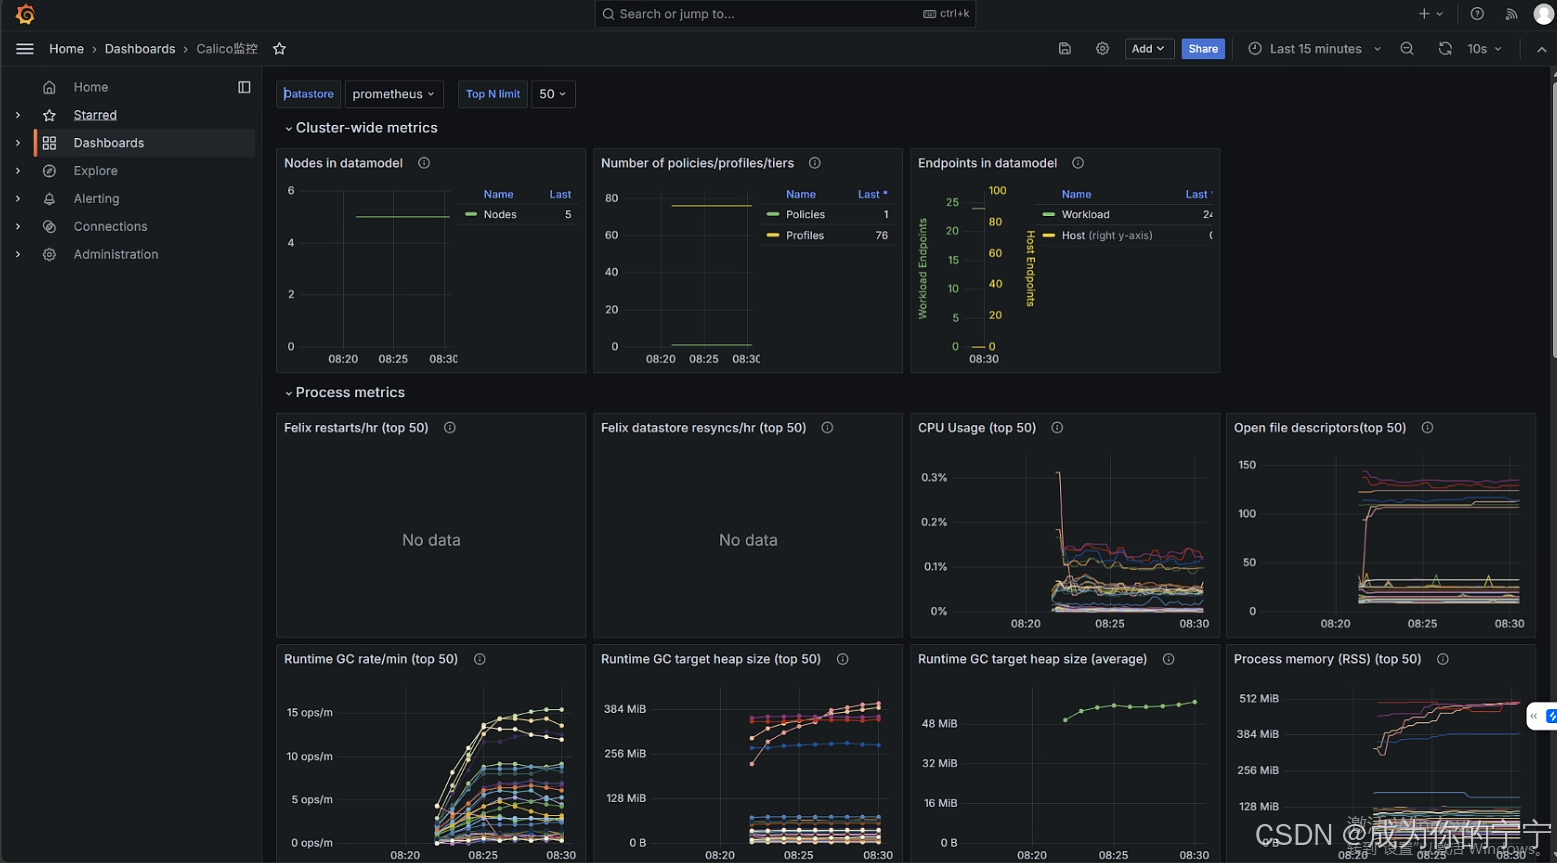
grafana添加dashboard面板
https://grafana.com/grafana/dashboards/12175-calico-felix/
2.2 监控kube-controllers
查看kube-controllers基本情况
yaml
## 1. 查看kube-controllers pod
root@k8s-master1:~# kubectl get pod -n calico-system | grep kube-controllers
calico-kube-controllers-65c5875bc8-t8m28   1/1     Running   9 (56m ago)    60d

## 2. 查看pod标签
root@k8s-master1:~# kubectl get pod calico-kube-controllers-65c5875bc8-t8m28 -n calico-system  --show-labels
NAME                                       READY   STATUS    RESTARTS      AGE   LABELS
calico-kube-controllers-65c5875bc8-t8m28   1/1     Running   9 (64m ago)   60d   app.kubernetes.io/name=calico-kube-controllers,k8s-app=calico-kube-controllers,pod-template-hash=65c5875bc8

## 3. 查看kube-controllers有没有自动创建svc,可以看到是有的
root@k8s-master1:~# kubectl get svc -n calico-system | grep calico-kube-controllers-metrics
calico-kube-controllers-metrics   ClusterIP   None            <none>        9094/TCP   60d

## 4. 查看svc详细信息
root@k8s-master1:~/kube-prometheus/manifests# kubectl get svc calico-kube-controllers-metrics -n calico-system -o yaml
apiVersion: v1
kind: Service
metadata:
  annotations:
    prometheus.io/port: "9094"
    prometheus.io/scrape: "true"
  creationTimestamp: "2026-04-08T06:59:06Z"
  labels:
    k8s-app: calico-kube-controllers
  name: calico-kube-controllers-metrics
  namespace: calico-system
  ownerReferences:
  - apiVersion: operator.tigera.io/v1
    blockOwnerDeletion: true
    controller: true
    kind: Installation
    name: default
    uid: 1541d167-34fd-4d93-99d2-574abf3eae7e
  resourceVersion: "12791"
  uid: cbe84cf1-7504-4f5c-99b4-988bd5e95dc1
spec:
  clusterIP: None
  clusterIPs:
  - None
  internalTrafficPolicy: Cluster
  ipFamilies:
  - IPv4
  ipFamilyPolicy: SingleStack
  ports:
  - name: metrics-port
    port: 9094
    protocol: TCP
    targetPort: 9094
  selector:
    k8s-app: calico-kube-controllers
  sessionAffinity: None
  type: ClusterIP
status:
  loadBalancer: {}

## 5. 查看kube-controllers有没有自动创建servicemonitor,可以看到没有
root@k8s-master1:~# kubectl get servicemonitor -n monitoring | grep calico
calico-node-metrics       2d22h
由上面的情况,我们得知,kube-controllers已经有了svc但是没有servicemonitor ,所以接下来我们要创建servicemonitor
创建servicemonitor
yaml
root@k8s-master1:~# cd kube-prometheus/manifests/
root@k8s-master1:~/kube-prometheus/manifests# vim calico-kube-controllers-serviceMonitor.yaml
apiVersion: monitoring.coreos.com/v1
kind: ServiceMonitor
metadata:
name: calico-kube-controllers
namespace: monitoring
labels:
app: calico-kube-controllers
spec:
jobLabel: calico-kube-controllers
endpoints:
- interval: 30s
port: metrics-port # 必须和 Service 的 ports.name 完全一致
scheme: http
selector:
matchLabels:
k8s-app: calico-kube-controllers # 必须和 metrics Service 的标签一致
namespaceSelector:
matchNames:
- calico-system
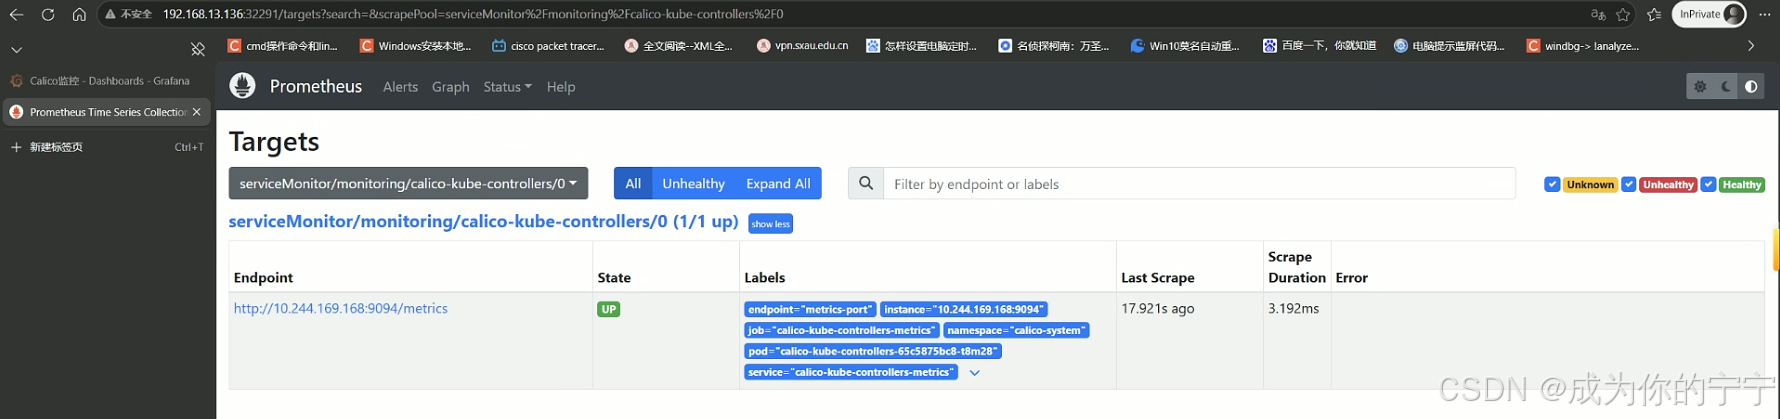
root@k8s-master1:~/kube-prometheus/manifests# kubectl apply -f calico-kube-controllers-serviceMonitor.yaml 浏览器访问Prometheus,可以看到已经监控到kube-controllers实例了
yaml
## 如果没看到实例,可以执行下面这一步试试,或者等一会再查看Prometheus实例
root@k8s-master1:~/kube-prometheus/manifests# kubectl -n monitoring port-forward svc/prometheus-k8s 9090:9090
三、监控ingress-nginx
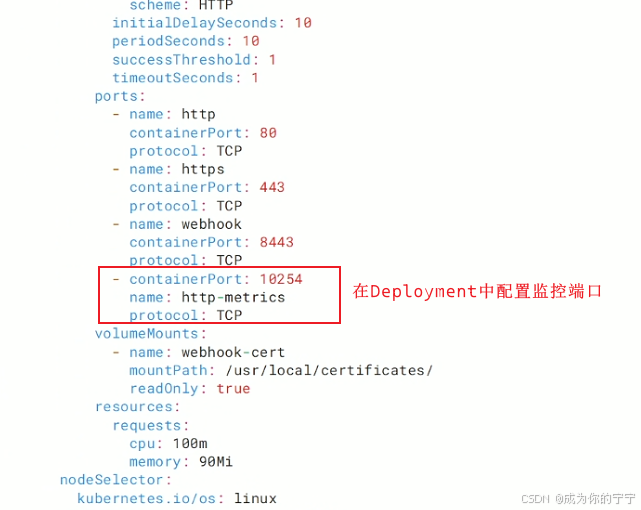
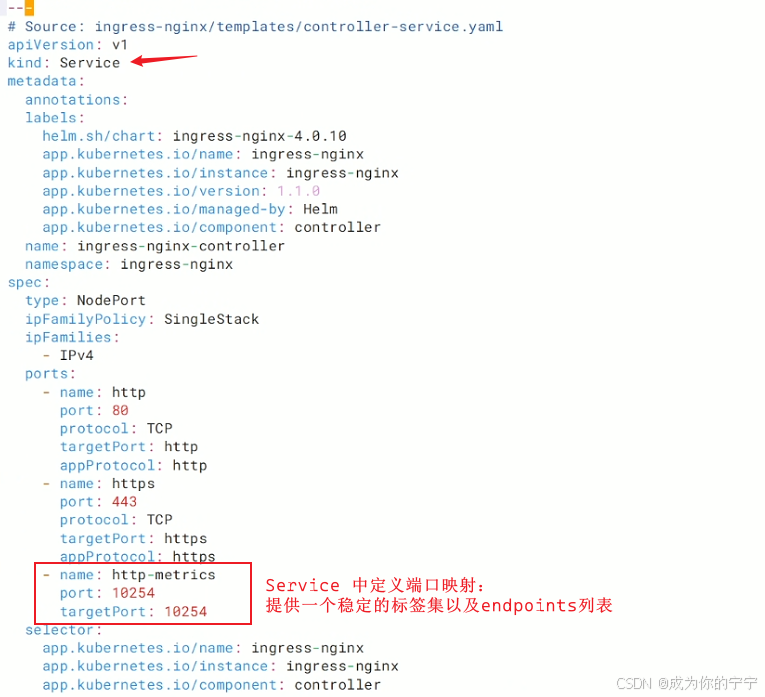
3.1 打开metrics监听及svc映射端口
yaml
root@k8s-master1:~# cd /k8s/ingress-nginx/
root@k8s-master1:/k8s/ingress-nginx# ls
alertmanager-ingress.yaml  grafana-ingress.yaml  ingress-nginx.yaml  prometheus-ingress.yaml
root@k8s-master1:/k8s/ingress-nginx# vim ingress-nginx.yaml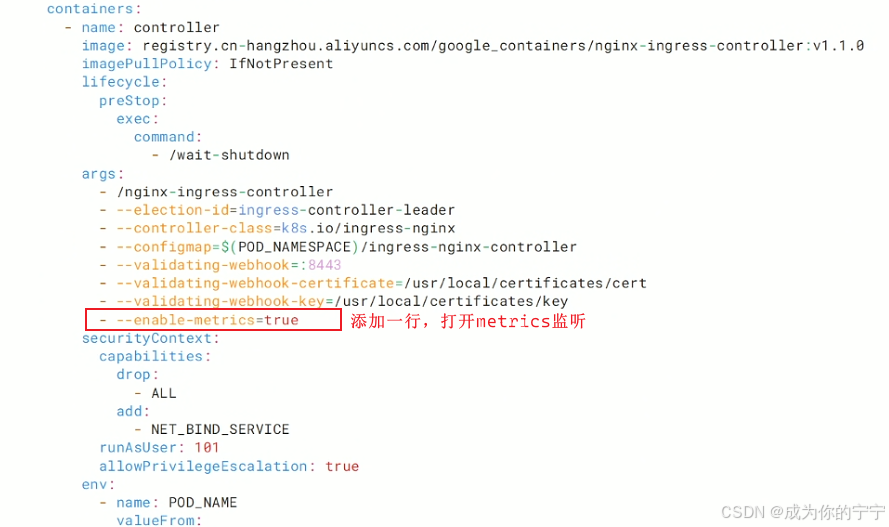
yaml
## 更新ingress-nginx
root@k8s-master1:/k8s/ingress-nginx# kubectl replace -f ingress-nginx.yaml
root@k8s-master1:/k8s/ingress-nginx# curl 192.168.13.139:10254/metrics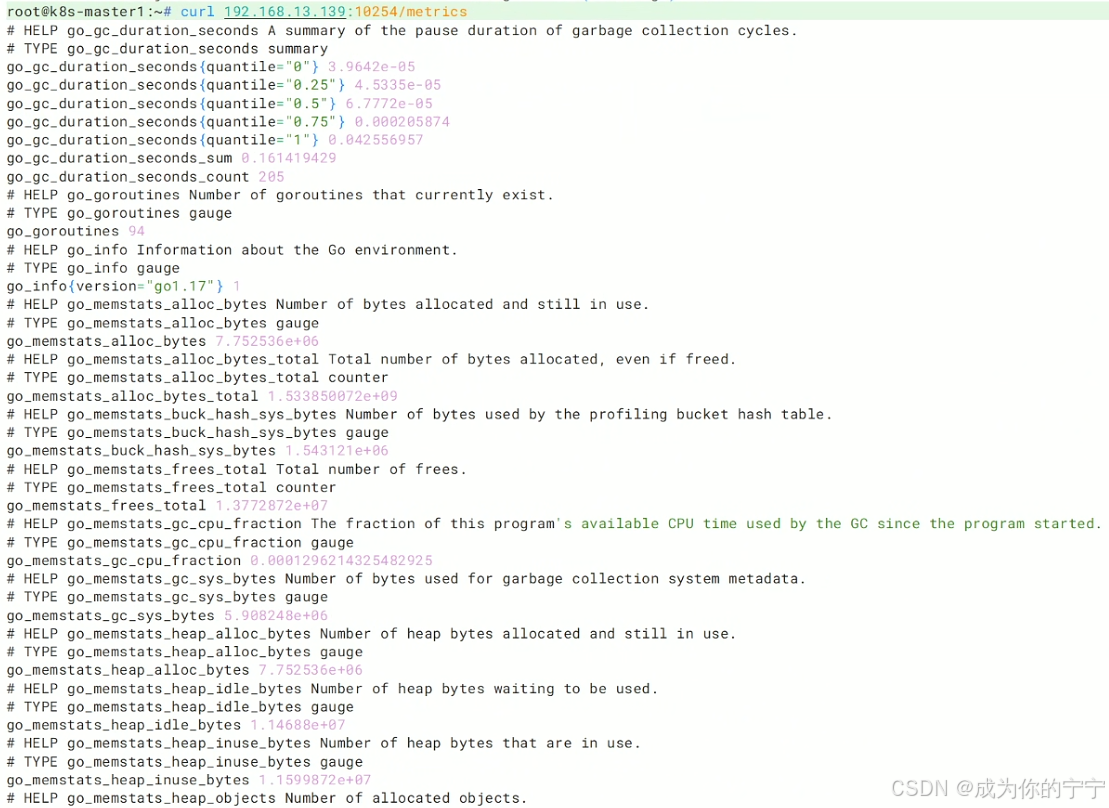
yaml
root@k8s-master1:/k8s/ingress-nginx# kubectl get svc -n ingress-nginx
NAME                                 TYPE        CLUSTER-IP     EXTERNAL-IP   PORT(S)                                      AGE
ingress-nginx-controller             NodePort    10.107.51.27   <none>        80:31303/TCP,443:31299/TCP,10254:31235/TCP   4m12s
ingress-nginx-controller-admission   ClusterIP   10.105.53.5    <none>        443/TCP                                      4m12s
3.2 创建servicemonitor
yaml
root@k8s-master1:~# cd kube-prometheus/manifests/
root@k8s-master1:~/kube-prometheus/manifests# vim ingress-nginx-servicemonitor.yaml
apiVersion: monitoring.coreos.com/v1
kind: ServiceMonitor
metadata:
  name: ingress-nginx-controller
  namespace: monitoring
  labels:
    app: ingress-nginx
spec:
  endpoints:
  - interval: 30s
    port: http-metrics          # 必须与 Service 中的 ports.name 完全一致
    path: /metrics
    scheme: http
  selector:  # 匹配ingress-nginx svc标签
    matchLabels:
      app.kubernetes.io/name: ingress-nginx
      app.kubernetes.io/component: controller
  namespaceSelector:
    matchNames:
    - ingress-nginx   # ingress-nginx svc所在命名空间
浏览器访问Prometheus,可以看到ingress-nginx实例已经被添加
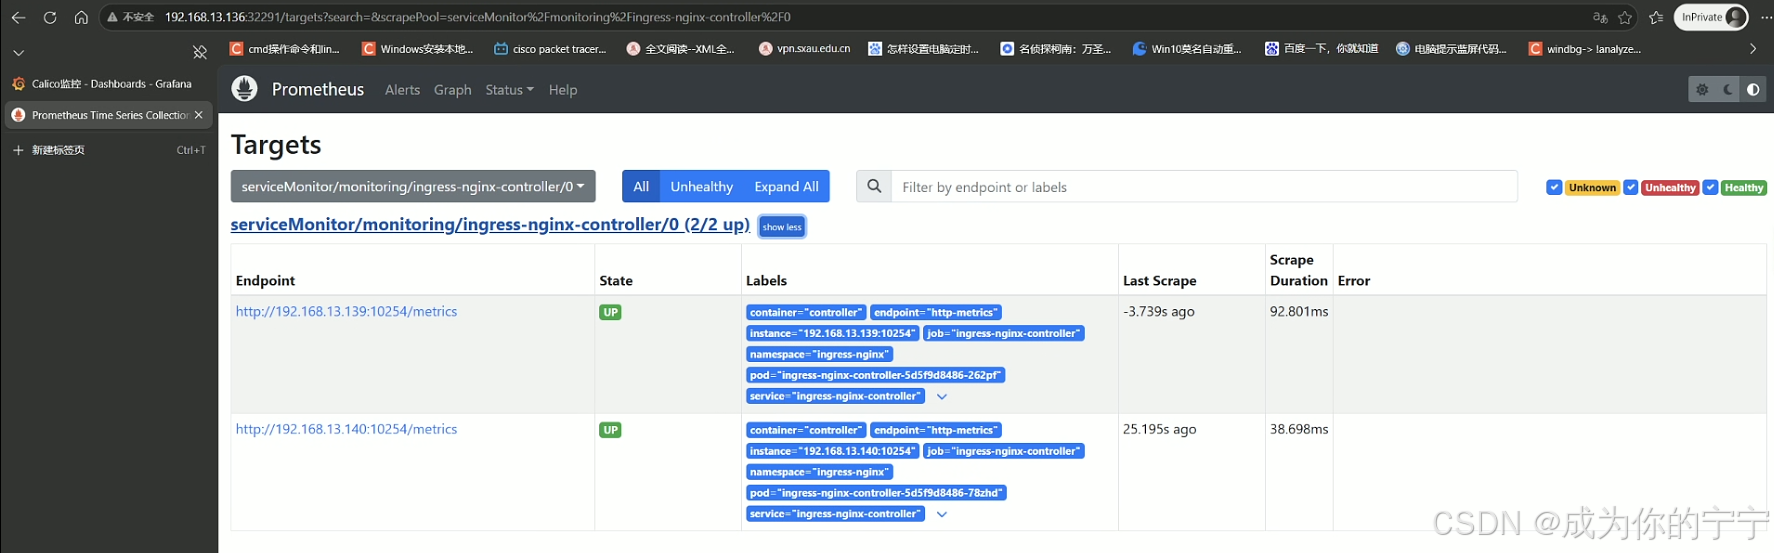
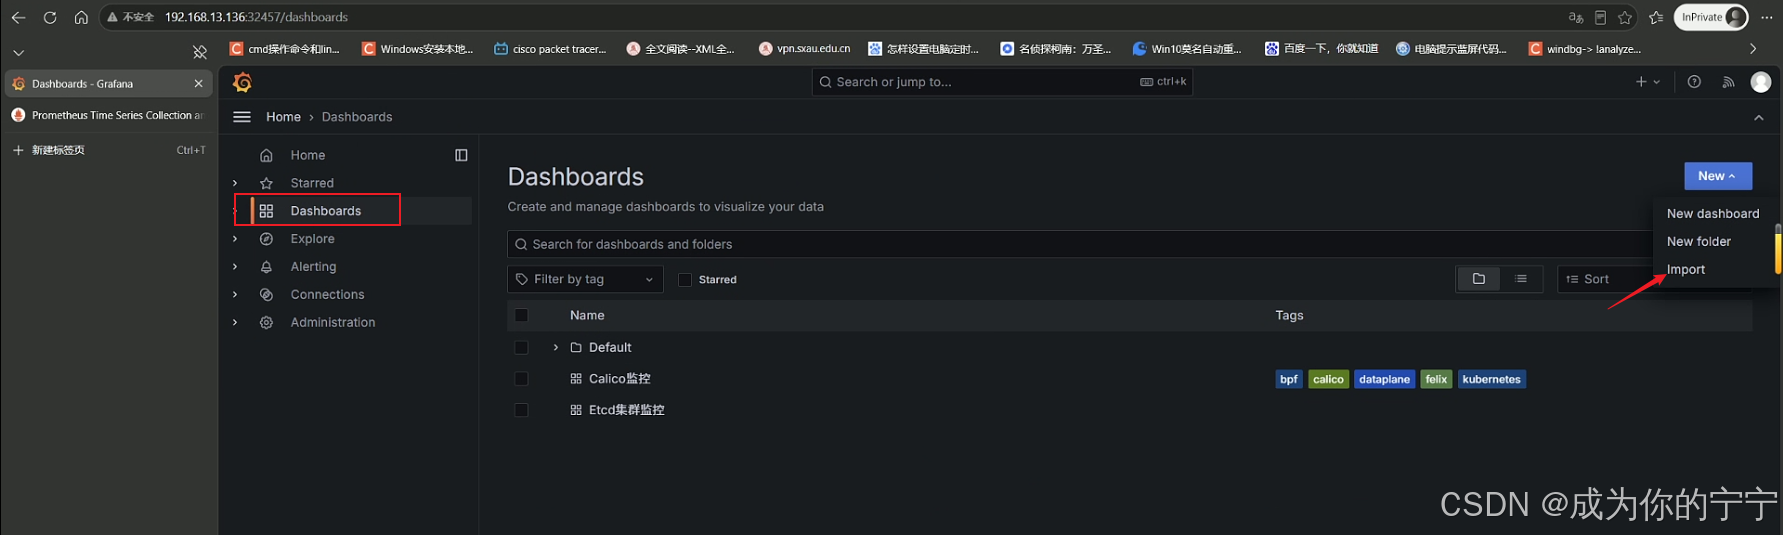
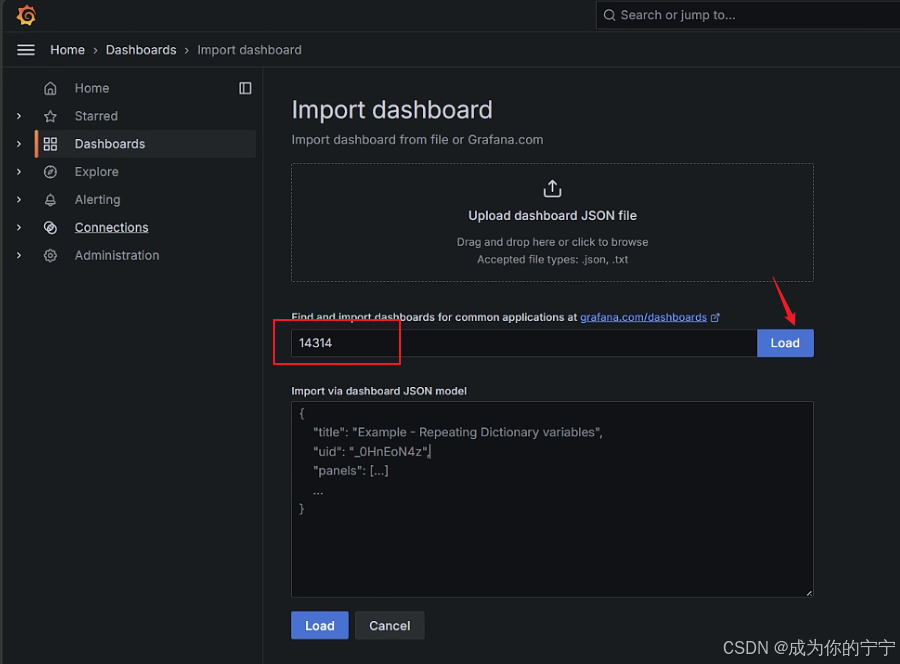
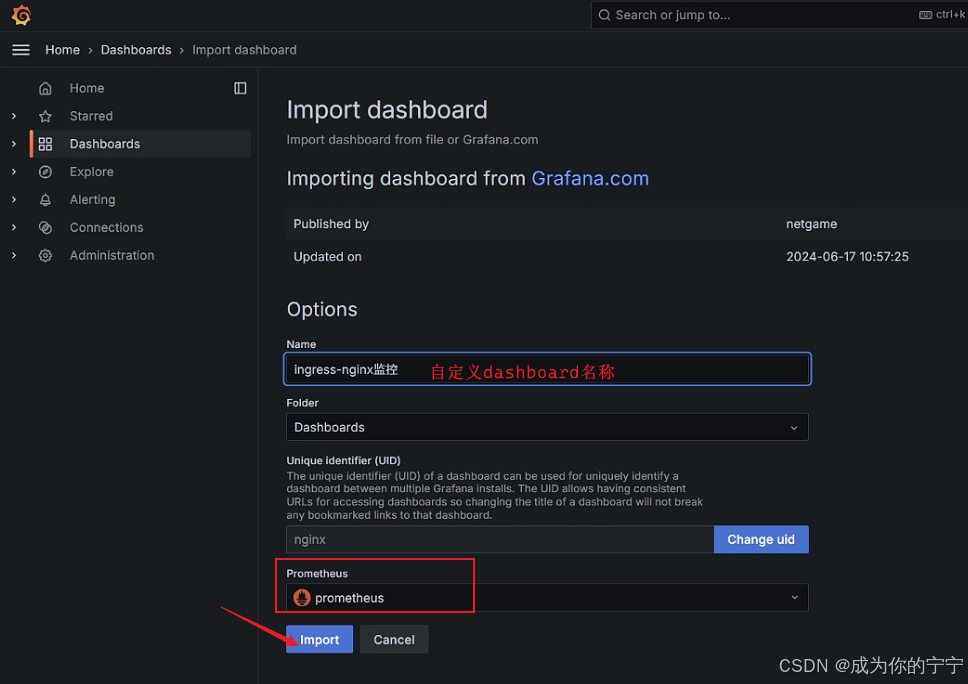
3.3 grafana添加dashboard面板
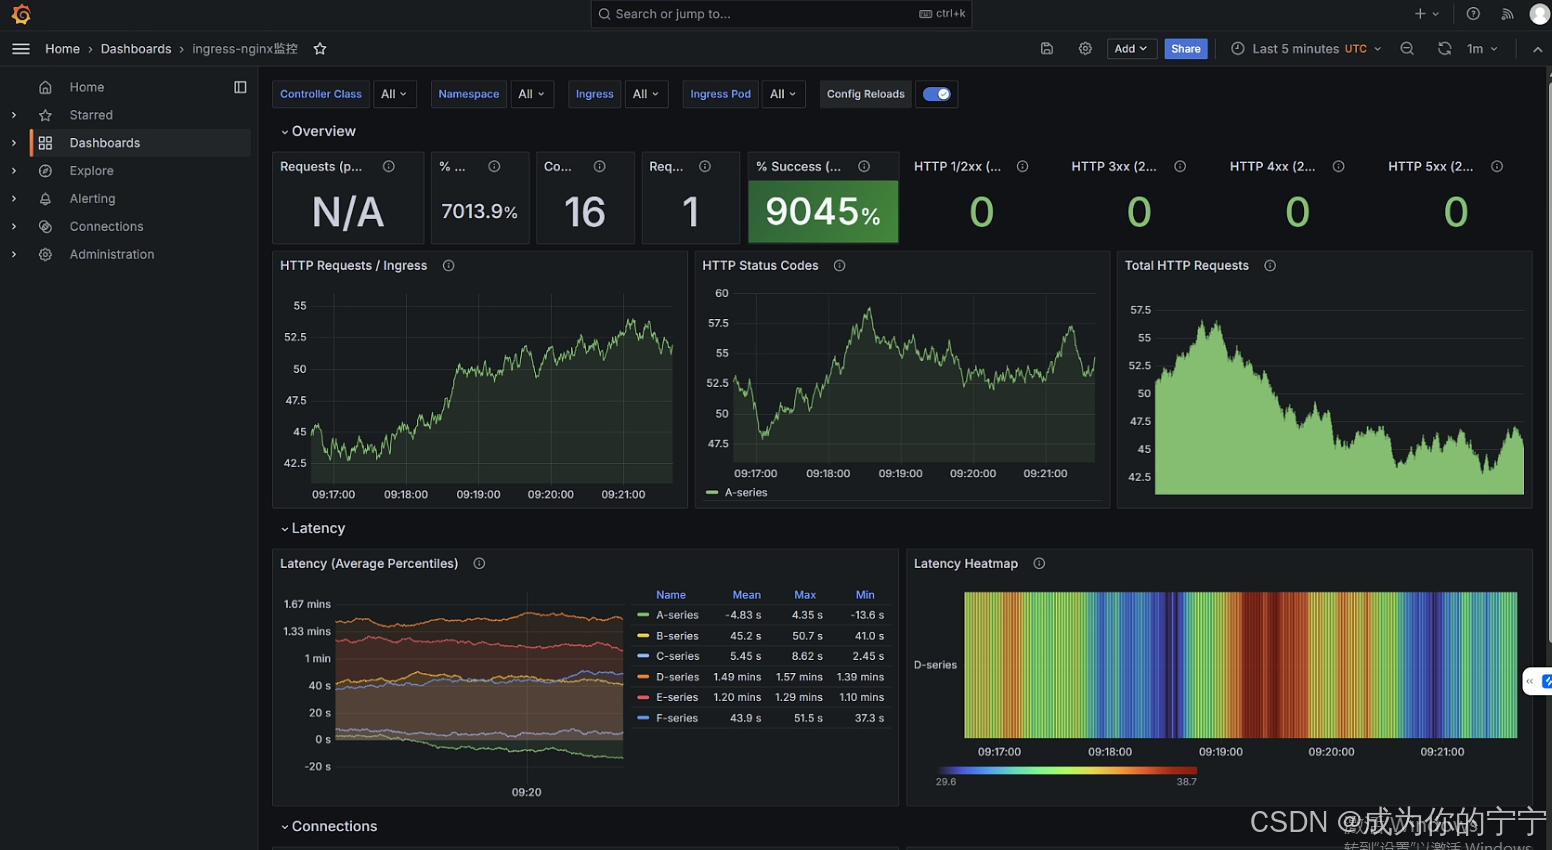
至此,Prometheus Operator监控calico组件及ingress-nginx就完成了!
注:
文中若有疏漏,欢迎大家指正赐教。
本文为100%原创,转载请务必标注原创作者,尊重劳动成果。
求赞、求关注、求评论!你的支持是我更新的最大动力,评论区等你~