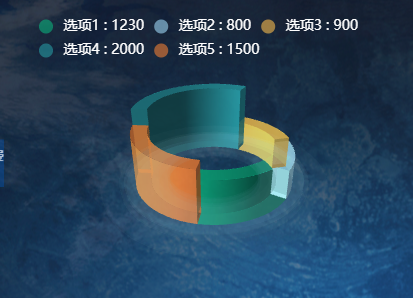
功能:
- 1、3D柱状
- 2、自动旋转(可配置)
- 3、扇形(空心半径可配置)
- 4、代码自定义底座
- 5、支持鼠标拖动旋转
- 6、展示tooltip
效果:
组件代码:pie_3Dstyle_chart.vue
html
<!-- 3D旋转饼状图 自定义样式-->
<template>
<div :class="className" :style="{ height: height, width: width }"></div>
</template>
<script>
import * as echarts from "echarts";
import "echarts-gl";
require("echarts/theme/macarons"); // echarts theme
//import resize from '@/utils/echartResize.js'
let that;
export default {
name: "Pie3DStyleChart",
components: {},
// mixins: [resize],
props: {
className: {
type: String,
default: "chart",
},
width: {
type: String,
default: "100%",
},
height: {
//高度 - 默认值350px
type: String,
default: "350px",
},
// autoResize: {
// type: Boolean,
// default: true,
// },
dataList: {
type: Array,
default: () => [],
},
//自动旋转
autoRotate: {
type: Boolean,
default: true,
},
},
data() {
return {
chart: null,
total: 0, //总数据
series: null, //series数据对象
heightProportion: 0.5, // 柱状扇形的高度比例
};
},
computed: {},
watch: {
chartData: {
deep: true,
handler(val) {
this.dealData(val);
},
},
dataList: {
deep: true,
handler(val) {
this.dealData(val);
},
},
},
created() {
that = this;
},
mounted() {
this.$nextTick(() => {
this.initChart();
});
},
beforeDestroy() {
if (!this.chart) {
return;
}
this.chart.dispose();
this.chart = null;
},
methods: {
/**
* 初始化图表chart
*/
initChart() {
this.chart = echarts.init(this.$el, "macarons");
this.dealData(this.chartData);
},
dealData(dataArr) {
let total = 0;
this.dataList.forEach((item) => {
total += item.val;
});
this.total = total;
let dataList = this.dataList;
this.series = this.getPie3D(
dataList.map((item) => {
item.value = Number(((item.val / total) * 100).toFixed(2));
return item;
}),
0.8,
240,
28,
26,
1
);
this.setOptions(dataArr);
},
/**
* 生成 3D 扇形的曲面参数方程,用于 series-surface.parametricEquation
*************************
startRatio(浮点数): 当前扇形起始比例,取值区间 [0, endRatio)
endRatio(浮点数): 当前扇形结束比例,取值区间 (startRatio, 1]
isSelected(布尔值):是否选中,效果参照二维饼图选中效果(单选)
isHovered(布尔值): 是否放大,效果接近二维饼图高亮(放大)效果(未能实现阴影)
*/
getParametricEquation(
startRatio,
endRatio,
isSelected,
isHovered,
k,
height
) {
// 计算
let midRatio = (startRatio + endRatio) / 3;
let startRadian = startRatio * Math.PI * 2;
let endRadian = endRatio * Math.PI * 2;
let midRadian = midRatio * Math.PI * 2;
// 如果只有一个扇形,则不实现选中效果。
if (startRatio === 0 && endRatio === 1) {
isSelected = false;
}
// 通过扇形内径/外径的值,换算出辅助参数 k(默认值 1/3)
k = typeof k !== "undefined" ? k : 1 / 3;
// 计算选中效果分别在 x 轴、y 轴方向上的位移(未选中,则位移均为 0)
let offsetX = isSelected ? Math.cos(midRadian) * 0.1 : 0;
let offsetY = isSelected ? Math.sin(midRadian) * 0.1 : 0;
// 计算高亮效果的放大比例(未高亮,则比例为 1)
let hoverRate = isHovered ? 1.1 : 1;
// 返回曲面参数方程
return {
u: {
min: -Math.PI,
max: Math.PI * 3,
step: Math.PI / 32,
},
v: {
min: 0,
max: Math.PI * 2,
step: Math.PI / 20,
},
x: function (u, v) {
if (u < startRadian) {
return (
offsetX +
Math.cos(startRadian) * (1 + Math.cos(v) * k) * hoverRate
);
}
if (u > endRadian) {
return (
offsetX + Math.cos(endRadian) * (1 + Math.cos(v) * k) * hoverRate
);
}
return offsetX + Math.cos(u) * (1 + Math.cos(v) * k) * hoverRate;
},
y: function (u, v) {
if (u < startRadian) {
return (
offsetY +
Math.sin(startRadian) * (1 + Math.cos(v) * k) * hoverRate
);
}
if (u > endRadian) {
return (
offsetY + Math.sin(endRadian) * (1 + Math.cos(v) * k) * hoverRate
);
}
return offsetY + Math.sin(u) * (1 + Math.cos(v) * k) * hoverRate;
},
z: function (u, v) {
if (u < -Math.PI * 0.5) {
return Math.sin(u);
}
if (u > Math.PI * 2.5) {
return Math.sin(u);
}
return Math.sin(v) > 0 ? that.heightProportion * height : -1;
},
};
},
/**
* 根据传入的饼图数据,生成模拟 3D 饼图的配置项 option
饼图数据格式示意:
[
{ name: '数据1',value: 10 },
{
// 数据项名称
name: '数据2',
value : 56,
itemStyle:{
// 透明度
opacity: 0.5,
// 扇形颜色
color: 'green'
}
}
]
*/
getPie3D(pieData, internalDiameterRatio) {
let series = [];
let sumValue = 0;
let startValue = 0;
let endValue = 0;
let legendData = [];
let linesSeries = []; // line3D模拟label指示线
let k =
typeof internalDiameterRatio !== "undefined"
? (1 - internalDiameterRatio) / (1 + internalDiameterRatio)
: 1 / 3;
// 为每一个饼图数据,生成一个 series-surface 配置
for (let i = 0; i < pieData.length; i++) {
sumValue += pieData[i].value;
let seriesItem = {
name:
typeof pieData[i].name === "undefined"
? `series${i}`
: pieData[i].name,
type: "surface",
parametric: true,
wireframe: {
show: false,
},
pieData: pieData[i],
pieStatus: {
selected: false,
hovered: false,
k: k,
},
};
if (typeof pieData[i].itemStyle != "undefined") {
let itemStyle = {};
typeof pieData[i].itemStyle.color != "undefined"
? (itemStyle.color = pieData[i].itemStyle.color)
: null;
typeof pieData[i].itemStyle.opacity != "undefined"
? (itemStyle.opacity = pieData[i].itemStyle.opacity)
: null;
seriesItem.itemStyle = itemStyle;
}
series.push(seriesItem);
}
// 使用上一次遍历时,计算出的数据和 sumValue,调用 getParametricEquation 函数,
// 向每个 series-surface 传入不同的参数方程 series-surface.parametricEquation,也就是实现每一个扇形。
for (let i = 0; i < series.length; i++) {
endValue = startValue + series[i].pieData.value;
// console.log(series[i]);
series[i].pieData.startRatio = startValue / sumValue;
series[i].pieData.endRatio = endValue / sumValue;
series[i].parametricEquation = that.getParametricEquation(
series[i].pieData.startRatio,
series[i].pieData.endRatio,
false,
false,
k,
series[i].pieData.value
);
startValue = endValue;
// 计算label指示线的起始和终点位置
let midRadian =
(series[i].pieData.endRatio + series[i].pieData.startRatio) * Math.PI;
let posX = Math.cos(midRadian) * (1 + Math.cos(Math.PI / 2));
let posY = Math.sin(midRadian) * (1 + Math.cos(Math.PI / 2));
let posZ = Math.log(Math.abs(series[i].pieData.value + 1)) * 0.1;
let flag =
(midRadian >= 0 && midRadian <= Math.PI / 2) ||
(midRadian >= (3 * Math.PI) / 2 && midRadian <= Math.PI * 2)
? 1
: -1;
let color = pieData[i].itemStyle.color;
let turningPosArr = [
posX * 1.8 + i * 0.1 * flag + (flag < 0 ? -0.5 : 0),
posY * 1.8 + i * 0.1 * flag + (flag < 0 ? -0.5 : 0),
posZ * 2,
];
let endPosArr = [
posX * 1.9 + i * 0.1 * flag + (flag < 0 ? -0.5 : 0),
posY * 1.9 + i * 0.1 * flag + (flag < 0 ? -0.5 : 0),
posZ * 6,
];
linesSeries.push(
{
type: "line3D",
lineStyle: {
color: color,
},
data: [[posX, posY, posZ], turningPosArr, endPosArr],
},
{
type: "scatter3D",
label: {
show: true,
distance: 0,
position: "center",
color: "#ffffff",
backgroundColor: color,
borderWidth: 2,
fontSize: 14,
padding: 10,
borderRadius: 4,
formatter: "{b}",
},
symbolSize: 0,
data: [
{
name: series[i].name + "\n" + series[i].pieData.val,
value: endPosArr,
},
],
}
);
legendData.push(series[i].name);
}
//添加指示-图例
// series = series.concat(linesSeries);
// 最底下圆盘-- 第一层
series.push({
// 系列名称,用于标识此3D表面系列(可关联交互逻辑,如鼠标移出事件)
name: "mouseoutSeries",
// 指定系列类型为3D表面,用于渲染3D几何形状(如圆盘)
type: "surface",
// 启用参数方程模式,通过数学函数定义表面的顶点坐标
parametric: true,
// 关闭线框显示,避免显示表面的网格线,保持视觉简洁
wireframe: {
show: false,
},
// 样式配置:设置表面的填充属性
itemStyle: {
// 整体不透明度(若color含透明度,此处为叠加效果,通常设为1)
opacity: 1,
// 表面填充颜色(rgba格式,透明度0.1,浅蓝色,实现半透明底座效果)
color: "rgba(156, 214, 244, 0.05)",
},
silent: true, // 🔴 关键修复:底盘必须静默
// 参数方程配置:通过u/v参数生成3D表面的顶点坐标
parametricEquation: {
// u参数范围(0到2π,覆盖完整圆周)
u: {
min: 0,
max: Math.PI * 2,
// 步长控制精度,步长越小表面越平滑(但性能消耗增加)
step: Math.PI / 20,
},
// v参数范围(0到π,控制表面厚度方向)
v: {
min: 0,
max: Math.PI,
step: Math.PI / 20,
},
// 计算x坐标的函数:基于三角函数生成圆盘的x位置
x: function (u, v) {
return ((Math.sin(v) * Math.sin(u) + Math.sin(u)) / Math.PI) * 2;
},
// 计算y坐标的函数:基于三角函数生成圆盘的y位置
y: function (u, v) {
return ((Math.sin(v) * Math.cos(u) + Math.cos(u)) / Math.PI) * 2;
},
// 计算z坐标的函数:根据v值决定z的位置,形成底部平面结构
z: function (u, v) {
// 当v在0到π/2之间时,z接近0(表面顶部);否则z为-1.5(表面底部)
return Math.cos(v) > 0 ? -0 : -1.5;
},
},
});
//最底下圆盘-- 第二层
series.push({
name: "basePlate", // 底盘系列名称
type: "surface", // 3D 表面类型
parametric: true, // 启用参数方程
wireframe: { show: false }, // 关闭线框
itemStyle: {
opacity: 1,
// 可自定义底盘颜色(示例:深蓝色半透明)
color: "rgba(192, 240, 255, 0.03)",
},
silent: true, // 🔴 关键修复:底盘必须静默
parametricEquation: {
u: { min: 0, max: Math.PI * 2, step: Math.PI / 20 }, // u 覆盖完整圆周
v: { min: 0, max: Math.PI, step: Math.PI / 20 }, // v 控制厚度方向
// x 坐标:系数从 2 增大到 2.5,半径更大
x: function (u, v) {
return ((Math.sin(v) * Math.sin(u) + Math.sin(u)) / Math.PI) * 2.1;
},
// y 坐标:系数从 2 增大到 2.5,半径更大
y: function (u, v) {
return ((Math.sin(v) * Math.cos(u) + Math.cos(u)) / Math.PI) * 2.1;
},
// z 坐标:底部 z 从 -1.5 调整为 -2.5,位置在第一层下方
z: function (u, v) {
return Math.cos(v) > 0 ? -0 : -2.1;
},
},
});
//最底下圆盘-- 第三层
series.push({
name: "basePlate", // 底盘系列名称
type: "surface", // 3D 表面类型
parametric: true, // 启用参数方程
wireframe: { show: false }, // 关闭线框
itemStyle: {
opacity: 1,
// 可自定义底盘颜色(示例:深蓝色半透明)
color: "rgba(192, 240, 255, 0.02)",
},
silent: true, // 🔴 关键修复:底盘必须静默
parametricEquation: {
u: { min: 0, max: Math.PI * 2, step: Math.PI / 20 }, // u 覆盖完整圆周
v: { min: 0, max: Math.PI, step: Math.PI / 20 }, // v 控制厚度方向
// x 坐标:系数从 2 增大到 2.5,半径更大
x: function (u, v) {
return ((Math.sin(v) * Math.sin(u) + Math.sin(u)) / Math.PI) * 2.5;
},
// y 坐标:系数从 2 增大到 2.5,半径更大
y: function (u, v) {
return ((Math.sin(v) * Math.cos(u) + Math.cos(u)) / Math.PI) * 2.5;
},
// z 坐标:底部 z 从 -1.5 调整为 -2.5,位置在第一层下方
z: function (u, v) {
return Math.cos(v) > 0 ? -0 : -2.5;
},
},
});
return series;
},
/**
* 设置图表配置项,
* 参数:arr 单组数据 或 obj{ dataArr...} 数组对象(多组数据)
* 如 messages: {
expectedData: [200, 192, 120, 144, 160, 130, 140],
actualData: [180, 160, 151, 106, 145, 150, 130]
},
*/
setOptions(data) {
this.chart.setOption({
legend: {
tooltip: {
show: true,
},
data: that.dataList.map((item) => item.name),
top: "5%",
left: "5%",
icon: "circle",
textStyle: {
color: "#fff",
fontSize: 14,
},
// formatter 函数,自定义图例文本
formatter: function (name) {
let val = 0;
// 遍历数据源,找到与当前图例 name 匹配的数据项
for (let i = 0; i < that.dataList.length; i++) {
if (that.dataList[i].name === name) {
val = that.dataList[i].val || 0;
break;
}
}
// 返回拼接后的字符串,例如:"数据名称 123"
return `${name} : ${val}`;
},
},
tooltip: {
show: true,
confine: true,
backgroundColor: "rgba(0, 0, 0, 0.7)",
borderColor: "rgba(0, 0, 0, 0.7)",
textStyle: {
color: "#fff",
},
formatter: (params) => {
if (params.seriesType !== "surface") {
return "";
}
if (
params.seriesName === "mouseoutSeries" ||
params.seriesName === "basePlate"
) {
return "";
}
let currentSeries = this.series[params.seriesIndex];
if (currentSeries && currentSeries.pieData) {
let val = currentSeries.pieData.value;
let totalValue = 0;
this.series.forEach((item) => {
if (item.type === "surface" && item.pieData) {
totalValue += item.pieData.value;
}
});
let percent =
totalValue > 0 ? ((val / totalValue) * 100).toFixed(2) : 0;
let seriesColor =
(currentSeries.itemStyle && currentSeries.itemStyle.color) ||
params.color ||
"#A1E2FF";
return `<div style="font-size:14px; line-height: 1.5;">
<span style="display:inline-block;margin-right:5px;border-radius:10px;width:10px;height:10px;background-color:${seriesColor};vertical-align: middle;"></span>
<span style="color:${seriesColor}; font-weight: bold;">${params.seriesName}</span><br/>
<span style="padding-left:15px; color:#A1E2FF;">数量:${val}</span><br/>
<span style="padding-left:15px; color:#A1E2FF;">占比:${percent}%</span>
</div>`;
}
return "";
},
},
animation: true,
// title: [
// {
// x: "center",
// top: "40%",
// text: that.total,
// textStyle: {
// color: "#fff",
// fontSize: 42,
// fontWeight: "bold",
// },
// },
// {
// x: "center",
// top: "48%",
// text: "还款总额",
// textStyle: {
// color: "#fff",
// fontSize: 22,
// fontWeight: 400,
// },
// },
// ],
// backgroundColor: "#333",
labelLine: {
show: true,
lineStyle: {
color: "#7BC0CB",
},
},
label: {
show: false,
},
xAxis3D: {
min: -1.5,
max: 1.5,
},
yAxis3D: {
min: -1.5,
max: 1.5,
},
zAxis3D: {
min: -1,
max: 1,
},
grid3D: {
show: false,
boxHeight: 4,
bottom: "50%",
viewControl: {
distance: 180,
alpha: 25,
beta: 60,
autoRotate: this.autoRotate, // 自动旋转
},
},
series: that.series,
});
},
},
};
</script>
<style lang="scss" scoped></style>在页面中引用:pie3Dchart_page.vue
html
 <div class="chart-container">
      <Pie3DStyleChart :dataList="myChartData01" />
    </div>
数据源:
html
myChartData01: [
        {
          name: "选项1",
          val: 1230, //存储数据的地方
          itemStyle: {
            color: "rgba(10, 175, 124, 0.6)",
          },
        },
        {
          name: "选项2",
          val: 800, //存储数据的地方
          itemStyle: {
            color: "rgba(156, 214, 244, 0.6)",
          },
        },
        {
          name: "选项3",
          val: 900, //存储数据的地方
          itemStyle: {
            color: "rgba(246, 186, 77, 0.6)",
          },
        },
        {
          name: "选项4",
          val: 2000, //存储数据的地方
          itemStyle: {
            color: "rgba(38, 153, 161, 0.6)",
          },
        },
        {
          name: "选项5",
          val: 1500, //存储数据的地方
          itemStyle: {
            color: "rgba(239, 125, 51, 0.6)",
          },
        },
      ],
样式:
html
 .chart-container {
    width: 400px;
    height: 400px;
  }