文章目录
1.算法原理
在 YUV 空间中,色调旋转对应 UV 平面上的向量旋转,饱和度控制对应 UV 向量长度缩放。距离越远,颜色越鲜艳(纯度高);距离越近,颜色越暗淡. 为什么是这样的? 下面是RGB和YUV的转换公式,
R ≈ Y + 1.402 * (V - 128)
B ≈ Y + 1.772 * (U - 128)
G ≈ Y - 0.344 * (U - 128) - 0.714 * (V - 128)- 当U和V都是128时,图片是没有颜色的,因为RGB各分量是相等的
- 当UV相量长度缩放或拉伸,会改变UV分量.如下面的saturation 是饱和度系数,当饱和度系数拉伸时,对用U_out和V_out会变大,根据上面的RGB计算公式,能看到R,G,B分量变大,图像变得更鲜艳.
U_out = saturation × (U-128) / 256 + 128
V_out = saturation × (V-128) / 256 + 128
关键数学公式
色调旋转(UV 平面旋转 hue 角度):
下面其实是先把UV坐标移动到UV平面的中心,因为UV平面的中心是(128,128),所以下面要减去128,然后坐标就是新坐标系的坐标, 紧接着旋转矩阵乘以新坐标系点的坐标,即得到旋转后的坐标,最后在加128,还原到旧的坐标系.
U' = (U-128)×cos(hue) + (V-128)×sin(hue) + 128
V' = (V-128)×cos(hue) - (U-128)×sin(hue) + 128
饱和度缩放:
U_out = saturation × (U-128) / 256 + 128
V_out = saturation × (V-128) / 256 + 128
saturation = 256 → 无变化;> 256 → 饱和度增加;< 256 → 饱和度降低
2.代码实现
代码实现细节
- 使用预计算的 sin/cos LUT(整数,×256 精度)
- 输入图像为 UV 两通道(shape: H×W×2)
- 注意:代码中色调旋转结果被饱和度计算覆盖,实际只执行了饱和度调整
关键参数
| 参数 | 说明 | 典型值 |
|---|---|---|
hue |
色调旋转角度(0~359 度) | 128 |
saturation |
饱和度缩放(256 = 原值) | 256 |
clip |
输出 clip | 255 |
源代码
这里源代码中有一处错误,就是在旋转后,由于之前是使用定点格式,所以坐标转换之后要对像素值/256
另外增加了一个返回值, 即同时返回旋转和饱和度拉伸的效果.
python
class HSC:
    'Hue Saturation Control'

    def __init__(self, img, hue, saturation, clip):
        self.img = img
        #self.hue = hue % 360
        self.hue = hue
        self.saturation = saturation
        self.clip = clip

    def clipping(self):
        np.clip(self.img, 0, self.clip, out=self.img)
        return self.img

    def lut(self):
        ind = np.array([i for i in range(360)])
        sin = np.sin(ind * np.pi / 180) * 256
        cos = np.cos(ind * np.pi / 180) * 256
        lut_sin = dict(zip(ind, [round(sin[i]) for i in ind]))
        lut_cos = dict(zip(ind, [round(cos[i]) for i in ind]))
        return lut_sin, lut_cos

    def execute(self):
        lut_sin, lut_cos = self.lut()
        img_h = self.img.shape[0]
        img_w = self.img.shape[1]
        img_c = self.img.shape[2]
        hsc_img = np.empty((img_h, img_w, img_c), np.int16)
        # 对图像的uv做旋转
        hsc_img[:,:,0] = ((self.img[:,:,0] - 128) * lut_cos[self.hue] + (self.img[:,:,1] - 128) * lut_sin[self.hue]) / 256 + 128
        hsc_img[:,:,1] = ((self.img[:,:,1] - 128) * lut_cos[self.hue] - (self.img[:,:,0] - 128) * lut_sin[self.hue]) / 256 + 128
		#保存旋转后的图像
        hue_only_img = np.empty_like(self.img)
        hue_only_img[:, :, 0] =  hsc_img[:,:,0]
        hue_only_img[:, :, 1] =  hsc_img[:,:,1]
		#对原图做饱和度拉伸
        hsc_img[:,:,0] = self.saturation * (self.img[:,:,0] - 128) / 256 + 128
        hsc_img[:,:,1] = self.saturation * (self.img[:,:,1] - 128) / 256 + 128
        self.img = hsc_img

        return hue_only_img, self.clipping()
3.测试代码
测试代码先生成一个uv渐变的图像,然后基于此图像,分别做旋转45度
python
    def yuv_to_rgb_display(self, uv_array):
        """
        将 2通道的 YUV (U, V) 数据转换为 3通道的 RGB 数据,以便 matplotlib 显示。
        这里假设亮度 Y = 128 (中性灰),仅可视化色度信息。
        """
        # 确保数据在 0-255 范围内
        uv = np.clip(uv_array, 0, 255).astype(np.float32)
        u = uv[:, :, 0]
        v = uv[:, :, 1]

        # 创建全 128 的 Y 通道
        y = np.full_like(u, 128.0)

        # YUV 转 RGB 公式 (BT.601 标准)
        r = y + 1.402 * (v - 128)
        g = y - 0.344136 * (u - 128) - 0.714136 * (v - 128)
        b = y + 1.772 * (u - 128)

        # 合并为 (H, W, 3) 的 RGB 图像,并归一化到 [0, 1] 供 matplotlib 显示
        rgb = np.stack([r, g, b], axis=-1)
        return np.clip(rgb, 0, 255) / 255.0

    def test_hsc_visual(self):
        """
        可视化测试 HSC 算法,左右对比显示优化前后的图像效果。
        """
        # 1. 构造一张用于测试的 YUV 色彩渐变图 (高度100,宽度400)
        h, w = 200, 200
        uv = np.zeros((h, w, 2), dtype=np.int16)
        # U 通道水平渐变 (0 -> 255)
        uv[:, :, 0] = np.linspace(0, 255, w, dtype=np.int16)
        # V 通道垂直渐变 (0 -> 255)
        uv[:, :, 1] = np.linspace(0, 255, h, dtype=np.int16).reshape(-1, 1)

        # 2. 使用算法处理图像 (修改 hue=45 以明显看出旋转效果,饱和度增强1.5倍)
        hsc_processor = HSC(img=uv.copy(), hue=45, saturation=384, clip=255)
        rotate_uv, processed_uv = hsc_processor.execute()

        # 3. 将 YUV 转换为 RGB 以便显示
        original_rgb = self.yuv_to_rgb_display(uv)
        processed_rotate_rgb = self.yuv_to_rgb_display(rotate_uv)
        processed_rgb = self.yuv_to_rgb_display(processed_uv)

        # 4. 左右对比显示
        fig, axes = plt.subplots(1, 3, figsize=(12, 4))

        # 左图:原图
        axes[0].imshow(original_rgb)
        axes[0].set_title("Original UV Image", fontsize=12)
        axes[0].axis('off')

        # 中图:仅色相旋转后的图像 (修复了原代码变量名错误)
        axes[1].imshow(processed_rotate_rgb)
        axes[1].set_title("Hue Rotated (45°)", fontsize=12)
        axes[1].axis('off')

        # 右图:色相旋转 + 饱和度增强后的图像
        axes[2].imshow(processed_rgb)
        axes[2].set_title("Sat x1.5", fontsize=12)
        axes[2].axis('off')

        plt.tight_layout()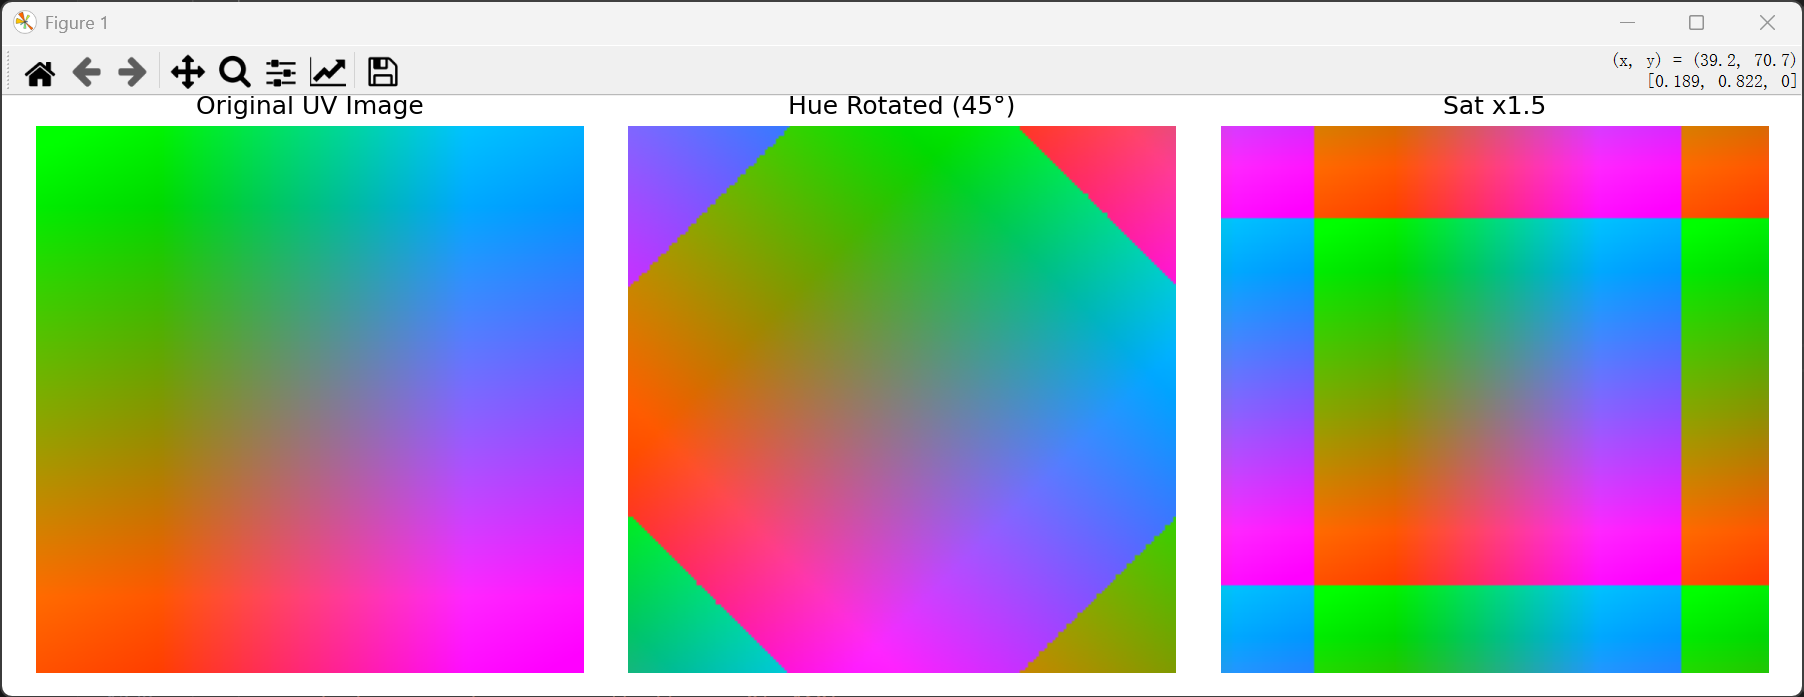
plt.show()- 测试效果图
中间是旋转45度的效果,
为什么最右边会出现这种"方块"?
这里我们的原图是 UV 平面的线性渐变图(U 和 V 分别从 0 到 255)。
中心点 (128, 128):这是中性灰点(无色)。无论怎么拉伸,这里都是 0,所以中心颜色不变。
边缘区域:原本 U 或 V 的值已经接近 0 或 255。当你将饱和度乘以 1.5 时:
如果原值是 200(乘以 1.5 后变成 300)。因为数值不能超过 255(也不能小于 0),所有超过 255 的值都会被强制设为 255。这就导致了图像中原本平滑渐变的边缘部分,因为数值"撞墙"了,变成了一大片纯色的区域。由于原图是矩形渐变的,所以截断后的区域呈现出矩形的块状。