Levenberg-Marquardt(LM)算法
四种优化方法对比总结表(先看这个)
方法 收敛速度 稳定性 Hessian 计算 内存开销 对初值敏感性 典型适用场景 最速下降法 ❌ 慢(线性) ✅ 很稳定 ❌ 不需要 ✅ 极小 ✅ 不敏感 简单问题、调试 牛顿法 ✅✅ 极快(二次) ❌ 不稳定 ✅ 需要完整 Hessian ❌ 大 ❌ 非常敏感 光滑凸问题、小规模 高斯--牛顿法 ✅ 快(近似二次) ⚠️ 一般 ❌ 只用 Jacobian ✅ 较小 ❌ 较敏感 非线性最小二乘 LM 算法 ✅ 快 + 稳 ✅✅ 很稳定 ❌ 只用 Jacobian ✅ 较小 ✅ 较鲁棒 非线性拟合、SLAM、BA
📋 项目简介
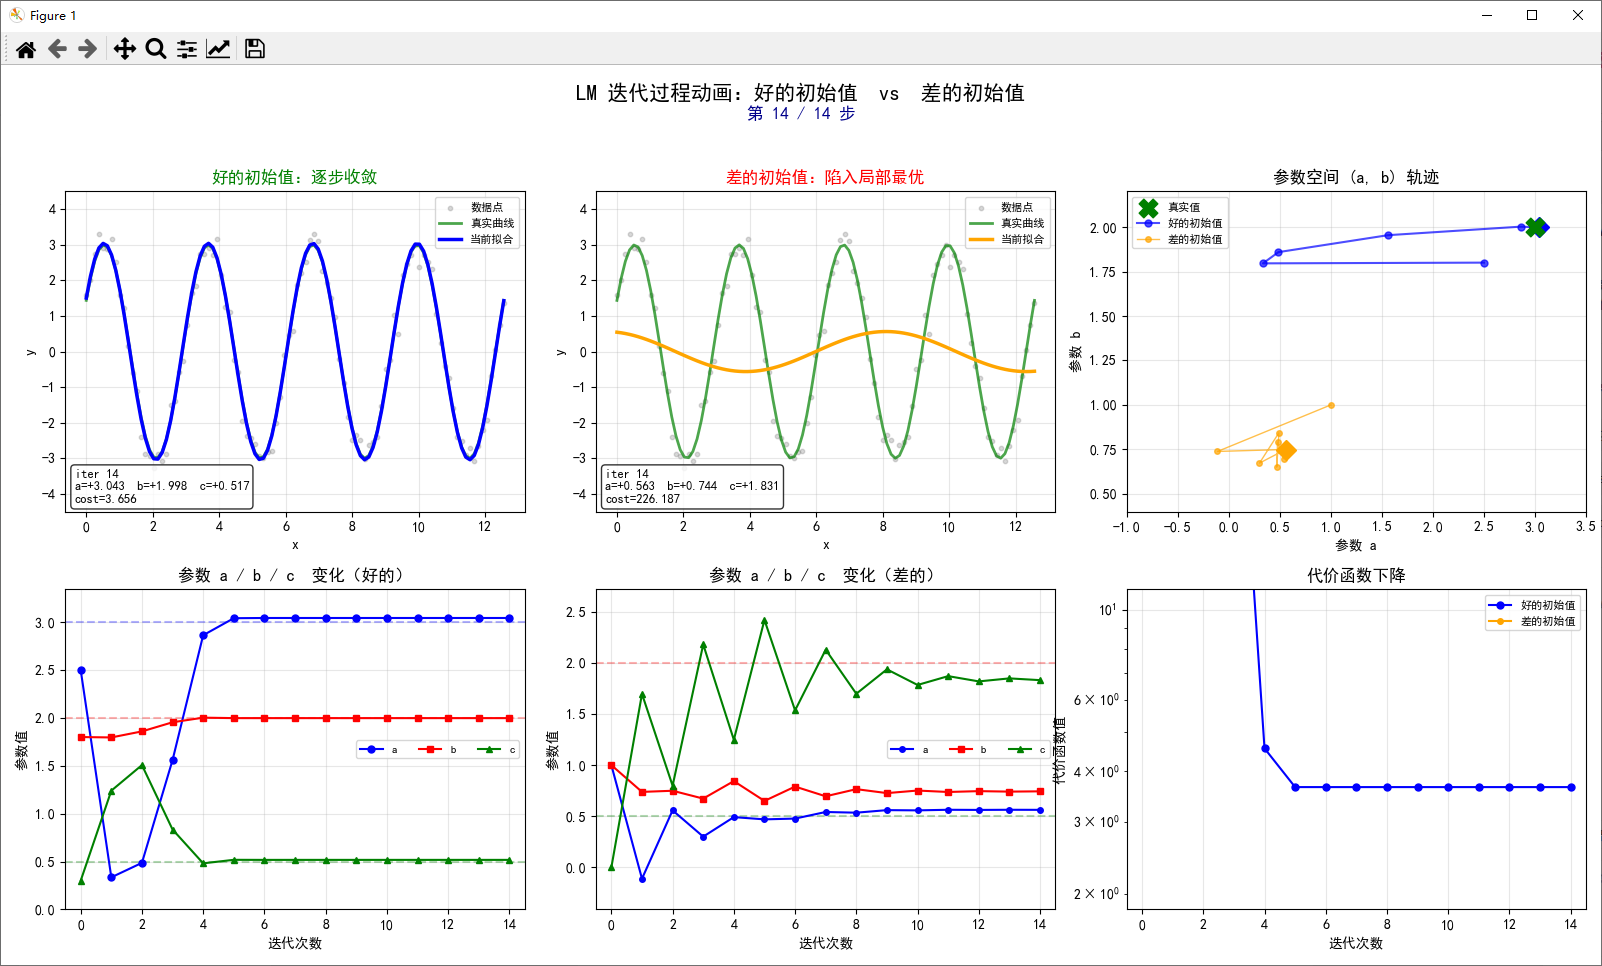
本项目通过动画形式直观展示 Levenberg-Marquardt(LM)算法 在非线性最小二乘优化中的迭代过程,对比两种不同初始值下的收敛行为:
场景 初始值 结果 🟢 好的初始值 [2.5, 1.8, 0.3]✅ 快速收敛到正确解 [3.0, 2.0, 0.5]🔴 差的初始值 [1.0, 1.0, 0.0]❌ 陷入局部最优,无法找到全局最优解 🎯 核心功能
动画包含 6 个子图,全方位展示迭代过程:
左上 / 中上 --- 拟合曲线动态更新:当前参数对应的拟合曲线逐步变化
左下 / 中下 --- 参数收敛曲线:展示 a、b、c 三个参数随迭代的变化趋势
右上 --- 参数空间轨迹:(a, b) 平面上的搜索路径
右下 --- 代价函数下降曲线:对数尺度展示目标函数的收敛过程
📦 环境依赖
pip install numpy matplotlib pillow ffmpeg-python注意 :导出 MP4 需要系统安装
ffmpeg。🚀 使用方法
1. 屏幕实时播放
python lm_animation.py按下右上角关闭按钮即可退出。
2. 导出为 GIF
python lm_animation.py --save out.gif3. 导出为 MP4
python lm_animation.py --save out.mp4可选参数
参数 默认值 说明 --fps2 帧率(帧/秒),调大可加速播放 --repeat关闭 循环播放动画 --save无 保存路径,支持 .gif和.mp4📊 数据说明
模型 :
y = a · sin(b · x + c)真实参数 :
a=3.0, b=2.0, c=0.5数据:100 个采样点,加入高斯噪声(σ=0.3)
迭代历史:来自实际 LM 算法运行结果
🔧 代码架构
lm_animation.py
├── 数据与迭代历史定义          # 真实值、噪声数据、两组实验记录
├── build_figure()             # 创建 2×3 画布与子图布局
├── make_history_equal_length() # 对齐两组迭代长度,便于同步播放
├── animate()                  # 构建动画,返回 fig / update / n_frames
│   └── update(frame)          # 每帧刷新所有子图(覆盖式重绘)
└── main()                     # 命令行入口,支持屏幕播放 & 文件导出
💡 关键实现思路
覆盖式刷新 :预先创建
Line2D对象,每帧仅调用set_data()更新数据,避免重复创建/销毁图形对象等长对齐:短的历史记录通过重复末帧补齐,使左右两组实验可同步逐帧对比
自适应范围:参数曲线和代价函数的 y 轴范围随迭代动态缩放,始终聚焦当前关注区域
📸 效果预览
动画将直观展示:
好的初始值如何稳步逼近真实参数
差的初始值如何在参数空间中徘徊,始终无法跳出局部最优
python
# -*- coding: utf-8 -*-
"""
LM(Levenberg-Marquardt)算法迭代过程动画演示
================================================
通过"逐步绘制 / 覆盖更新"的方式,动态展示 LM 算法在
  - 好的初始值  -> 快速收敛到正确解
  - 差的初始值  -> 陷入局部最优
两种情况下的迭代过程,直观对比。

显示方式(默认 matplotlib 内置动画,逐帧在同一窗口覆盖刷新):
  - 按下右上角关闭按钮即可退出
  - 也可改用 --save 把动画导出成 gif / mp4 文件

用法:
    python lm_animation.py            # 屏幕实时播放
    python lm_animation.py --save out.gif
    python lm_animation.py --save out.mp4
"""

import argparse
import numpy as np
import matplotlib.pyplot as plt
from matplotlib.animation import FuncAnimation


# ============================================================
# 1. 数据与两组迭代历史(来自你之前的实验)
# ============================================================
x_data = np.linspace(0, 4 * np.pi, 100)
a_true, b_true, c_true = 3.0, 2.0, 0.5
y_true = a_true * np.sin(b_true * x_data + c_true)

np.random.seed(42)
noise = np.random.normal(0, 0.3, 100)
y_data = y_true + noise


# 实验1:好的初始值 -> 收敛
history_good = [
    [2.5,    1.8,    0.3],
    [0.3350, 1.7959, 1.2400],
    [0.4860, 1.8590, 1.5071],
    [1.5594, 1.9543, 0.8343],
    [2.8634, 2.0024, 0.4810],
    [3.0412, 1.9977, 0.5178],
    [3.0435, 1.9978, 0.5170],
    [3.0435, 1.9978, 0.5171],
]

# 实验2:差的初始值 -> 局部最优
history_bad = [
    [1.0,    1.0,    0.0],
    [-0.1106, 0.7383, 1.6967],
    [0.5578,  0.7495, 0.7989],
    [0.3008,  0.6728, 2.1798],
    [0.4917,  0.8438, 1.2480],
    [0.4697,  0.6500, 2.4197],
    [0.4774,  0.7903, 1.5354],
    [0.5418,  0.6953, 2.1287],
    [0.5351,  0.7651, 1.6981],
    [0.5600,  0.7265, 1.9366],
    [0.5577,  0.7515, 1.7839],
    [0.5635,  0.7374, 1.8702],
    [0.5620,  0.7458, 1.8188],
    [0.5635,  0.7410, 1.8482],
    [0.5628,  0.7438, 1.8310],
]


def cost_of(params):
    a, b, c = params
    y_pred = a * np.sin(b * x_data + c)
    return 0.5 * np.sum((y_data - y_pred) ** 2)


def make_history_equal_length(h_short, h_long):
    """
    把短的 history 补到和长的一样长(最后一帧重复几次),
    这样左右两个实验可以同步逐帧播放。
    """
    if len(h_short) >= len(h_long):
        return h_short
    pad = [h_short[-1]] * (len(h_long) - len(h_short))
    return h_short + pad


# ============================================================
# 2. 准备画布(一次创建,后面只更新数据 -> 覆盖式刷新)
# ============================================================
def build_figure():
    plt.rcParams['font.sans-serif'] = ['SimHei', 'Microsoft YaHei',
                                       'DejaVu Sans']
    plt.rcParams['axes.unicode_minus'] = False

    fig, axes = plt.subplots(2, 3, figsize=(16, 9))
    fig.suptitle('LM 迭代过程动画:好的初始值  vs  差的初始值',
                 fontsize=15, fontweight='bold')

    # ---- 散点 / 真实曲线(左上、中上共用样式) ----
    for col, title, color in [(0, '好的初始值:逐步收敛', 'green'),
                              (1, '差的初始值:陷入局部最优', 'red')]:
        ax = axes[0, col]
        ax.scatter(x_data, y_data, s=10, alpha=0.3, color='gray',
                   label='数据点')
        ax.plot(x_data, y_true, 'g-', linewidth=2, alpha=0.7, label='真实曲线')
        ax.set_title(title, color=color)
        ax.set_xlabel('x'); ax.set_ylabel('y')
        ax.grid(True, alpha=0.3)
        ax.set_ylim(-4.5, 4.5)

    # ---- 参数收敛子图(左下、中下) ----
    for col in (0, 1):
        ax = axes[1, col]
        for tv, c in [(a_true, 'b'), (b_true, 'r'), (c_true, 'g')]:
            ax.axhline(y=tv, color=c, linestyle='--', alpha=0.3)
        ax.set_xlabel('迭代次数'); ax.set_ylabel('参数值')
        ax.grid(True, alpha=0.3)
        ax.set_xlim(-0.5, len(history_bad) - 0.5)

    axes[1, 0].set_title('参数 a / b / c  变化(好的)')
    axes[1, 1].set_title('参数 a / b / c  变化(差的)')

    # ---- 右上:参数空间轨迹(a-b 平面) ----
    ax = axes[0, 2]
    ax.scatter(a_true, b_true, color='green', s=180, marker='X',
               zorder=5, label='真实值')
    ax.set_xlabel('参数 a'); ax.set_ylabel('参数 b')
    ax.set_title('参数空间 (a, b) 轨迹')
    ax.grid(True, alpha=0.3)
    ax.set_xlim(-1.0, 3.5); ax.set_ylim(0.4, 2.2)

    # ---- 右下:代价函数 ----
    ax = axes[1, 2]
    ax.set_xlabel('迭代次数'); ax.set_ylabel('代价函数值')
    ax.set_title('代价函数下降')
    ax.set_yscale('log')
    ax.grid(True, alpha=0.3)
    ax.set_xlim(-0.5, len(history_bad) - 0.5)

    return fig, axes


# ============================================================
# 3. 动画更新函数:每一帧把所有曲线"覆盖式"刷新
# ============================================================
def animate():
    fig, axes = build_figure()

    history_good_padded = make_history_equal_length(history_good,
                                                    history_bad)
    n_frames = len(history_bad)

    # ---- 预先创建空 Line2D,后面只 set_data,达到"销毁前一帧、画新帧"的效果 ----
    # 左上:当前拟合曲线(好的)
    line_fit_g, = axes[0, 0].plot([], [], 'b-', linewidth=2.5, label='当前拟合')
    axes[0, 0].legend(fontsize=8, loc='upper right')

    # 中上:当前拟合曲线(差的)
    line_fit_b, = axes[0, 1].plot([], [], color='orange', linewidth=2.5,
                                  label='当前拟合')
    axes[0, 1].legend(fontsize=8, loc='upper right')

    # 左下:三条参数曲线(好的)
    pa_g, = axes[1, 0].plot([], [], 'b-o', markersize=5, label='a')
    pb_g, = axes[1, 0].plot([], [], 'r-s', markersize=5, label='b')
    pc_g, = axes[1, 0].plot([], [], 'g-^', markersize=5, label='c')
    axes[1, 0].legend(fontsize=8, ncol=3, loc='center right')

    # 中下:三条参数曲线(差的)
    pa_b, = axes[1, 1].plot([], [], 'b-o', markersize=4, label='a')
    pb_b, = axes[1, 1].plot([], [], 'r-s', markersize=4, label='b')
    pc_b, = axes[1, 1].plot([], [], 'g-^', markersize=4, label='c')
    axes[1, 1].legend(fontsize=8, ncol=3, loc='center right')

    # 右上:轨迹
    traj_g, = axes[0, 2].plot([], [], 'b-o', markersize=5, linewidth=1.5,
                              alpha=0.7, label='好的初始值')
    traj_b, = axes[0, 2].plot([], [], color='orange', marker='o', markersize=4,
                              linewidth=1, alpha=0.7, label='差的初始值')
    cur_g, = axes[0, 2].plot([], [], 'D', color='blue', markersize=10)
    cur_b, = axes[0, 2].plot([], [], 'D', color='orange', markersize=10)
    axes[0, 2].legend(fontsize=8, loc='upper left')

    # 右下:代价
    cost_g_line, = axes[1, 2].plot([], [], 'b-o', markersize=5,
                                   label='好的初始值')
    cost_b_line, = axes[1, 2].plot([], [], color='orange', marker='o',
                                   markersize=4, label='差的初始值')
    axes[1, 2].legend(fontsize=8)

    # 信息文字
    info_g = axes[0, 0].text(0.02, 0.02, '', transform=axes[0, 0].transAxes,
                             fontsize=9, va='bottom',
                             bbox=dict(boxstyle='round', fc='white',
                                       alpha=0.8))
    info_b = axes[0, 1].text(0.02, 0.02, '', transform=axes[0, 1].transAxes,
                             fontsize=9, va='bottom',
                             bbox=dict(boxstyle='round', fc='white',
                                       alpha=0.8))
    step_text = fig.text(0.5, 0.94, '', ha='center', fontsize=12,
                         color='darkblue')

    def update(frame):
        """每帧重新设置所有 Line2D 的数据 = 覆盖式重绘。"""
        params_g = history_good_padded[frame]
        params_b = history_bad[frame]

        # ---- 拟合曲线 ----
        a, b, c = params_g
        line_fit_g.set_data(x_data, a * np.sin(b * x_data + c))

        a, b, c = params_b
        line_fit_b.set_data(x_data, a * np.sin(b * x_data + c))

        # ---- 参数曲线(到当前帧为止) ----
        g_so_far = history_good_padded[:frame + 1]
        b_so_far = history_bad[:frame + 1]
        xs = list(range(len(g_so_far)))

        pa_g.set_data(xs, [h[0] for h in g_so_far])
        pb_g.set_data(xs, [h[1] for h in g_so_far])
        pc_g.set_data(xs, [h[2] for h in g_so_far])

        xs_b = list(range(len(b_so_far)))
        pa_b.set_data(xs_b, [h[0] for h in b_so_far])
        pb_b.set_data(xs_b, [h[1] for h in b_so_far])
        pc_b.set_data(xs_b, [h[2] for h in b_so_far])

        # ---- 参数空间轨迹 ----
        traj_g.set_data([h[0] for h in g_so_far],
                        [h[1] for h in g_so_far])
        traj_b.set_data([h[0] for h in b_so_far],
                        [h[1] for h in b_so_far])
        cur_g.set_data([g_so_far[-1][0]], [g_so_far[-1][1]])
        cur_b.set_data([b_so_far[-1][0]], [b_so_far[-1][1]])

        # ---- 代价 ----
        cg = [cost_of(h) for h in g_so_far]
        cb = [cost_of(h) for h in b_so_far]
        cost_g_line.set_data(xs, cg)
        cost_b_line.set_data(xs_b, cb)

        # 自适应 y 轴范围(参数曲线)
        all_vals = ([h[0] for h in g_so_far] + [h[1] for h in g_so_far]
                    + [h[2] for h in g_so_far])
        lo, hi = min(all_vals), max(all_vals)
        axes[1, 0].set_ylim(lo - 0.3, hi + 0.3)

        all_vals_b = ([h[0] for h in b_so_far] + [h[1] for h in b_so_far]
                      + [h[2] for h in b_so_far])
        lob, hib = min(all_vals_b), max(all_vals_b)
        axes[1, 1].set_ylim(lob - 0.3, hib + 0.3)

        # 代价 y 轴下界
        if cg and cb:
            ymin = min(min(cg), min(cb)) * 0.5
            axes[1, 2].set_ylim(bottom=max(ymin, 1e-3))

        # ---- 文字 ----
        a, b, c = params_g
        info_g.set_text(f'iter {frame}\na={a:+.3f}  b={b:+.3f}  c={c:+.3f}\n'
                        f'cost={cost_of(params_g):.3f}')
        a, b, c = params_b
        info_b.set_text(f'iter {frame}\na={a:+.3f}  b={b:+.3f}  c={c:+.3f}\n'
                        f'cost={cost_of(params_b):.3f}')
        step_text.set_text(f'第 {frame} / {n_frames - 1} 步')

        artists = [line_fit_g, line_fit_b, pa_g, pb_g, pc_g, pa_b, pb_b, pc_b,
                   traj_g, traj_b, cur_g, cur_b, cost_g_line, cost_b_line,
                   info_g, info_b, step_text]
        return artists

    return fig, update, n_frames


# ============================================================
# 4. 入口
# ============================================================
def main():
    parser = argparse.ArgumentParser(description='LM 迭代过程动画')
    parser.add_argument('--save', type=str, default=None,
                        help='保存为文件(如 out.gif 或 out.mp4)')
    parser.add_argument('--fps', type=int, default=2,
                        help='帧率(默认 2,便于看清每步)')
    parser.add_argument('--repeat', action='store_true',
                        help='循环播放')
    args = parser.parse_args()

    fig, update, n_frames = animate()

    anim = FuncAnimation(
        fig, update,
        frames=n_frames,
        interval=1000 / args.fps,    # 每帧间隔(ms)
        blit=False,
        repeat=args.repeat,
    )

    if args.save:
        # 保存到文件
        if args.save.lower().endswith('.gif'):
            anim.save(args.save, writer='pillow', fps=args.fps)
        else:
            anim.save(args.save, writer='ffmpeg', fps=args.fps,
                      dpi=120)
        print(f'已保存到: {args.save}')
    else:
        # 屏幕实时播放
        plt.tight_layout(rect=[0, 0, 1, 0.94])
        plt.show()


if __name__ == '__main__':
    main()