
文章目录
-
-
- [一、状态变量设计:13 个变量的"帧率协议栈"](#一、状态变量设计:13 个变量的"帧率协议栈")
-
- 与之前页面的关键差异
- [`recentSamples` 的滑动窗口设计](#
recentSamples的滑动窗口设计) - [`frameIndex` 的"帧计数器"角色](#
frameIndex的"帧计数器"角色)
- 二、生命周期管理:采样器的启停
- 三、MetricsSection:四宫格指标面板
-
- [`MetricCard` 参数化 Builder](#
MetricCard参数化 Builder) - 三个颜色函数的"交通灯"语义
- [`MetricCard` 参数化 Builder](#
- 四、FrameBarChart:纯代码实现的"帧耗时柱状图"
- 五、ScenarioSection:场景选择器的"单选"实现
-
- [没有 RadioGroup 的"伪单选"](#没有 RadioGroup 的"伪单选")
- 场景元数据的三层信息
- 六、ActionSection:条件渲染的"注入按钮"
-
- [场景感知的 UI](#场景感知的 UI)
- 两个按钮的"剂量"设计
- [七、WorkflowSection 与 CulpritSection:静态文档的"组件化"](#七、WorkflowSection 与 CulpritSection:静态文档的"组件化")
- [八、LogSection:时间戳 + 层级 + 消息的"三元组"](#八、LogSection:时间戳 + 层级 + 消息的"三元组")
- 完整代码
-
一、状态变量设计:13 个变量的"帧率协议栈"
| 变量 | 类型 | 角色 | 更新频率 |
|---|---|---|---|
frameStatus |
string | 全局状态描述 | 低 |
isSampling |
boolean | 采样开关 | 低 |
activeScenario |
string | 当前选中的掉帧场景 ID | 低 |
instantFps |
number | 瞬时帧率 | 极高(每帧) |
avgFps |
number | 平均帧率 | 高 |
avgFrameMs |
number | 平均帧耗时 | 高 |
jankCount |
number | 掉帧计数 | 中 |
severeJankCount |
number | 严重掉帧计数 | 低 |
frameIndex |
number | 累计采样帧数 | 极高(每帧) |
recentSamples |
FrameSample\[\] | 最近 N 帧的采样数据 | 极高(每帧) |
frameLogs |
FrameProfilerLogItem\[\] | 采样日志 | 中 |
与之前页面的关键差异
之前所有页面的状态变量都是事件驱动 的------只在用户操作或系统回调时更新。而这个页面引入了持续采样型状态变量:
| 类型 | 代表变量 | 更新触发 |
|---|---|---|
| 事件驱动 | activeScenario、isSampling |
用户点击、系统回调 |
| 持续采样 | instantFps、frameIndex、recentSamples |
每帧触发(~16.67ms 一次) |
这意味着 aboutToAppear 启动采样后,有 至少 5 个状态变量 在以 60Hz 的频率被持续写入 AppStorage。这是整个 Demo 中状态更新最密集的页面,对 ArkUI 的响应式系统提出了最高的性能要求。
recentSamples 的滑动窗口设计
typescript
@StorageLink('recentSamples') recentSamples: FrameSample[] = []这个数组不会无限增长------在 FrameBarChart 中通过 .slice(0, 20) 只取最近 20 帧。但数组本身的增长策略取决于 Service 层的实现(推测是在 Service 中维护固定长度的滑动窗口)。
frameIndex 的"帧计数器"角色
typescript
@StorageLink('frameIndex') frameIndex: number = 0这个变量看似简单,但它承担了一个关键职责------作为 FrameSample 的唯一标识符:
typescript
ForEach(this.recentSamples.slice(0, 20).reverse(), (sample: FrameSample) => {
  Column()
    // ...
}, (sample: FrameSample) => `${sample.frameIndex}`)  // 用 frameIndex 作为 key
每帧递增的 frameIndex 确保了 ForEach 的 key 永远唯一,避免了因 key 重复导致的组件复用错误。
二、生命周期管理:采样器的启停
typescript
aboutToAppear(): void {
  FrameProfilerService.startSampling()
}

aboutToDisappear(): void {
  FrameProfilerService.stopSampling()
}
这是整个 Demo 中唯一使用 aboutToDisappear 的页面。之前的页面都没有实现组件销毁时的清理逻辑,因为它们的 Service 不需要持续运行。
而帧率采样器必须在页面销毁时停止,否则:
- 采样器继续运行,但 UI 已不存在,
AppStorage写入无人消费 - 持续的高频写入会浪费 CPU 资源
- 可能导致内存泄漏(
recentSamples数组持续增长)
这种"启动-销毁"的对称设计是性能分析工具的标准模式:
aboutToAppear  →  startSampling()  →  每帧采集数据
aboutToDisappear  →  stopSampling()  →  释放资源
三、MetricsSection:四宫格指标面板
typescript
Row({ space: 10 }) {
  this.MetricCard('瞬时 FPS', `${this.instantFps.toFixed(0)}`, this.fpsColor(this.instantFps))
  this.MetricCard('平均 FPS', `${this.avgFps.toFixed(1)}`, '#93C5FD')
}
Row({ space: 10 }) {
  this.MetricCard('帧耗时', `${this.avgFrameMs.toFixed(1)}ms`, this.frameMsColor(this.avgFrameMs))
  this.MetricCard('掉帧', `${this.jankCount}`, this.jankCount > 0 ? '#FCA5A5' : '#6EE7B7')
}
MetricCard 参数化 Builder
typescript
@Builder
MetricCard(label: string, value: string, color: string) {
  Column({ space: 4 }) {
    Text(label).fontSize(11).fontColor('#64748B')
    Text(value).fontSize(22).fontWeight(FontWeight.Bold).fontColor(color)
  }
  .layoutWeight(1)
  .padding(12)
  .backgroundColor('#1A2233')
  .borderRadius(10)
  .alignItems(HorizontalAlign.Start)
}
与元服务卡片页面的 InfoRow 相比,MetricCard 的设计更加精致:
| 维度 | InfoRow | MetricCard |
|---|---|---|
| 参数 | 2 个(label, value) | 3 个(label, value, color) |
| 布局方向 | 水平(Row) | 垂直(Column) |
| 字号层级 | 单一级(12) | 双级(11 + 22) |
| 颜色语义 | 固定(灰/白) | 动态(由调用方决定) |
MetricCard 的 color 参数由三个不同的颜色函数动态计算,实现了数据驱动的视觉编码。
三个颜色函数的"交通灯"语义
typescript
private fpsColor(fps: number): string {
  if (fps >= 55) return '#6EE7B7'   // 绿色:流畅
  if (fps >= 40) return '#FBBF24'   // 黄色:轻微掉帧
  return '#FCA5A5'                   // 红色:严重掉帧
}

private frameMsColor(ms: number): string {
  if (ms <= JANK_FRAME_MS) return '#6EE7B7'      // 绿色:在预算内
  if (ms <= JANK_FRAME_MS * 2) return '#FBBF24'  // 黄色:超预算 1 倍
  return '#FCA5A5'                                // 红色:超预算 2 倍
}
两个函数共享同一套色彩语义(绿 → 黄 → 红),但阈值逻辑不同:
fpsColor:越高越好,阈值是 55 / 40frameMsColor:越低越好 ,阈值是JANK_FRAME_MS/JANK_FRAME_MS * 2
这种"反向阈值"的设计体现了性能指标的本质------FPS 和帧耗时是同一枚硬币的两面(FPS = 1000 / frameMs),但从用户认知角度,分开呈现更直观。
掉帧计数的颜色逻辑则更为简洁:
typescript
this.jankCount > 0 ? '#FCA5A5' : '#6EE7B7'只有两态------有掉帧(红)或无掉帧(绿),没有中间态。这是因为掉帧是一个离散事件(要么发生了,要么没有),不像 FPS 和帧耗时那样是连续量。
四、FrameBarChart:纯代码实现的"帧耗时柱状图"
这是整个 Demo 中唯一的自定义图表组件,完全用 ArkUI 基础组件构建:
typescript
@Builder
FrameBarChart() {
  Column({ space: 6 }) {
    Text('最近帧耗时(ms)· 超过 16.67 为掉帧')
      .fontSize(11).fontColor('#64748B')

    Row({ space: 3 }) {
      if (this.recentSamples.length === 0) {
        Text('等待采样...').fontSize(11).fontColor('#475569')
      } else {
        ForEach(this.recentSamples.slice(0, 20).reverse(), (sample: FrameSample) => {
          Column()
            .width(8)
            .height(this.barHeight(sample.deltaMs))
            .backgroundColor(sample.isJank ? '#EF4444' : '#22C55E')
            .borderRadius(2)
        }, (sample: FrameSample) => `${sample.frameIndex}`)
      }
    }
    .width('100%')
    .height(72)
    .alignItems(VerticalAlign.Bottom)
  }
}
设计亮点
.reverse() 实现时间轴方向
typescript
this.recentSamples.slice(0, 20).reverse()recentSamples 数组中最新的帧在末尾,但柱状图通常从左到右表示时间流逝(旧 → 新)。.reverse() 将数组翻转,使最旧的帧出现在左侧。
barHeight 函数的非线性映射
typescript
private barHeight(deltaMs: number): number {
  const capped = deltaMs > 50 ? 50 : deltaMs
  return 8 + capped * 1.2
}capped限制最大高度,防止单帧耗时过长导致柱子超出容器8 +是最小高度,确保即使帧耗时为 0 也能看到柱子* 1.2是缩放系数,将毫秒映射为像素
这种手动映射是图表库的核心逻辑------ArkUI 没有内置图表组件,需要开发者自己实现坐标系转换。
颜色编码:掉帧帧用红色
typescript
.backgroundColor(sample.isJank ? '#EF4444' : '#22C55E')sample.isJank 由 Service 层计算(deltaMs > JANK_FRAME_MS),UI 层只负责根据布尔值切换颜色。这种计算与渲染分离的设计,让 UI 代码更简洁。
五、ScenarioSection:场景选择器的"单选"实现
typescript
ForEach(PROFILER_SCENARIOS, (item: ProfilerScenarioMeta) => {
  Column({ space: 4 }) {
    Row({ space: 8 }) {
      Text(this.activeScenario === item.id ? '●' : '○')
        .fontColor(this.activeScenario === item.id ? '#6EE7B7' : '#475569')
      Text(item.title)
        .fontSize(13)
        .fontColor(this.activeScenario === item.id ? '#F8FAFC' : '#CBD5E1')
        .layoutWeight(1)
    }
    .width('100%')
    .onClick(() => {
      FrameProfilerService.selectScenario(item.id)
    })
    // ...
  }
  // ...
}, (item: ProfilerScenarioMeta) => item.id)
没有 RadioGroup 的"伪单选"
ArkUI 没有提供原生的单选组件(RadioGroup),这里用状态驱动的方式实现:
- 每个选项的选中状态由
this.activeScenario === item.id计算得出 - 点击时调用
FrameProfilerService.selectScenario(item.id),Service 会更新AppStorage中的activeScenario @StorageLink监听到变化后,触发 UI 重绘,所有选项重新计算选中状态
这种模式比原生 RadioGroup 更灵活------可以在同一个 ForEach 中混合不同类型的选项,也可以自定义选中态的样式(这里用了 Unicode 圆点 ●/○)。
场景元数据的三层信息
每个场景项展示三层信息:
typescript
Text(`症状 · ${item.symptom}`)          // 用户可感知的现象
Text(`Profiler · ${item.profilerHint}`) // DevEco Profiler 中的对应视图
if (item.traceTag !== '-') {
  Text(`hiTrace · ${item.traceTag}`)    // hiTrace 标签(可选)
}
这种设计让开发者不仅能看到"是什么场景",还能知道"在 Profiler 中怎么看"和"用什么标签搜索",形成了完整的诊断闭环。
六、ActionSection:条件渲染的"注入按钮"
typescript
if (this.activeScenario === SCENARIO_MAIN_THREAD) {
  Row({ space: 10 }) {
    Button('注入 30ms 阻塞')
      .layoutWeight(1)
      .backgroundColor('#DC2626')
      .onClick(() => {
        FrameProfilerService.injectMainThreadBlock(30)
      })
    Button('注入 80ms 阻塞')
      .layoutWeight(1)
      .backgroundColor('#B91C1C')
      .onClick(() => {
        FrameProfilerService.injectMainThreadBlock(80)
      })
  }
  .width('100%')
}
场景感知的 UI
只有当选中"主线程阻塞"场景时,才显示"注入阻塞"按钮。这是条件渲染的典型应用:
this.activeScenario变化时,if条件重新计算- 条件为真时,Button 组件树被创建并插入 DOM
- 条件为假时,Button 组件树被销毁并从 DOM 移除
这种按需渲染的策略,避免了无关组件的创建开销,也防止了用户在不合适的场景下误操作。
两个按钮的"剂量"设计
30ms 和 80ms 不是随意选的:
- 30ms ≈ 2 帧(16.67ms × 2),会导致轻微掉帧
- 80ms ≈ 5 帧,会导致严重掉帧
这种"剂量梯度"让开发者可以观察不同阻塞时长对帧率的影响,验证 Profiler 的检测灵敏度。
七、WorkflowSection 与 CulpritSection:静态文档的"组件化"
typescript
@Builder
WorkflowSection() {
  Column({ space: 6 }) {
    Text('DevEco Profiler 工作流')
      .fontSize(14)
      .fontWeight(FontWeight.Medium)
      .fontColor('#E2E8F0')

    ForEach(PROFILER_WORKFLOW, (step: string, index: number) => {
      Text(`${index + 1}. ${step}`)
        .fontSize(12)
        .fontColor('#94A3B8')
    }, (step: string, index: number) => `${index}_${step}`)
  }
  // ...
}
PROFILER_WORKFLOW 是一个字符串数组:
typescript
export const PROFILER_WORKFLOW = [
  '打开 DevEco Profiler',
  '选择 Frame 视图',
  '滚动页面触发掉帧',
  '观察 Main Thread 耗时',
  '定位耗时最长的函数',
]
将静态文档拆成数组,用 ForEach 渲染,有两个好处:
- 样式统一:所有步骤共享同一套 fontSize / fontColor,修改时只需改一处
- 可扩展 :未来如果想给某一步加图标或链接,只需把字符串改成对象
{ text: string, icon?: string, link?: string },UI 代码几乎不用动
CulpritSection 同理,将"掉帧元凶清单"数据化,实现了内容与表现的分离。
八、LogSection:时间戳 + 层级 + 消息的"三元组"
typescript
ForEach(this.frameLogs, (item: FrameProfilerLogItem) => {
  Column({ space: 2 }) {
    Row({ space: 8 }) {
      Text(item.time)
        .fontSize(10)
        .fontColor('#64748B')
      Text(`${item.layer}`)
        .fontSize(11)
        .fontColor('#93C5FD')
    }
    Text(item.message)
      .fontSize(12)
      .fontColor('#CBD5E1')
  }
  // ...
}, (item: FrameProfilerLogItem) => item.id)
每条日志由三个字段组成:
| 字段 | 含义 | 样式 |
|---|---|---|
time |
采样时间戳 | 10号字,灰色 |
layer |
采样层级(UI / Render / GPU) | 11号字,蓝色 |
message |
具体信息 | 12号字,白色 |
这种"三元组"布局是日志系统的经典模式:
- 时间戳左对齐,便于快速扫描时间线
- 层级用蓝色突出,帮助开发者过滤关注点
- 消息独占一行,保证可读性
item.id 作为 ForEach 的 key,确保日志追加时不会重复渲染已有项。
完整代码
dart
import { MemoryLeakZone } from '../memory/components/MemoryLeakZone'
import { MemoryMonitorService } from '../memory/MemoryMonitorService'
import {
  HEAP_WORKFLOW,
  HeapSnapshotRecord,
  LEAK_LINK,
  LEAK_NONE,
  LEAK_SCENARIOS,
  LeakScenarioMeta,
  LeakStats,
  MEMORY_CULPRITS,
  MemoryLogItem,
  MemorySample
} from '../memory/MemoryTypes'

@Entry
@Component
struct Index {
  @StorageLink('memStatus') memStatus: string = 'Memory Monitor 就绪'
  @StorageLink('isMemSampling') isMemSampling: boolean = false
  @StorageLink('activeLeakScenario') activeLeakScenario: string = LEAK_NONE
  @StorageLink('leakFixedMode') leakFixedMode: boolean = false
  @StorageLink('currentPssKb') currentPssKb: number = 0
  @StorageLink('currentVmHeapKb') currentVmHeapKb: number = 0
  @StorageLink('currentNativeKb') currentNativeKb: number = 0
  @StorageLink('vmHeapLimitKb') vmHeapLimitKb: number = 0
  @StorageLink('heapDeltaKb') heapDeltaKb: number = 0
  @StorageLink('memSamples') memSamples: MemorySample[] = []
  @StorageLink('heapSnapshots') heapSnapshots: HeapSnapshotRecord[] = []
  @StorageLink('leakStats') leakStats: LeakStats = {
    timerCount: 0,
    cacheItems: 0,
    listenerCount: 0,
    linkChildAlive: 0
  }
  @StorageLink('memLogs') memLogs: MemoryLogItem[] = []

  aboutToAppear(): void {
    MemoryMonitorService.startSampling()
  }

  aboutToDisappear(): void {
    MemoryMonitorService.stopSampling()
  }

  build() {
    Scroll() {
      Column({ space: 16 }) {
        this.HeaderSection()
        this.MetricsSection()
        this.LeakStatsSection()
        this.ScenarioSection()
        MemoryLeakZone()
        this.SnapshotSection()
        this.ActionSection()
        this.WorkflowSection()
        this.CulpritSection()
        this.LogSection()
      }
      .width('100%')
      .padding(16)
    }
    .width('100%')
    .height('100%')
    .backgroundColor('#0B0F17')
  }

  @Builder
  HeaderSection() {
    Column({ space: 6 }) {
      Text('内存监控与优化 · HeapSnapshot 分析')
        .fontSize(22)
        .fontWeight(FontWeight.Bold)
        .fontColor('#F8FAFC')

      Text(this.memStatus)
        .fontSize(13)
        .fontColor('#94A3B8')

      Text('hidebug 实时采样 + dumpJsHeapData · 对照 DevEco Profiler Memory')
        .fontSize(11)
        .fontColor('#64748B')
    }
    .alignItems(HorizontalAlign.Start)
    .width('100%')
  }

  @Builder
  MetricsSection() {
    Column({ space: 10 }) {
      Row({ space: 10 }) {
        this.MetricCard('PSS', this.formatKb(this.currentPssKb), '#93C5FD')
        this.MetricCard('VM Heap', this.formatKb(this.currentVmHeapKb), this.heapColor(this.heapDeltaKb))
      }
      .width('100%')

      Row({ space: 10 }) {
        this.MetricCard('Native Alloc', this.formatKb(this.currentNativeKb), '#C4B5FD')
        this.MetricCard('Heap Δ', this.formatDelta(this.heapDeltaKb), this.heapColor(this.heapDeltaKb))
      }
      .width('100%')

      Text(`VM Heap 上限 · ${this.formatKb(this.vmHeapLimitKb)}`)
        .fontSize(11)
        .fontColor('#64748B')

      this.MemoryTrendChart()
    }
    .width('100%')
    .padding(14)
    .backgroundColor('#121826')
    .borderRadius(14)
  }

  @Builder
  MetricCard(label: string, value: string, color: string) {
    Column({ space: 4 }) {
      Text(label)
        .fontSize(11)
        .fontColor('#64748B')
      Text(value)
        .fontSize(20)
        .fontWeight(FontWeight.Bold)
        .fontColor(color)
    }
    .layoutWeight(1)
    .padding(12)
    .backgroundColor('#1A2233')
    .borderRadius(10)
    .alignItems(HorizontalAlign.Start)
  }

  @Builder
  MemoryTrendChart() {
    Column({ space: 6 }) {
      Text('VM Heap 采样趋势(KB)')
        .fontSize(11)
        .fontColor('#64748B')

      Row({ space: 3 }) {
        if (this.memSamples.length === 0) {
          Text('等待采样...')
            .fontSize(11)
            .fontColor('#475569')
        } else {
          ForEach(this.memSamples.slice(0, 18).reverse(), (sample: MemorySample) => {
            Column()
              .width(10)
              .height(this.barHeight(sample.vmHeapUsedKb))
              .backgroundColor('#6366F1')
              .borderRadius(2)
          }, (sample: MemorySample) => sample.id)
        }
      }
      .width('100%')
      .height(64)
      .alignItems(VerticalAlign.Bottom)
    }
    .width('100%')
  }

  @Builder
  LeakStatsSection() {
    Column({ space: 8 }) {
      Text('泄漏计数器(应对照 HeapSnapshot Retained Size)')
        .fontSize(14)
        .fontWeight(FontWeight.Medium)
        .fontColor('#E2E8F0')

      Row({ space: 8 }) {
        this.StatChip('Timer', `${this.leakStats.timerCount}`)
        this.StatChip('Cache', `${this.leakStats.cacheItems}`)
        this.StatChip('Listener', `${this.leakStats.listenerCount}`)
        this.StatChip('@Link', `${this.leakStats.linkChildAlive}`)
      }
      .width('100%')
    }
    .alignItems(HorizontalAlign.Start)
    .width('100%')
    .padding(14)
    .backgroundColor('#121826')
    .borderRadius(14)
  }

  @Builder
  StatChip(label: string, value: string) {
    Column({ space: 2 }) {
      Text(label)
        .fontSize(10)
        .fontColor('#64748B')
      Text(value)
        .fontSize(16)
        .fontColor('#FCA5A5')
    }
    .layoutWeight(1)
    .padding(8)
    .backgroundColor('#1A2233')
    .borderRadius(8)
    .alignItems(HorizontalAlign.Center)
  }

  @Builder
  ScenarioSection() {
    Column({ space: 8 }) {
      Text('泄漏场景')
        .fontSize(14)
        .fontWeight(FontWeight.Medium)
        .fontColor('#E2E8F0')

      ForEach(LEAK_SCENARIOS, (item: LeakScenarioMeta) => {
        Column({ space: 4 }) {
          Row({ space: 8 }) {
            Text(this.activeLeakScenario === item.id ? '●' : '○')
              .fontColor(this.activeLeakScenario === item.id ? '#6EE7B7' : '#475569')
            Text(item.title)
              .fontSize(13)
              .fontColor(this.activeLeakScenario === item.id ? '#F8FAFC' : '#CBD5E1')
              .layoutWeight(1)
          }
          .width('100%')
          .onClick(() => {
            MemoryMonitorService.selectLeakScenario(item.id)
          })

          Text(`症状 · ${item.symptom}`)
            .fontSize(11)
            .fontColor('#64748B')
          Text(`HeapSnapshot · ${item.heapHint}`)
            .fontSize(11)
            .fontColor('#475569')
          if (item.fixHint !== '-') {
            Text(`修复 · ${item.fixHint}`)
              .fontSize(10)
              .fontColor('#334155')
          }
        }
        .alignItems(HorizontalAlign.Start)
        .width('100%')
        .padding(10)
        .backgroundColor(this.activeLeakScenario === item.id ? '#172033' : '#111827')
        .borderRadius(8)
      }, (item: LeakScenarioMeta) => item.id)
    }
    .width('100%')
    .padding(14)
    .backgroundColor('#121826')
    .borderRadius(14)
  }

  @Builder
  SnapshotSection() {
    Column({ space: 8 }) {
      Text('HeapSnapshot 记录')
        .fontSize(14)
        .fontWeight(FontWeight.Medium)
        .fontColor('#E2E8F0')

      if (this.heapSnapshots.length === 0) {
        Text('尚未导出 Snapshot')
          .fontSize(12)
          .fontColor('#64748B')
      } else {
        ForEach(this.heapSnapshots, (snap: HeapSnapshotRecord) => {
          Column({ space: 2 }) {
            Text(`${snap.label} · ${snap.createdAt}`)
              .fontSize(12)
              .fontColor('#93C5FD')
            Text(snap.fileName)
              .fontSize(11)
              .fontColor('#CBD5E1')
            Text(`PSS ${this.formatKb(snap.pssKb)} · VM Heap ${this.formatKb(snap.vmHeapUsedKb)}`)
              .fontSize(10)
              .fontColor('#64748B')
            Text(snap.filePath)
              .fontSize(9)
              .fontColor('#475569')
          }
          .alignItems(HorizontalAlign.Start)
          .width('100%')
          .padding({ top: 4, bottom: 4 })
        }, (snap: HeapSnapshotRecord) => snap.id)
      }
    }
    .alignItems(HorizontalAlign.Start)
    .width('100%')
    .padding(14)
    .backgroundColor('#121826')
    .borderRadius(14)
  }

  @Builder
  ActionSection() {
    Column({ space: 10 }) {
      Row({ space: 10 }) {
        Button(this.isMemSampling ? '停止采样' : '开始采样')
          .layoutWeight(1)
          .backgroundColor('#2563EB')
          .onClick(() => {
            if (this.isMemSampling) {
              MemoryMonitorService.stopSampling()
            } else {
              MemoryMonitorService.startSampling()
            }
          })
        Button('手动采样')
          .layoutWeight(1)
          .backgroundColor('#334155')
          .onClick(() => {
            MemoryMonitorService.captureSample()
          })
      }
      .width('100%')

      Row({ space: 10 }) {
        Button('基线 Snapshot')
          .layoutWeight(1)
          .backgroundColor('#059669')
          .onClick(() => {
            MemoryMonitorService.takeHeapSnapshot('baseline')
          })
        Button('泄漏后 Snapshot')
          .layoutWeight(1)
          .backgroundColor('#DC2626')
          .onClick(() => {
            MemoryMonitorService.takeHeapSnapshot('after_leak')
          })
      }
      .width('100%')

      Row({ space: 10 }) {
        Button('触发泄漏')
          .layoutWeight(1)
          .backgroundColor('#B45309')
          .enabled(this.activeLeakScenario !== LEAK_NONE)
          .onClick(() => {
            MemoryMonitorService.triggerLeakOnce()
          })
        Button('应用修复')
          .layoutWeight(1)
          .backgroundColor('#6EE7B7')
          .fontColor('#0F172A')
          .onClick(() => {
            MemoryMonitorService.applyFix()
          })
      }
      .width('100%')

      if (this.activeLeakScenario === LEAK_LINK) {
        Text(this.leakFixedMode ? '修复模式:aboutToDisappear 会清理定时器' : '泄漏模式:卸载子组件后定时器仍运行')
          .fontSize(11)
          .fontColor(this.leakFixedMode ? '#6EE7B7' : '#FCA5A5')
      }
    }
    .width('100%')
  }

  @Builder
  WorkflowSection() {
    Column({ space: 6 }) {
      Text('HeapSnapshot 分析工作流')
        .fontSize(14)
        .fontWeight(FontWeight.Medium)
        .fontColor('#E2E8F0')

      ForEach(HEAP_WORKFLOW, (step: string, index: number) => {
        Text(`${index + 1}. ${step}`)
          .fontSize(12)
          .fontColor('#94A3B8')
      }, (step: string, index: number) => `${index}_${step}`)
    }
    .alignItems(HorizontalAlign.Start)
    .width('100%')
    .padding(14)
    .backgroundColor('#121826')
    .borderRadius(14)
  }

  @Builder
  CulpritSection() {
    Column({ space: 6 }) {
      Text('常见泄漏元凶')
        .fontSize(14)
        .fontWeight(FontWeight.Medium)
        .fontColor('#E2E8F0')

      ForEach(MEMORY_CULPRITS, (item: string) => {
        Text(`· ${item}`)
          .fontSize(12)
          .fontColor('#94A3B8')
      }, (item: string) => item)
    }
    .alignItems(HorizontalAlign.Start)
    .width('100%')
    .padding(14)
    .backgroundColor('#121826')
    .borderRadius(14)
  }

  @Builder
  LogSection() {
    Column({ space: 8 }) {
      Text('监控日志')
        .fontSize(14)
        .fontWeight(FontWeight.Medium)
        .fontColor('#E2E8F0')

      if (this.memLogs.length === 0) {
        Text('暂无日志')
          .fontSize(12)
          .fontColor('#64748B')
      } else {
        ForEach(this.memLogs, (item: MemoryLogItem) => {
          Column({ space: 2 }) {
            Row({ space: 8 }) {
              Text(item.time)
                .fontSize(10)
                .fontColor('#64748B')
              Text(item.layer)
                .fontSize(11)
                .fontColor('#93C5FD')
            }
            Text(item.message)
              .fontSize(12)
              .fontColor('#CBD5E1')
          }
          .alignItems(HorizontalAlign.Start)
          .width('100%')
          .padding({ top: 4, bottom: 4 })
        }, (item: MemoryLogItem) => item.id)
      }
    }
    .alignItems(HorizontalAlign.Start)
    .width('100%')
    .padding(14)
    .backgroundColor('#121826')
    .borderRadius(14)
  }

  private formatKb(kb: number): string {
    if (kb >= 1024) {
      return `${(kb / 1024).toFixed(1)} MB`
    }
    return `${kb.toFixed(0)} KB`
  }

  private formatDelta(delta: number): string {
    const prefix = delta > 0 ? '+' : ''
    return `${prefix}${delta.toFixed(0)} KB`
  }

  private heapColor(delta: number): string {
    if (delta <= 0) {
      return '#6EE7B7'
    }
    if (delta < 512) {
      return '#FBBF24'
    }
    return '#FCA5A5'
  }

  private barHeight(kb: number): number {
    const base = this.memSamples.length > 0 ? this.memSamples[0].vmHeapUsedKb : kb
    const minKb = base > 1024 ? base - 512 : 0
    const capped = kb - minKb
    return 8 + (capped > 400 ? 400 : capped) * 0.12
  }
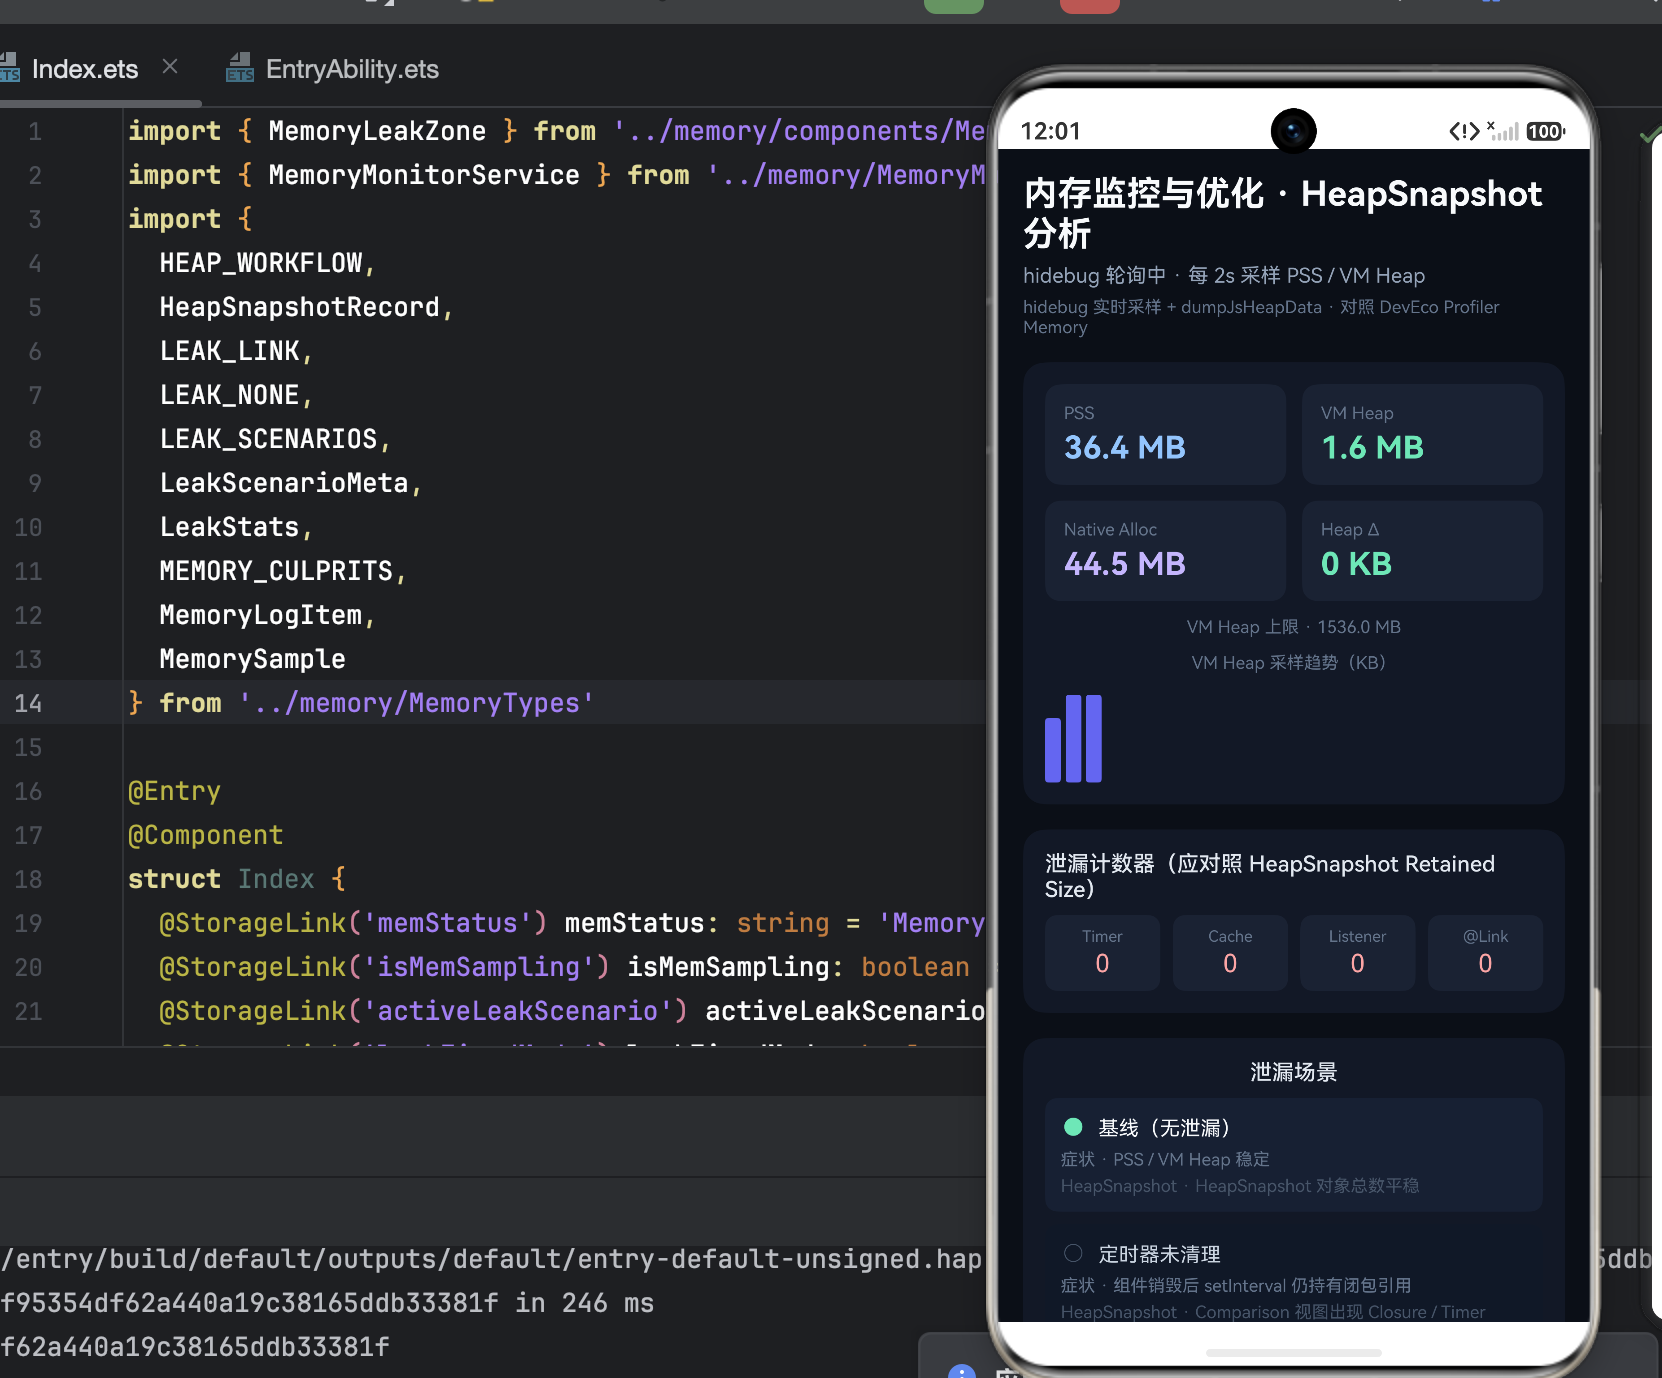
}
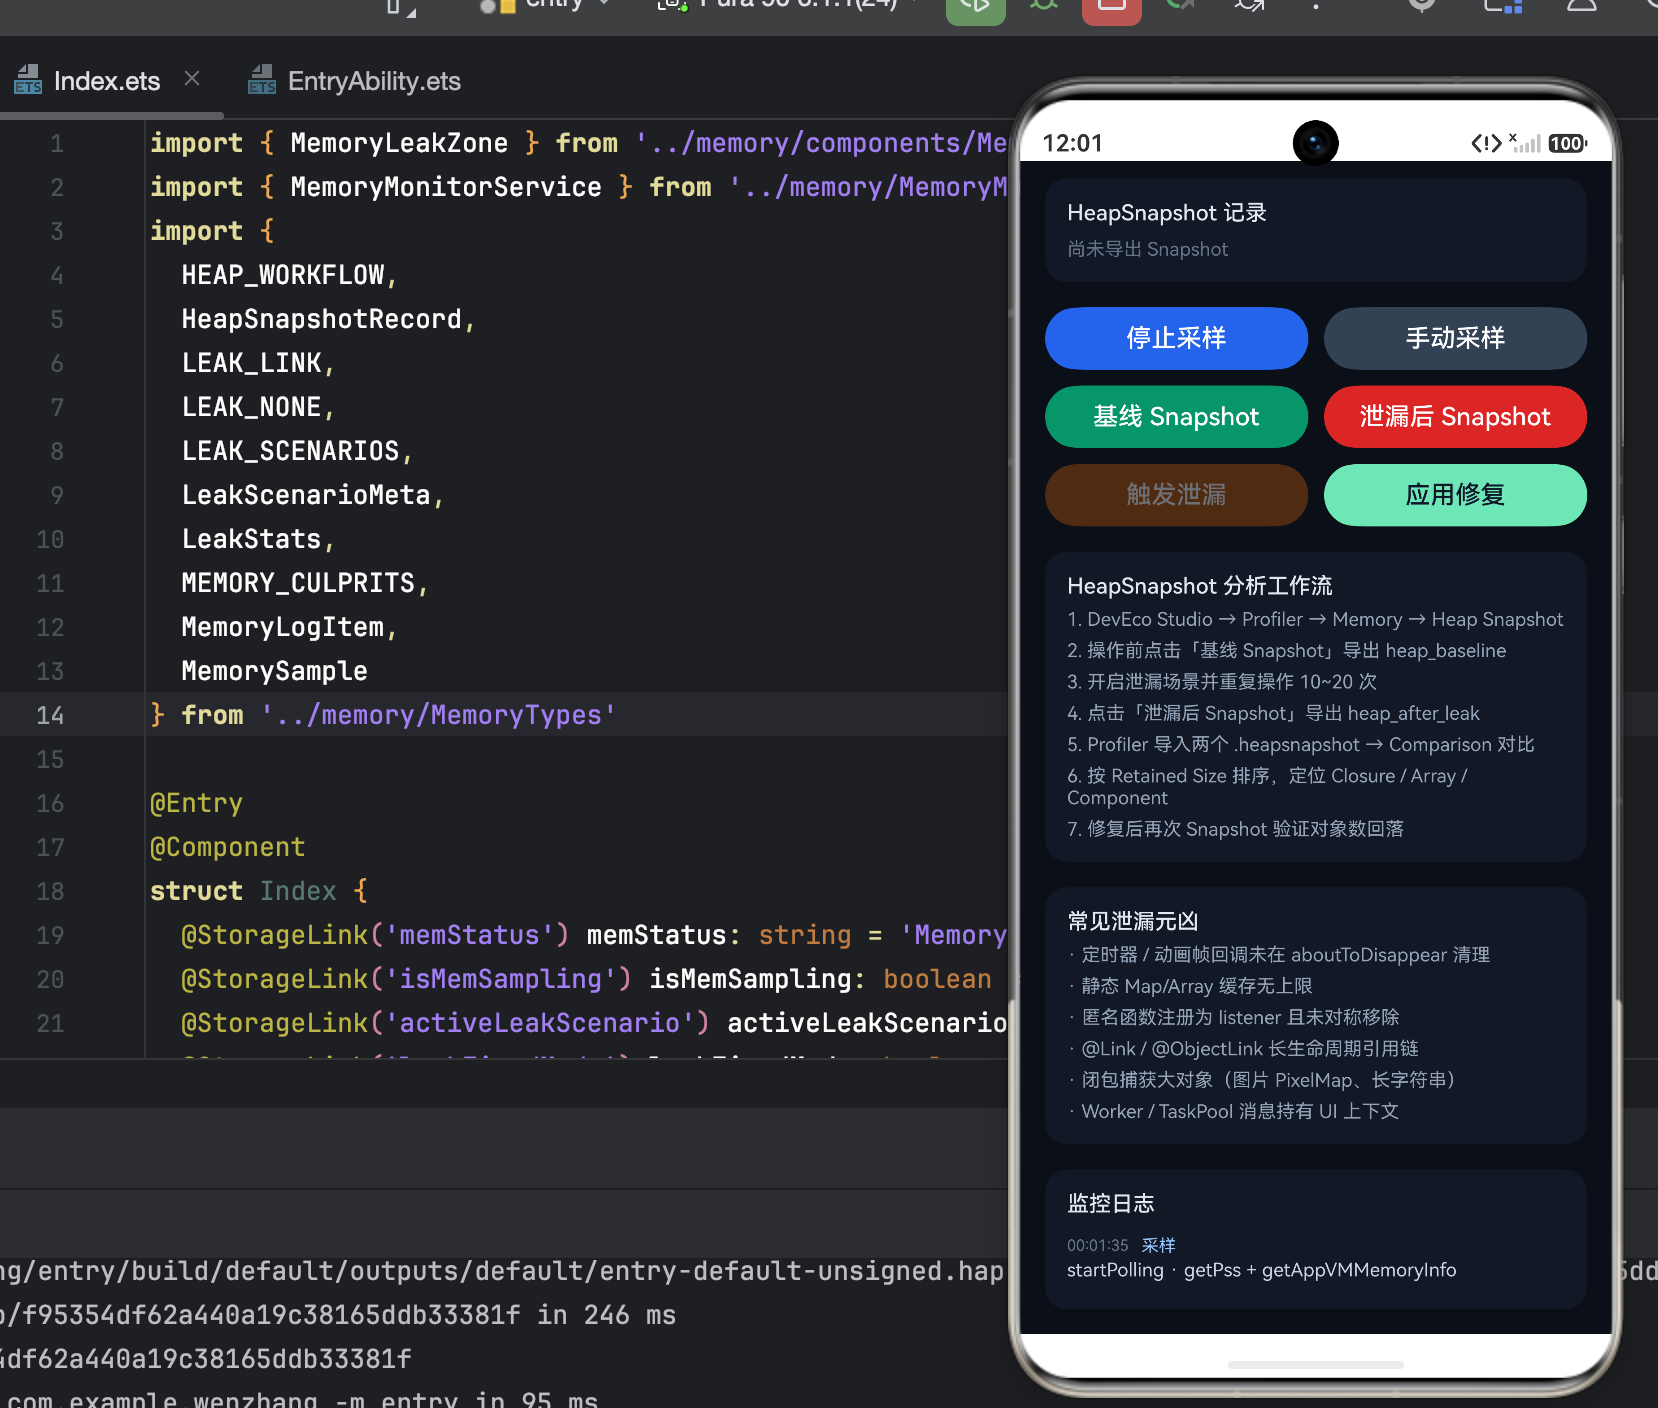
九、总结:性能分析工具的"四层架构"
这个页面展示了性能分析工具的典型分层:
| 层级 | 组件 | 职责 |
|---|---|---|
| 数据采集层 | FrameProfilerService | 每帧采集 FPS、帧耗时、线程状态 |
| 状态管理层 | AppStorage + @StorageLink | 13 个状态变量的双向绑定 |
| 视觉编码层 | MetricCard、FrameBarChart、颜色函数 | 将数字映射为颜色、高度、文字 |
| 交互控制层 | ScenarioSection、ActionSection | 场景选择、阻塞注入、采样启停 |
四层之间通过单向数据流连接:
Service 采集数据 → 写入 AppStorage → @StorageLink 触发 UI 更新 → 颜色/高度函数重新计算 → 界面重绘