凌晨告警轰炸!Go 服务协程只增不减,内存持续暴涨直至 OOM
读完本文你将收获:
- 如何用 pprof 快速定位协程泄漏
sync.Once单例的正确打开方式- 协程泄漏的通用排查思路
背景
最近在项目中遇到一个诡异的问题:服务运行后,协程数量持续增长,一直没有减少的迹象,这要是一直跑下去,这不得干爆内存。遂 pprof 采样分析一番,成功定位到了问题根源。
问题发现
在非高峰期,服务上线后,正常进行问题巡检,在监控大盘上发现服务的协程数量不太正常,协程数量一直在增长,环比昨日的协程数量对比了一下,感觉有内存泄露,这个要是不管,凌晨指定要被告警给炸翻(补充:楼主做的是国际化业务)。便用 pprof 进行了一下采样,采样结果大致如下。
bash
# 第一次采样 (00:15)
goroutine profile: total 737

# 5分钟后第二次采样 (00:20)
goroutine profile: total 1655

# 5分钟内增长了 928 个协程
两次采样的 Top 2 都指向了同样的调用栈:
bash
313 @ pool.(*HealthChecker).scanLoop           # 连接池后台健康检查
312 @ registry.(*Watcher).subscribeNotify      # 注册中心变更监听
很明显,这两个地方在不断产生新的协程,且从未被回收。从代码层面溯源了一下,发现写的调用下游的factory,每次调用都会New一个factory,然后就会固定产生两个协程,就是上面两个协程,一直不会释放。很明显,这个factory应该当做单例来用。而不是每次调用都New一个。
问题抽象
把复杂的业务逻辑剥离后,问题的本质其实很简单:
每次请求都创建一个重量级对象,该对象内部会启动后台协程,但用完后从未关闭。
就像一个快递站,每次有人来取快递就新建一个仓库并雇佣一个管理员,但取完快递后仓库和管理员都不管了。
复现 Demo
泄漏版本
go
package main

import (
	"fmt"
	"log"
	"net/http"
	_ "net/http/pprof"
	"runtime"
	"sync"
	"time"
)

// ========== 连接池(模拟)==========
// 负责管理一组连接,内部启动后台协程定期扫描健康状态

type HealthChecker struct {
	done      chan struct{}
	closeOnce sync.Once
}

func NewHealthChecker() *HealthChecker {
	h := &HealthChecker{
		done: make(chan struct{}),
	}
	// ⚠️ 启动后台协程:定期扫描连接健康状态
	go h.scanLoop()
	return h
}

func (h *HealthChecker) scanLoop() {
	ticker := time.NewTicker(500 * time.Millisecond)
	defer ticker.Stop()

	for {
		select {
		case <-ticker.C:
			// 模拟:检查每个连接的存活状态
			_ = "scanning connections"
		case <-h.done:
			return
		}
	}
}

func (h *HealthChecker) Close() {
	h.closeOnce.Do(func() {
		close(h.done)
	})
}

// ========== 服务监听器(模拟)==========
// 负责监听注册中心的服务变更,内部启动后台协程持续监听

type ServiceWatcher struct {
	done      chan struct{}
	closeOnce sync.Once
}

func NewServiceWatcher() *ServiceWatcher {
	w := &ServiceWatcher{
		done: make(chan struct{}),
	}
	// ⚠️ 启动后台协程:持续监听服务变更通知
	go w.subscribeNotify()
	return w
}

func (w *ServiceWatcher) subscribeNotify() {
	ticker := time.NewTicker(1 * time.Second)
	defer ticker.Stop()
	for {
		select {
		case <-ticker.C:
			// 模拟:接收注册中心推送的服务变更
			_ = "receiving notification"
		case <-w.done:
			return
		}
	}
}

func (w *ServiceWatcher) Close() {
	w.closeOnce.Do(func() {
		close(w.done)
	})
}

// ========== 客户端(问题所在)==========

type APIClient struct {
	checker *HealthChecker
	watcher *ServiceWatcher
}

// ❌ 每次调用都创建新的客户端,且从不关闭
func NewAPIClient(target string) *APIClient {
	return &APIClient{
		checker: NewHealthChecker(),
		watcher: NewServiceWatcher(),
	}
}

// ========== HTTP 服务 ==========

func handler(w http.ResponseWriter, r *http.Request) {
	// ❌ 每个请求都创建新的客户端,内部启动两个协程
	client := NewAPIClient("backend-service")
	_ = client
	w.Write([]byte("ok"))
	// ❌ 函数结束,client 被丢弃,但内部协程永远不会退出
}

func main() {
	// pprof 端点
	go func() {
		log.Println(http.ListenAndServe(":6060", nil))
	}()

	// 业务服务
	http.HandleFunc("/api", handler)
	go http.ListenAndServe(":8080", nil)

	// 监控协程数量
	go func() {
		for {
			time.Sleep(5 * time.Second)
			fmt.Printf("[监控] 当前协程数: %d\n", runtime.NumGoroutine())
		}
	}()

	select {}
}
复现与排查
1. 运行泄漏版本
bash
# 终端1:启动服务(保持运行,别关)
go run main.go
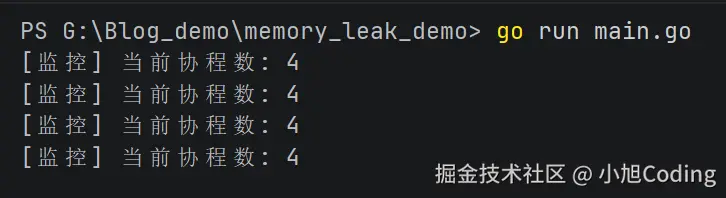
启动后控制台输出(稳态基线 ~4 个协程):
2. pprof 采样基线(发请求前)
在发起压测之前,先抓一次 pprof,记录正常的协程状态作为对比基准:
bash
# 查看协程总数
# Linux / Mac:
curl -s http://localhost:6060/debug/pprof/goroutine?debug=1 | head -1
# Windows PowerShell:
curl.exe -s http://localhost:6060/debug/pprof/goroutine?debug=1
输出:

yaml
goroutine profile: total 6💡 小知识:pprof 显示的协程数比控制台打印多 2 个是正常的。 这多出来的 2 个是 pprof 处理你这次查询请求时临时创建的协程(handler + 连接读取),请求结束即释放。稳态协程数以控制台打印为准。
3. 发起压测
bash
# 终端2:新开终端,发送请求
# Linux / Mac:
for i in {1..1000}; do curl -s http://localhost:8080/api > /dev/null; done
# Windows PowerShell(必须用 curl.exe,不能用 alias curl):
for ($i=1; $i -le 1000; $i++) { curl.exe -s http://localhost:8080/api > $null }
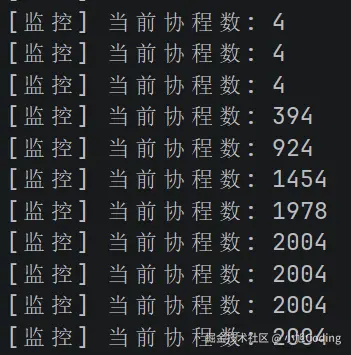
控制台协程数持续增长:
4. 再次 pprof 确认泄漏点
压测完成后再次采样,与基线对比:
bash
# 查看协程总数
# Linux / Mac:
curl -s http://localhost:6060/debug/pprof/goroutine?debug=1 | head -1
# Windows PowerShell:
curl.exe -s http://localhost:6060/debug/pprof/goroutine?debug=1

# 查看协程调用栈(会看到大量 scanLoop 和 subscribeNotify)
# Linux / Mac:
curl -s http://localhost:6060/debug/pprof/goroutine?debug=2 | grep -E "scanLoop|subscribeNotify"
# Windows PowerShell(用 Select-String 代替 grep):
curl.exe -s http://localhost:6060/debug/pprof/goroutine?debug=2 | Select-String "scanLoop|subscribeNotify"
输出:
bash
PS G:\Blog_demo\memory_leak_demo> curl.exe -s http://localhost:6060/debug/pprof/goroutine?debug=1
goroutine profile: total 2006
1000 @ 0x7ff723cf8d6e 0x7ff723cd7b45 0x7ff723ee8045 0x7ff723d00cc1
#       0x7ff723ee8044  main.(*HealthChecker).scanLoop+0xa4     G:/Blog_demo/memory_leak_demo/main.go:66

1000 @ 0x7ff723cf8d6e 0x7ff723cd7b45 0x7ff723ee82a5 0x7ff723d00cc1
#       0x7ff723ee82a4  main.(*ServiceWatcher).subscribeNotify+0xa4     G:/Blog_demo/memory_leak_demo/main.go:111
对比结论: total 从 6 → 2006,1000 次请求 = 2000 个泄漏协程(每次 NewAPIClient 产生 2 个)。调用栈全部指向 scanLoop 和 subscribeNotify,问题代码一目了然。
修复方案对比
排查到问题后,有三种修复思路:
| 方案 | 代码改动 | 适用场景 |
|---|---|---|
| 缓存复用 | 小 | 目标固定的场景(本文示例) |
| 请求级别生命周期 | 中 | 每次用完即可释放:defer client.Close() |
| 连接池 | 大 | 高并发、多目标,类似 sync.Pool |
其中最简单直接的方式就是给 APIClient 加上 Close() 方法,调用方用 defer 保证释放:
go
func handler(w http.ResponseWriter, r *http.Request) {
    client := NewAPIClient("backend-service")
    defer client.Close()  // ✅ 用完即释放,内部协程正常退出
    w.Write([]byte("ok"))
}
不过本文的场景是每次请求都用到同一个 target 的 client,适合用缓存复用(单例)的方案。
修复版本
核心思路:复用而非每次创建 ------用 sync.Once 做单例,全局只创建一次,所有请求共用。
go
package main

import (
	"fmt"
	"log"
	"net/http"
	_ "net/http/pprof"
	"runtime"
	"sync"
	"time"
)

// ========== 连接池 ==========

type HealthChecker struct {
	done      chan struct{}
	closeOnce sync.Once
}

func NewHealthChecker() *HealthChecker {
	h := &HealthChecker{done: make(chan struct{})}
	go h.scanLoop()
	return h
}

func (h *HealthChecker) scanLoop() {
	ticker := time.NewTicker(500 * time.Millisecond)
	defer ticker.Stop()
	for {
		select {
		case <-ticker.C:
		case <-h.done:
			return
		}
	}
}

func (h *HealthChecker) Close() {
	h.closeOnce.Do(func() {
		close(h.done)
	})
}

// ========== 服务监听器 ==========

type ServiceWatcher struct {
	done      chan struct{}
	closeOnce sync.Once
}

func NewServiceWatcher() *ServiceWatcher {
	w := &ServiceWatcher{done: make(chan struct{})}
	go w.subscribeNotify()
	return w
}

func (w *ServiceWatcher) subscribeNotify() {
	ticker := time.NewTicker(1 * time.Second)
	defer ticker.Stop()
	for {
		select {
		case <-ticker.C:
		case <-w.done:
			return
		}
	}
}

func (w *ServiceWatcher) Close() {
	w.closeOnce.Do(func() {
		close(w.done)
	})
}

// ========== 客户端(修复后)==========

type APIClient struct {
	checker *HealthChecker
	watcher *ServiceWatcher
}

func (c *APIClient) Close() {
	c.checker.Close()
	c.watcher.Close()
}

// ========== 客户端缓存(核心修复)==========

var (
	client *APIClient
	once   sync.Once
)

// ✅ 单例模式:全局只创建一次,所有请求复用
func GetClient() *APIClient {
	once.Do(func() {
		client = &APIClient{
			checker: NewHealthChecker(),
			watcher: NewServiceWatcher(),
		}
	})
	return client
}

// ========== HTTP 服务 ==========

func handler(w http.ResponseWriter, r *http.Request) {
	// ✅ 获取单例,复用已有客户端
	client := GetClient()
	_ = client
	w.Write([]byte("ok"))
}

func main() {
	go func() {
		log.Println(http.ListenAndServe(":6060", nil))
	}()

	http.HandleFunc("/api", handler)
	go http.ListenAndServe(":8080", nil)

	go func() {
		for {
			time.Sleep(5 * time.Second)
			fmt.Printf("[监控] 当前协程数: %d\n", runtime.NumGoroutine())
		}
	}()

	select {}
}
修复后验证
bash
# 终端1:启动修复后的服务(保持运行,别关)
go run fix.go
压测前监控日志:

压测前Pprof采样:
bash
# Windows PowerShell:
curl.exe -s http://localhost:6060/debug/pprof/goroutine?debug=1
bash
PS G:\Blog_demo\memory_leak_demo> curl.exe -s http://localhost:6060/debug/pprof/goroutine?debug=1
goroutine profile: total 6
1 @ 0x7ff7ddcb84d1 0x7ff7ddcf7bbd 0x7ff7ddeca811 0x7ff7ddeca625 0x7ff7ddec748b 0x7ff7ddee260a 0x7ff7ddee30ba 0x7ff7ddea2ca9 0x7ff7ddea4b27 0x7ff7ddeabb2e 0x7ff7ddea1165 0x7ff7ddd00cc1
#       0x7ff7ddeca810  runtime/pprof.writeRuntimeProfile+0xb0  D:/golang_study_place/pkg/mod/golang.org/toolchain@v0.0.1-go1.25.11.windows-amd64/src/runtime/pprof/pprof.go:788
#       0x7ff7ddeca624  runtime/pprof.writeGoroutine+0x44       D:/golang_study_place/pkg/mod/golang.org/toolchain@v0.0.1-go1.25.11.windows-amd64/src/runtime/pprof/pprof.go:747
执行压测:
bash
# 终端2:新开终端,发送请求
# Linux / Mac:
for i in {1..1000}; do curl -s http://localhost:8080/api > /dev/null; done
# Windows PowerShell(必须用 curl.exe,不能用 alias curl):
for ($i=1; $i -le 1000; $i++) { curl.exe -s http://localhost:8080/api > $null }
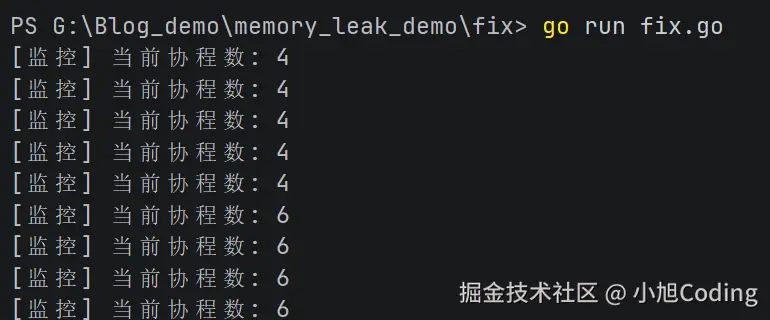
观察输出 ------ 协程数不再疯狂增长:
 pprof采样:

bash
PS G:\Blog_demo\memory_leak_demo> curl.exe -s http://localhost:6060/debug/pprof/goroutine?debug=1
goroutine profile: total 8
1 @ 0x7ff62c3284d1 0x7ff62c367bbd 0x7ff62c53a811 0x7ff62c53a625 0x7ff62c53748b 0x7ff62c55260a 0x7ff62c5530ba 0x7ff62c512ca9 0x7ff62c514b27 0x7ff62c51bb2e 0x7ff62c511165 0x7ff62c370cc1
#       0x7ff62c53a810  runtime/pprof.writeRuntimeProfile+0xb0  D:/golang_study_place/pkg/mod/golang.org/toolchain@v0.0.1-go1.25.11.windows-amd64/src/runtime/pprof/pprof.go:788
#       0x7ff62c53a624  runtime/pprof.writeGoroutine+0x44       D:/golang_study_place/pkg/mod/golang.org/toolchain@v0.0.1-go1.25.11.windows-amd64/src/runtime/pprof/pprof.go:747
协程数变化解读
修复版本中协程数的变化是一次性的,体现的是"首次创建即复用"的正常行为:
| 阶段 | 控制台 NumGoroutine() |
pprof total |
说明 |
|---|---|---|---|
| 启动后 | 4 | 6 | 稳态基线(main + pprof + 业务 + 监控),pprof 多 2 个临时协程 |
| 首次请求后 | 6 | 8 | sync.Once 触发,创建单例 client,内部启动 scanLoop 和 subscribeNotify(+2) |
| 1000 次请求后 | 6 | 8 | 所有请求复用同一个 client,不再新增协程 ✓ |
对比泄漏版本: 泄漏版本每次请求 +2 且永不回收,1000 次 → +2000;修复版本仅首次 +2,之后恒定。这就是"单例复用" vs "每次 New 不回收" 的本质区别。
排查思路总结
发现问题 → 采样分析 → 对比确认 → 追踪代码 → 修复验证
   │           │           │           │           │
   ▼           ▼           ▼           ▼           ▼
 监控告警    pprof     间隔采样    定位创建点   压测验证
 协程数量    goroutine  确认持续    没有回收    协程数
 异常增长    快照       增长        逻辑        稳定
关键教训
谁创建了后台协程,谁就必须提供关闭方法,并且要在合适的时机被调用。
开发中需要留意的模式:
- 🔒 包含
go func()的结构体,必须有对应的Close()或Stop()方法 - 📦 工厂函数创建的对象,要明确其生命周期由谁管理
- 🧪 定期用
runtime.NumGoroutine()做冒烟测试