第4章 4.12 Prometheus + Alertmanager 高可用完整笔记
4.12.1 Prometheus 高可用
一、环境准备
#所有节点设置主机名
# 192.168.24.61 执行:
hostnamectl set-hostname prometheus-01
# 192.168.24.62 执行:
hostnamectl set-hostname prometheus-02
# 192.168.24.63 执行:
hostnamectl set-hostname prometheus-03

# 所有节点配置 hosts 解析(避免 DNS 依赖)
cat >> /etc/hosts << EOF
192.168.24.61 prometheus-01
192.168.24.62 prometheus-02
192.168.24.63 prometheus-03
EOF

#所有节点放行防火墙端口
firewall-cmd --add-port=9090/tcp --permanent   # Prometheus Web
firewall-cmd --add-port=9093/tcp --permanent   # Alertmanager Web
firewall-cmd --add-port=9094/tcp --permanent   # Alertmanager Gossip 集群
firewall-cmd --add-port=9100/tcp --permanent   # Node Exporter
firewall-cmd --add-port=3000/tcp --permanent   # Grafana
firewall-cmd --reload

# 所有节点创建专用用户
useradd -M -s /sbin/nologin prometheus
mkdir -p /opt/monitor/{prometheus,alertmanager,rules}
chown -R prometheus:prometheus /opt/monitor/
二、安装组件
在 1 台虚拟机 上安装好 prometheus、node_exporter、alertmanager、grafana 后,把二进制和配置拷贝到另外 2 台(或 3 台都按同样方式装)。
# 以 Prometheus为例
cd /tmp
wget https://github.com/prometheus/prometheus/releases/download/v2.51.2/prometheus-2.51.2.linux-amd64.tar.gz
tar -zxvf prometheus-2.51.2.linux-amd64.tar.gz
cp prometheus-2.51.2.linux-amd64/prometheus /opt/monitor/prometheus/
cp prometheus-2.51.2.linux-amd64/promtool /opt/monitor/prometheus/
chmod +x /opt/monitor/prometheus/prometheus /opt/monitor/prometheus/promtool
chown -R prometheus:prometheus /opt/monitor/prometheus/

也可以解压gz文件后直接使用解压目录
解压完目录:
[root@prometheus-01 prometheus]# ll
total 297008
-rw-r--r--. 1 prometheus prometheus     11357 Apr 27 22:35 LICENSE
-rw-r--r--. 1 prometheus prometheus      3773 Apr 27 22:35 NOTICE
-rwxr-xr-x. 1 prometheus prometheus 156367612 Apr 27 22:16 prometheus
-rw-r--r--. 1 prometheus prometheus      1093 Apr 27 22:35 prometheus.yml
-rwxr-xr-x. 1 prometheus prometheus 147745067 Apr 27 22:17 promtool
3台虚拟机都装rsync
[root@prometheus-01 monitor]# rsync -avz /opt/monitor/ root@192.168.24.63:/opt/monitor/| 参数 | 真实含义 | 容易误以为的意思 |
|---|---|---|
-a |
archive 模式(保留权限/时间/递归等) | "all" |
-v |
显示详细过程 | --- |
-z |
传输时压缩 | --- |
-f |
filter 过滤规则 | ❌ 误以为是 "file" |
-r |
递归(目录用) | --- |
-P |
显示进度 + 断点续传 | --- |
当然scp -r -p也行,但是scp只能将文件时间以及权限保留过去,所有者和所属组不行
| 参数 | 作用 |
|---|---|
-r |
递归复制目录(必须加,否则只复制单个文件) |
-P 22 |
指定 SSH 端口(大写 P,如果目标机器不是默认 22 端口要加) |
-p |
保留文件权限、修改时间 |
-C |
压缩传输,大文件更快 |
三、配置启动服务
教材只说了"配置好各自的启动服务"但没给文件,这里补全 3 个核心服务的 systemd 配置。
1. Prometheus 服务文件(所有节点通用)
路径:/usr/lib/systemd/system/prometheus.service
[Unit]
# 服务描述,systemctl status 时显示的名称
Description=Prometheus Server
# 声明本服务依赖网络完全就绪后再启动,避免网络未通就拉起导致失败
After=network-online.target
# 弱依赖:网络服务启动后,本服务也会被唤醒(与 After 配合使用)
Wants=network-online.target

[Service]
# 服务类型:simple 表示 ExecStart 启动的进程就是主进程,前台运行由 systemd 托管
Type=simple
# 指定运行用户为 prometheus(专用低权限账号,不用 root 更安全)
User=prometheus
# 指定运行用户组
Group=prometheus
# 工作目录:Prometheus 启动时的当前目录,相对路径会基于此解析
WorkingDirectory=/opt/monitor/prometheus
# 启动命令及参数(反斜杠 \ 表示换行续写,必须是行尾最后一个字符)
ExecStart=/opt/monitor/prometheus/prometheus \
  # 指定主配置文件路径
  --config.file=/opt/monitor/prometheus/prometheus.yml \
  # 指定 TSDB 本地数据存储目录(Prometheus 3.x 参数名为 --storage.tsdb.path)
  --storage.tsdb.path=/opt/monitor/prometheus/data \
  # Web 界面监听地址,0.0.0.0 表示监听所有网卡,端口 9090
  --web.listen-address=0.0.0.0:9090 \
  # 开启生命周期接口,支持 curl -X POST http://localhost:9090/-/reload 热加载配置
  --web.enable-lifecycle \
  # 数据保留时间,超过 30 天的旧数据自动清理
  --storage.tsdb.retention.time=30d
# 退出后自动重启:只有非正常退出(exit code ≠ 0)时才重启
Restart=on-failure
# 重启前等待 5 秒,避免频繁重启造成系统负担
RestartSec=5s
# 限制进程最大可打开文件数为 65536,防止采集目标多时文件句柄耗尽
LimitNOFILE=65536

[Install]
# 开机自启目标:执行 systemctl enable 时,把本服务挂到 multi-user.target 下
# 系统进入命令行多用户模式时会自动拉起本服务
WantedBy=multi-user.target
传输给别的虚拟机(略)
检测服务是否真的启动成功:
[root@prometheus-01 ~]# systemctl daemon-reload
[root@prometheus-01 ~]# systemctl start prometheus.service
[root@prometheus-01 ~]# systemctl status prometheus.service
● prometheus.service - Prometheus Server
     Loaded: loaded (/usr/lib/systemd/system/prometheus.service; disabl>
     Active: active (running) since Sun 2026-07-19 16:13:00 CST; 4s ago
 Invocation: 2ad24ef7c22c40cfabc8d44e42bc021e
   Main PID: 2939 (prometheus)
      Tasks: 9 (limit: 10172)
     Memory: 21.6M (peak: 21.9M)
        CPU: 32ms
     CGroup: /system.slice/prometheus.service
             └─2939 /opt/monitor/prometheus/prometheus --config.file=/o>

Jul 19 16:13:00 prometheus-01 prometheus[2939]: time=2026-07-19T16:13:0>
Jul 19 16:13:00 prometheus-01 prometheus[2939]: time=2026-07-19T16:13:0>
Jul 19 16:13:00 prometheus-01 prometheus[2939]: time=2026-07-19T16:13:0>
Jul 19 16:13:00 prometheus-01 prometheus[2939]: time=2026-07-19T16:13:0>
Jul 19 16:13:00 prometheus-01 prometheus[2939]: time=2026-07-19T16:13:0>
Jul 19 16:13:00 prometheus-01 prometheus[2939]: time=2026-07-19T16:13:0>
Jul 19 16:13:00 prometheus-01 prometheus[2939]: time=2026-07-19T16:13:0>
Jul 19 16:13:00 prometheus-01 prometheus[2939]: time=2026-07-19T16:13:0>
Jul 19 16:13:00 prometheus-01 prometheus[2939]: time=2026-07-19T16:13:0>
Jul 19 16:13:00 prometheus-01 prometheus[2939]: time=2026-07-19T16:13:0>


[root@prometheus-01 ~]# ss -lntup | grep 9090
tcp   LISTEN 0      4096               *:9090             *:*    users:(("prometheus",pid=2939,fd=6))
2. Node Exporter 服务文件(所有节点通用)
路径:/usr/lib/systemd/system/node_exporter.service
[root@prometheus-01 ~]# cat /usr/lib/systemd/system/node-exporter.service
[Unit]
Description=Node Exporter
After=network-online.target
Wants=network-online.target

[Service]
Type=simple
User=prometheus
Group=prometheus
ExecStart=/opt/monitor/node_exporter/node_exporter --web.listen-address=:9100
Restart=on-failure
RestartSec=5s

[Install]
WantedBy=multi-user.target
传输给别的虚拟机:
[root@prometheus-01 ~]# rsync -av /usr/lib/systemd/system/node-exporter.service root@192.168.24.62:/usr/lib/systemd/system/node-exporter.service
root@192.168.24.62's password:
sending incremental file list
node-exporter.service

sent 412 bytes  received 35 bytes  178.80 bytes/sec
total size is 294  speedup is 0.66
3. Alertmanager 服务文件
节点与节点之间略有不同,在后面配置
四、Prometheus 主配置文件
路径:/opt/monitor/prometheus/prometheus.yml
#################################### 全局配置 ####################################
global:
  scrape_interval: 15s          # 每15秒采集一次指标
  evaluation_interval: 15s       # 每15秒评估一次告警规则

#################################### 告警配置 ####################################
# 指定所有 Alertmanager 实例地址,Prometheus 自动负载均衡
alerting:
  alertmanagers:
    - static_configs:
        - targets:
            - '192.168.24.61:9093'   # Alertmanager 节点1
            - '192.168.24.62:9093'   # Alertmanager 节点2
            - '192.168.24.63:9093'   # Alertmanager 节点3

#################################### 告警规则文件 ####################################
rule_files:
  - "alert.yml"                  # 告警规则文件路径(相对于工作目录或绝对路径)

#################################### 采集任务配置 ####################################
scrape_configs:
  # 任务1:采集所有 Prometheus 自身指标(实现 Prometheus 高可用监控)
  - job_name: 'prometheus'
    static_configs:
      - targets:
          - '192.168.24.61:9090'   # 节点1 Prometheus
          - '192.168.24.62:9090'   # 节点2 Prometheus
          - '192.168.24.63:9090'   # 节点3 Prometheus

  # 任务2:采集所有 Alertmanager 自身指标
  - job_name: 'alertmanager'
    static_configs:
      - targets:
          - '192.168.24.61:9093'   # 节点1 Alertmanager
          - '192.168.24.62:9093'   # 节点2 Alertmanager
          - '192.168.24.63:9093'   # 节点3 Alertmanager

  # 任务3:采集所有节点的 Node Exporter 指标
  - job_name: 'node-exporter'
    static_configs:
      - targets: ['192.168.24.61:9100']   # 节点1 Node Exporter
        labels:
          instance: Prometheus01            # 实例标签,便于区分
      - targets: ['192.168.24.62:9100']   # 节点2 Node Exporter
        labels:
          instance: Prometheus02
      - targets: ['192.168.24.63:9100']   # 节点3 Node Exporter
        labels:
          instance: Prometheus03
传输给别的虚拟机节点
五、告警规则文件
路径:/opt/monitor/prometheus/alert.yml
groups:
- name: example-alerts
  rules:
    # 节点宕机告警
    - alert: NodeDown
      expr: up{job="node-exporter"} == 0   # up 指标为0表示目标不可达
      for: 1m                              # 持续1分钟才触发,避免抖动
      labels:
        severity: warning
      annotations:
        summary: "节点 {{ $labels.instance }} 离线"

    # Prometheus 自身宕机告警
    - alert: PrometheusDown
      expr: up{job="prometheus"} == 0
      for: 1m
      labels:
        severity: critical
      annotations:
        summary: "Prometheus 实例 {{ $labels.instance }} 离线"
传输给别的虚拟机节点
六、配置 Grafana 数据源
第一步:准备运行环境
# 1. 创建日志目录并赋权(Grafana 默认往 /var/log/grafana 写日志)
mkdir -p /var/log/grafana
chown -R prometheus:prometheus /var/log/grafana

# 2. 确认 grafana 目录属主正确
chown -R prometheus:prometheus /opt/monitor/grafana

# 3. SELinux 上下文修复(RHEL 10 默认 Enforcing,不修会被拦)
semanage fcontext -a -t bin_t "/opt/monitor/grafana/bin/grafana-server"
semanage fcontext -a -t var_lib_t "/opt/monitor/grafana/data(/.*)?"
restorecon -Rv /opt/monitor/grafana

selinux也可先行关闭
第二步:写 Grafana 配置文件
Grafana 自带 conf/defaults.ini,我们复制一份自定义配置,方便后续修改:
cp /opt/monitor/grafana/conf/defaults.ini /opt/monitor/grafana/conf/grafana.ini
chown prometheus:prometheus /opt/monitor/grafana/conf/grafana.ini
编辑 /opt/monitor/grafana/conf/grafana.ini,修改以下关键段(其余保持默认):
[server]
http_addr = 0.0.0.0          # 监听所有网卡,方便其他节点/浏览器访问
http_port = 3000             # 默认端口
domain = 192.168.24.61       # 填本机 IP,生成正确的访问链接
root_url = %(protocol)s://%(domain)s:%(http_port)s/

[paths]
data = /opt/monitor/grafana/data       # 数据目录(SQLite、会话等)
logs = /var/log/grafana                # 日志目录
plugins = /opt/monitor/grafana/data/plugins

[log]
mode = console file
level = info
传给别的虚拟机节点
第三步:写 Systemd 服务文件
路径:/usr/lib/systemd/system/grafana-server.service
[Unit]
Description=Grafana Server
# 依赖网络完全启动后再启动,避免网络未就绪导致绑定端口失败
After=network-online.target
# 弱依赖网络服务,网络起来后自动拉起本服务
Wants=network-online.target

[Service]
# 服务类型:simple 表示 ExecStart 启动的进程就是主进程,由 systemd 托管
Type=simple
# 运行用户:Grafana 不允许用 root 运行,必须用专用低权限用户
User=prometheus
Group=prometheus
# 工作目录:Grafana 的相对路径(public、data 等)基于此解析
WorkingDirectory=/opt/monitor/grafana
# 启动命令及参数,逐行注释
ExecStart=/opt/monitor/grafana/bin/grafana server \   #通过server子命令启动,而不是单纯依靠脚本文件启动
  --config=/opt/monitor/grafana/conf/grafana.ini \   # 指定配置文件路径
  --homepath=/opt/monitor/grafana                     # 指定家目录,用于找 public、data 等资源
# 非正常退出时自动重启
Restart=on-failure
# 重启前等待 5 秒,避免频繁重启造成系统负担
RestartSec=5s
# 最大打开文件数,防止大量图表渲染时句柄耗尽
LimitNOFILE=65536

[Install]
# 开机自启目标:enable 时挂到 multi-user.target 下,进入命令行模式自动拉起
WantedBy=multi-user.target
第四步:防火墙放行(前面这一步已经做了)
firewall-cmd --add-port=3000/tcp --permanent
firewall-cmd --reload
第五步:启动并验证
# 1. 重载 systemd 配置(让系统识别新服务文件)
systemctl daemon-reload

# 2. 启动并设置开机自启
systemctl enable --now grafana-server

# 3. 查看状态(确认 Active: active (running))
systemctl status grafana-server -l


[root@prometheus-01 bin]# systemctl status grafana-server -l
● grafana-server.service - Grafana Server
     Loaded: loaded (/usr/lib/systemd/system/grafana-server.service; di>
     Active: active (running) since Sun 2026-07-19 17:22:46 CST; 1min 5>
 Invocation: afd8f39895d54a54a46084960f2dfc9c
   Main PID: 4547 (grafana)
      Tasks: 16 (limit: 10172)
     Memory: 275.7M (peak: 334.5M)
        CPU: 2.994s
     CGroup: /system.slice/grafana-server.service
             └─4547 /opt/monitor/grafana/bin/grafana server --config=/o>

Jul 19 17:23:33 prometheus-01 grafana[4547]: logger=plugins.registratio>
Jul 19 17:23:33 prometheus-01 grafana[4547]: logger=plugin.backgroundin>
Jul 19 17:23:33 prometheus-01 grafana[4547]: logger=plugin.backgroundin>
Jul 19 17:23:52 prometheus-01 grafana[4547]: logger=plugin.installer t=>
Jul 19 17:23:52 prometheus-01 grafana[4547]: logger=installer.fs t=2026>
Jul 19 17:23:52 prometheus-01 grafana[4547]: logger=plugins.registratio>
Jul 19 17:23:52 prometheus-01 grafana[4547]: logger=plugin.backgroundin>
Jul 19 17:23:52 prometheus-01 grafana[4547]: logger=plugin.backgroundin>
Jul 19 17:23:53 prometheus-01 grafana[4547]: logger=plugin.installer t=>
Jul 19 17:23:53 prometheus-01 grafana[4547]: logger=plugin.elasticsearc>
[root@prometheus-01 bin]#
验证三件套:
# 看端口监听
ss -lntp | grep 3000

# 看日志有无报错
journalctl -u grafana-server -n 20 --no-pager

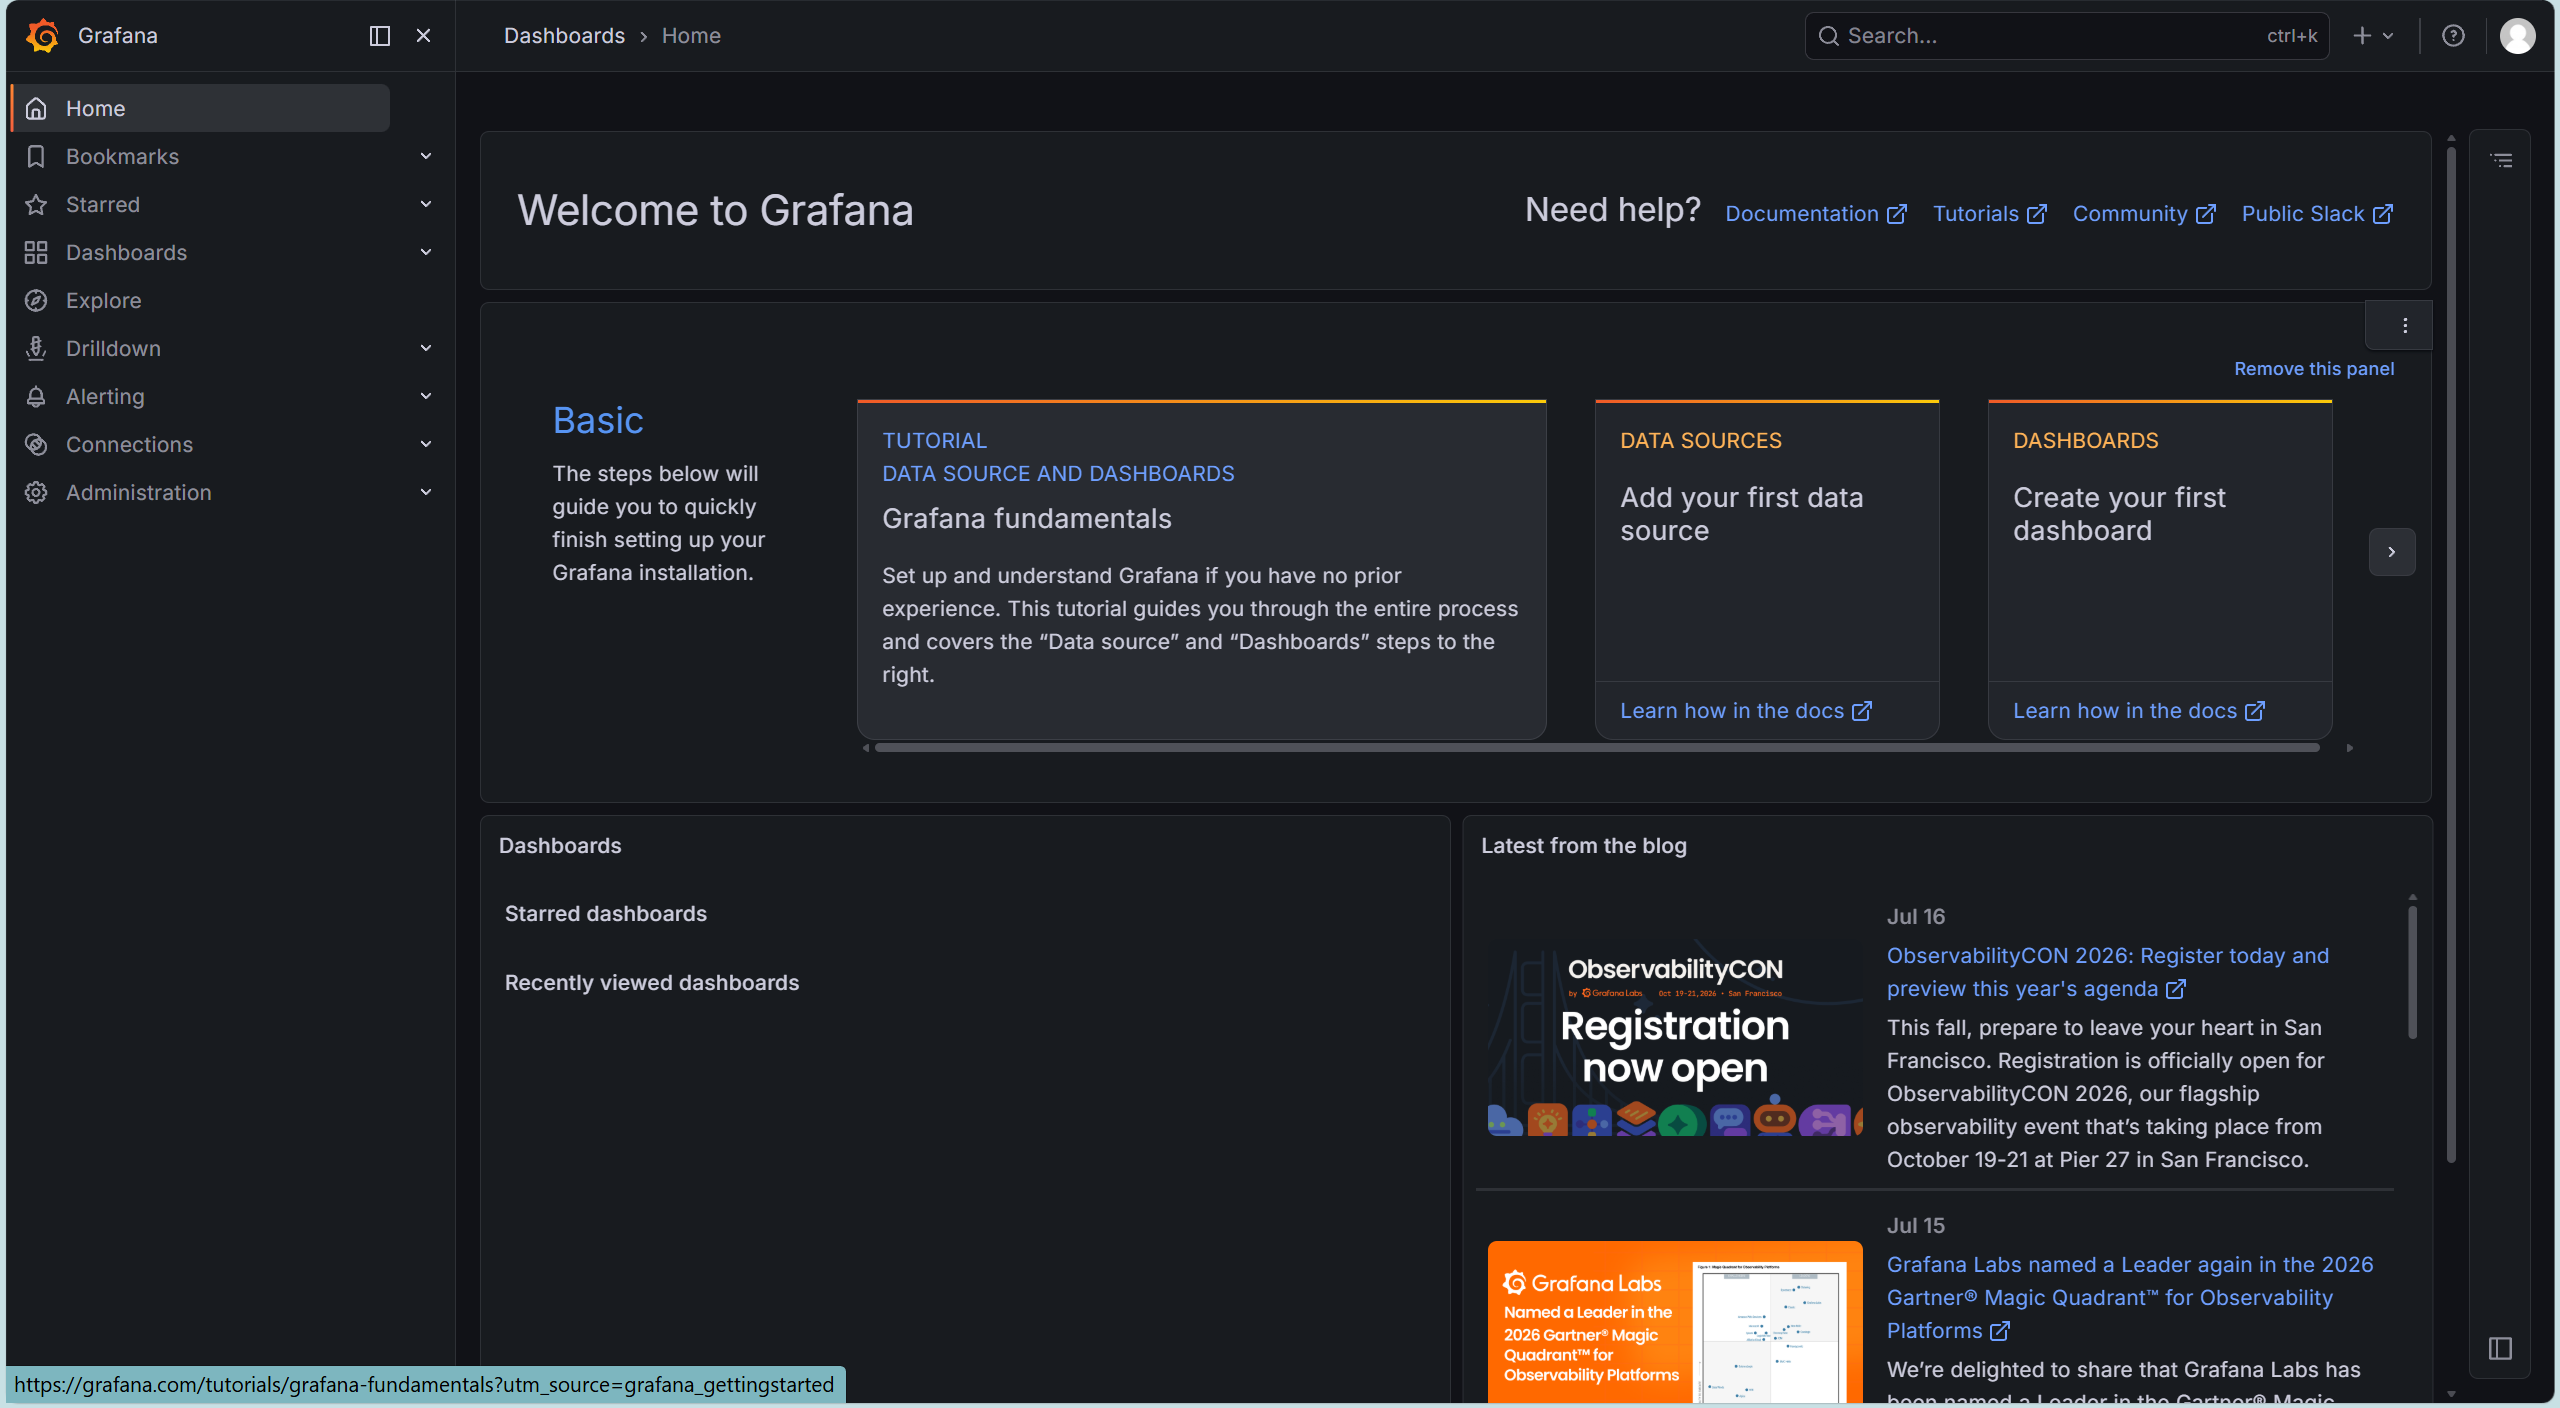
# 浏览器访问(确认能打开登录页)
# http://192.168.24.61:3000
默认账号 admin / 密码 admin,首次登录强制改密码。

第六步:服务起来后再配数据源
服务确认能访问之后,再去配数据源。你之前问的那份"配置 Grafana 数据源详细步骤"现在就能用了,两种方式任选:
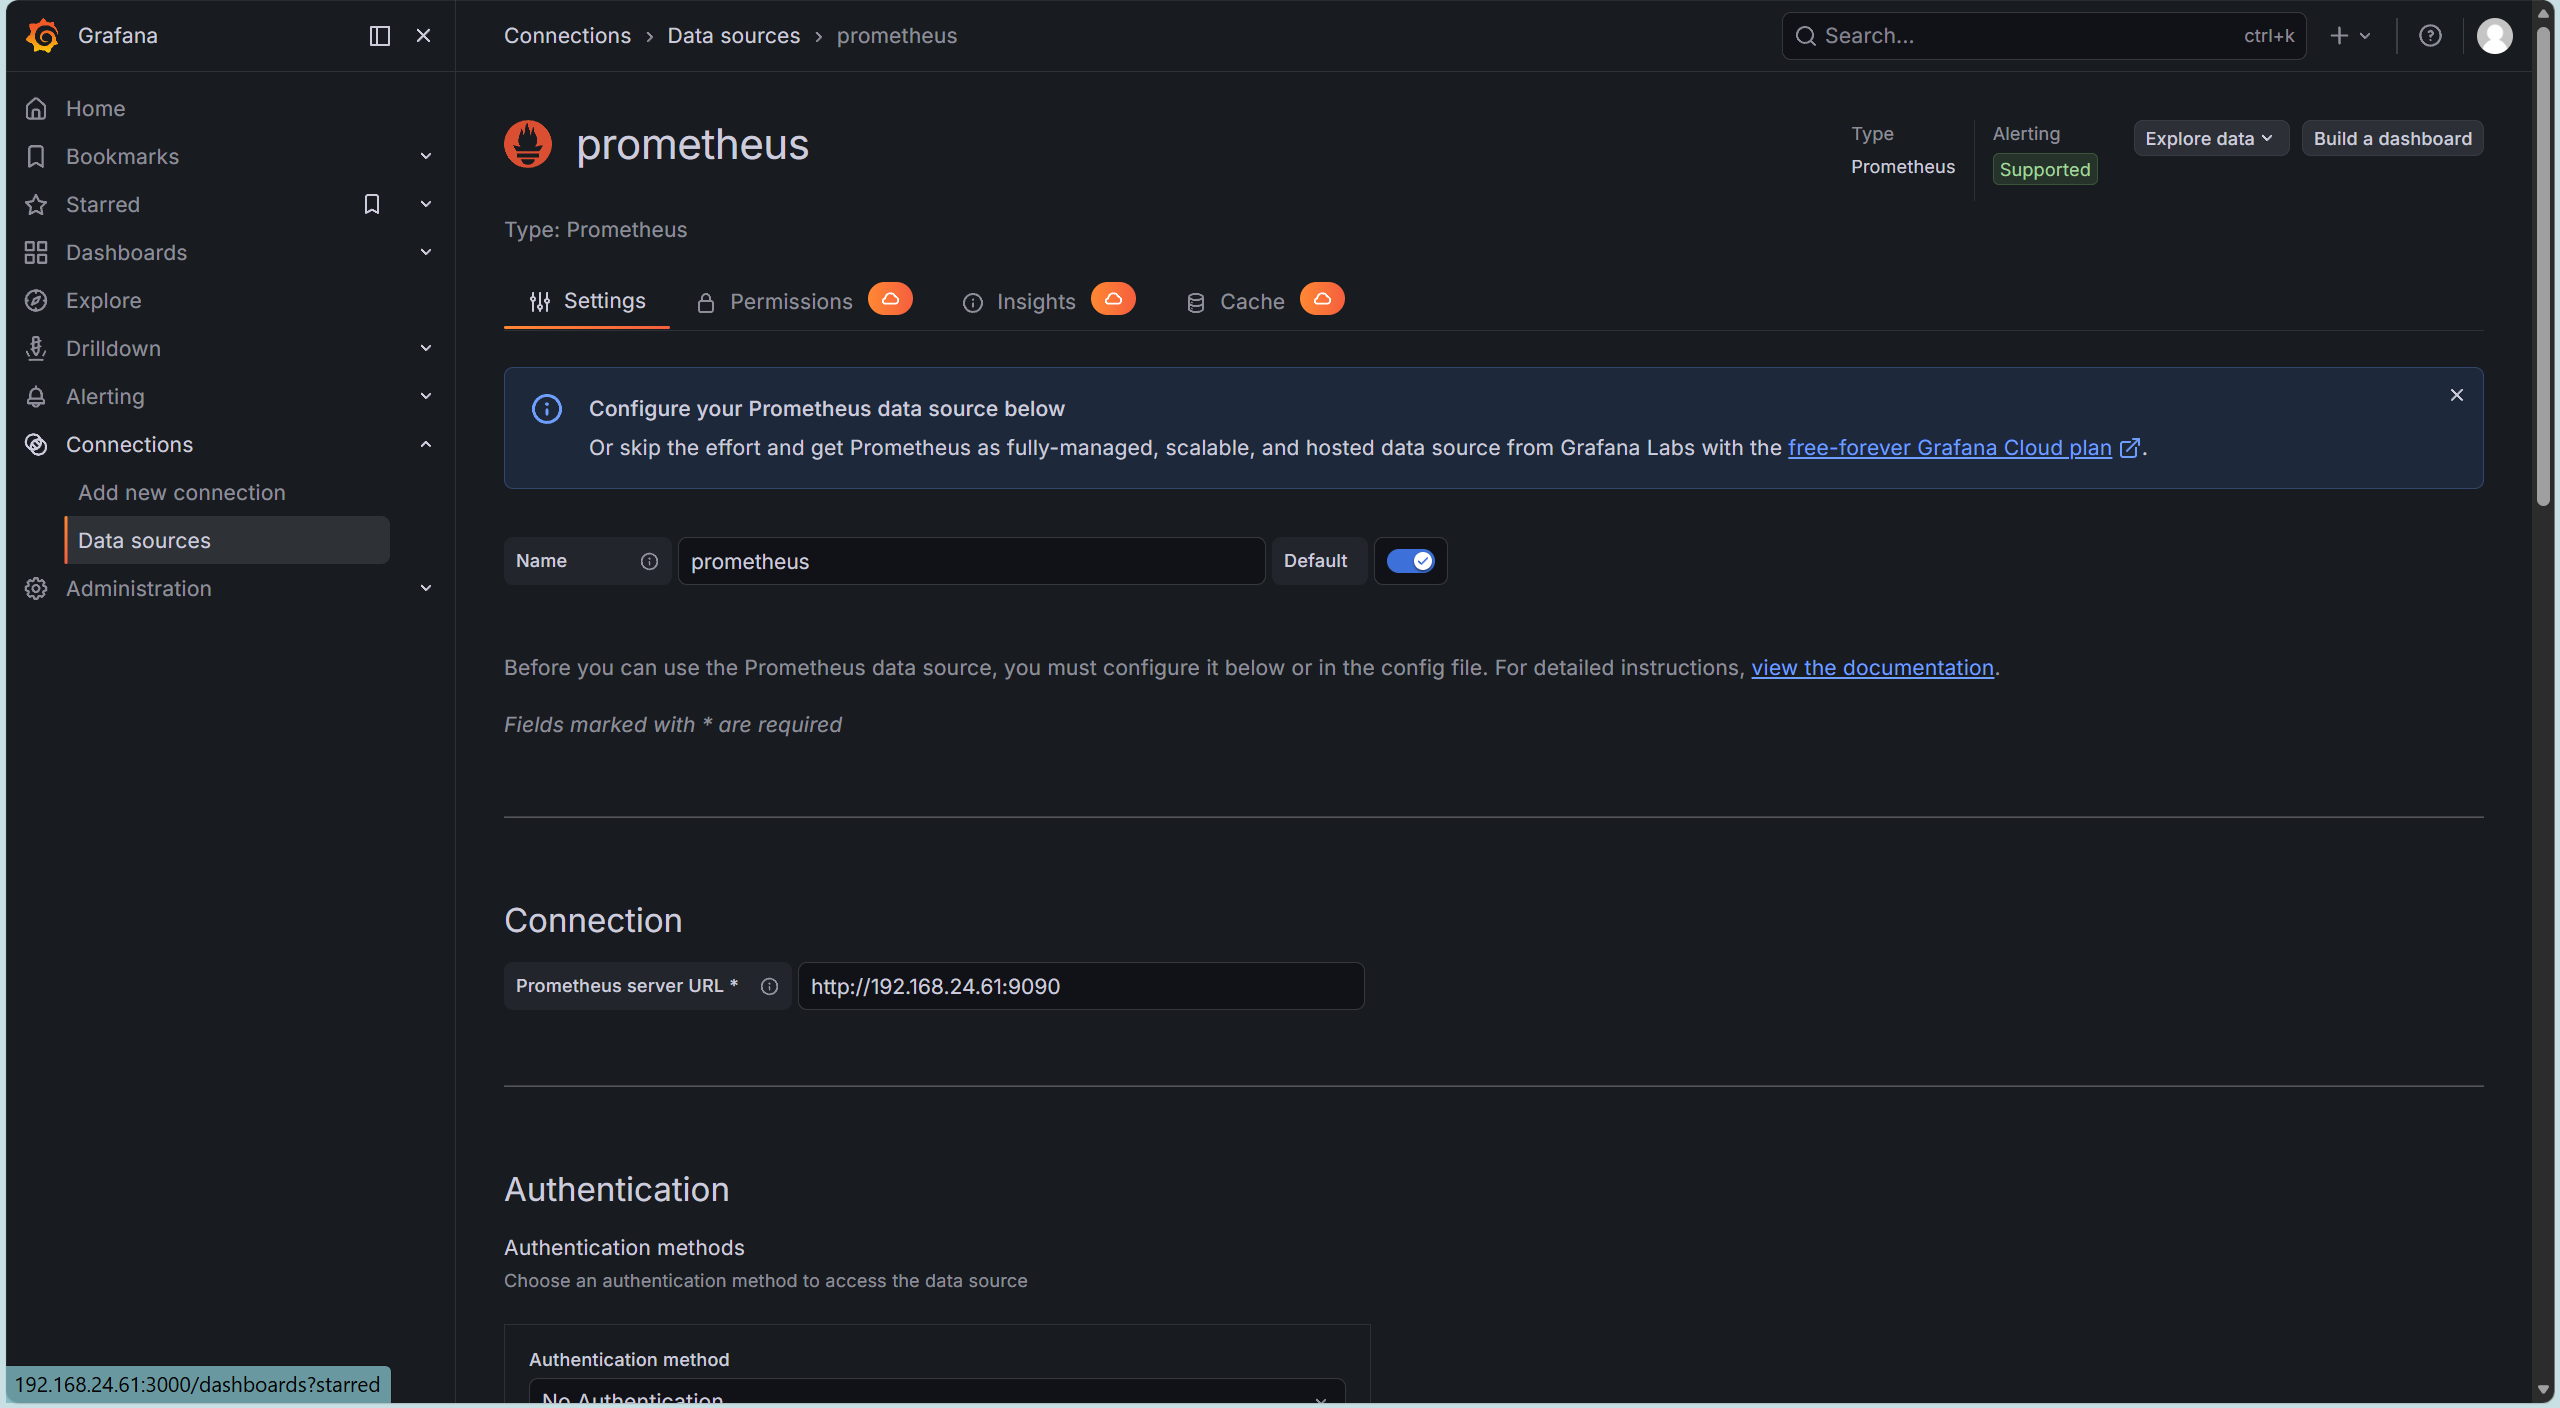
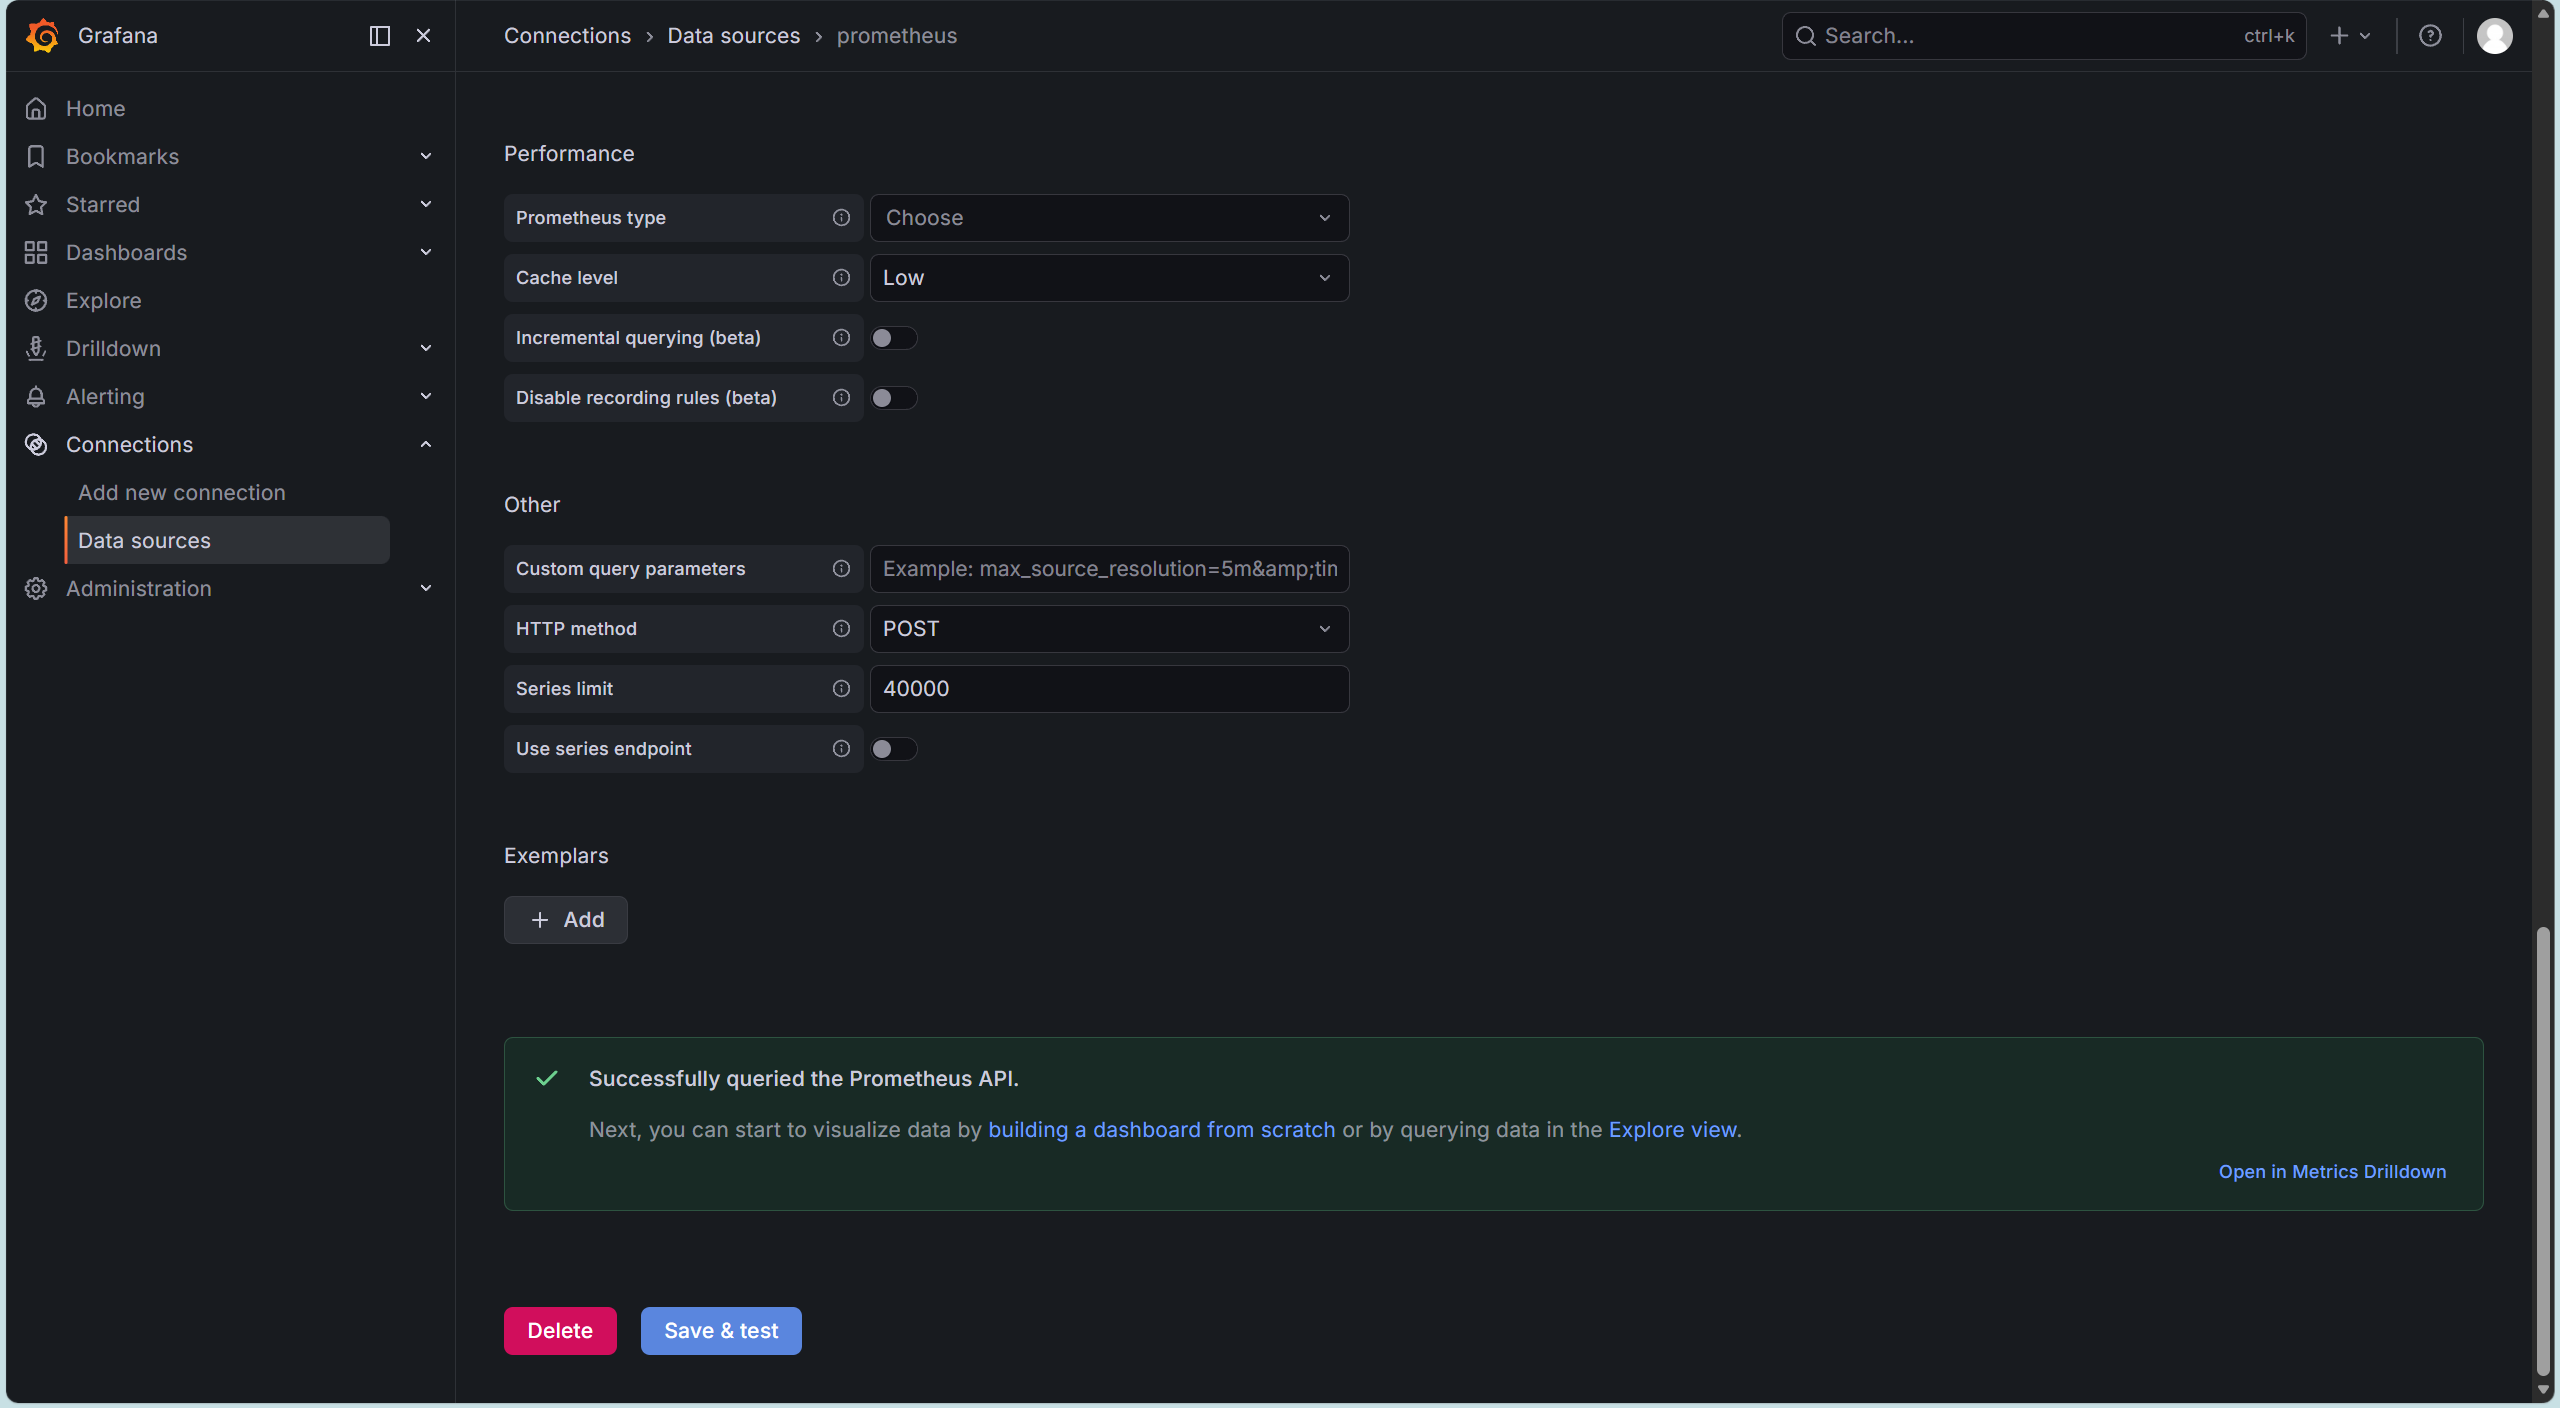
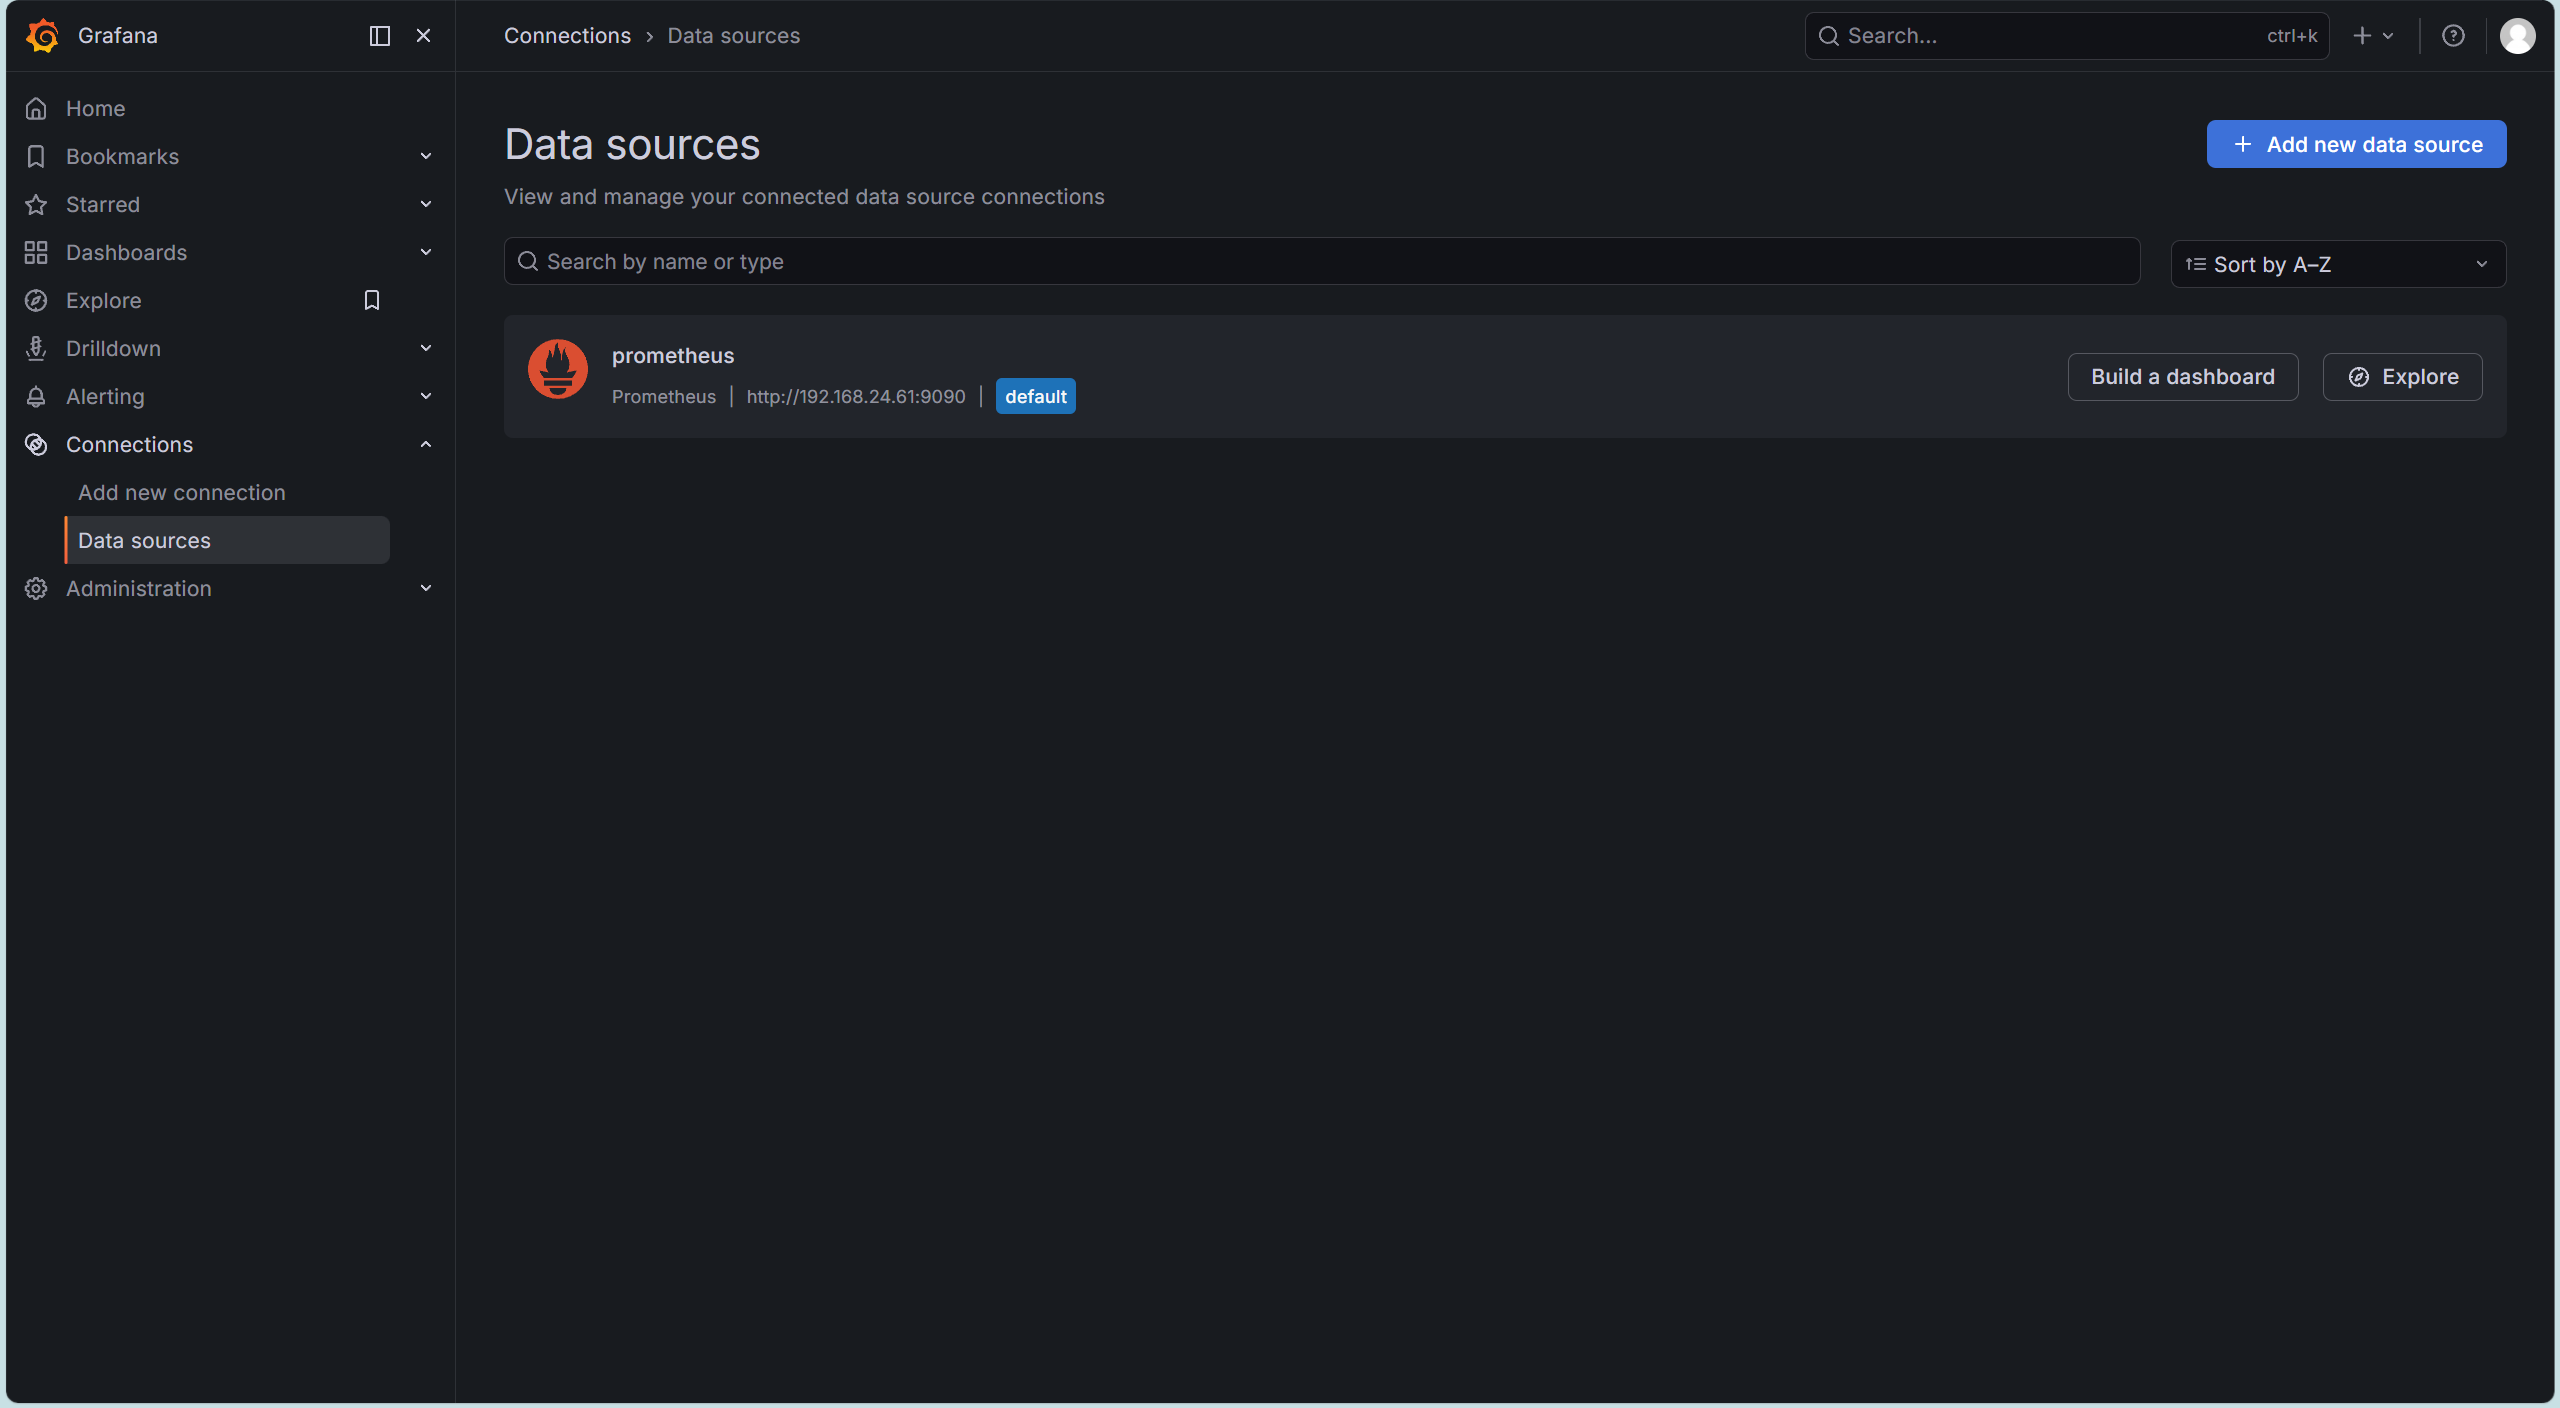
- 方式一(Web UI 手动点) :登录 → Connections → Data sources → Add Prometheus → 填
http://192.168.24.61:9090→ Save & test
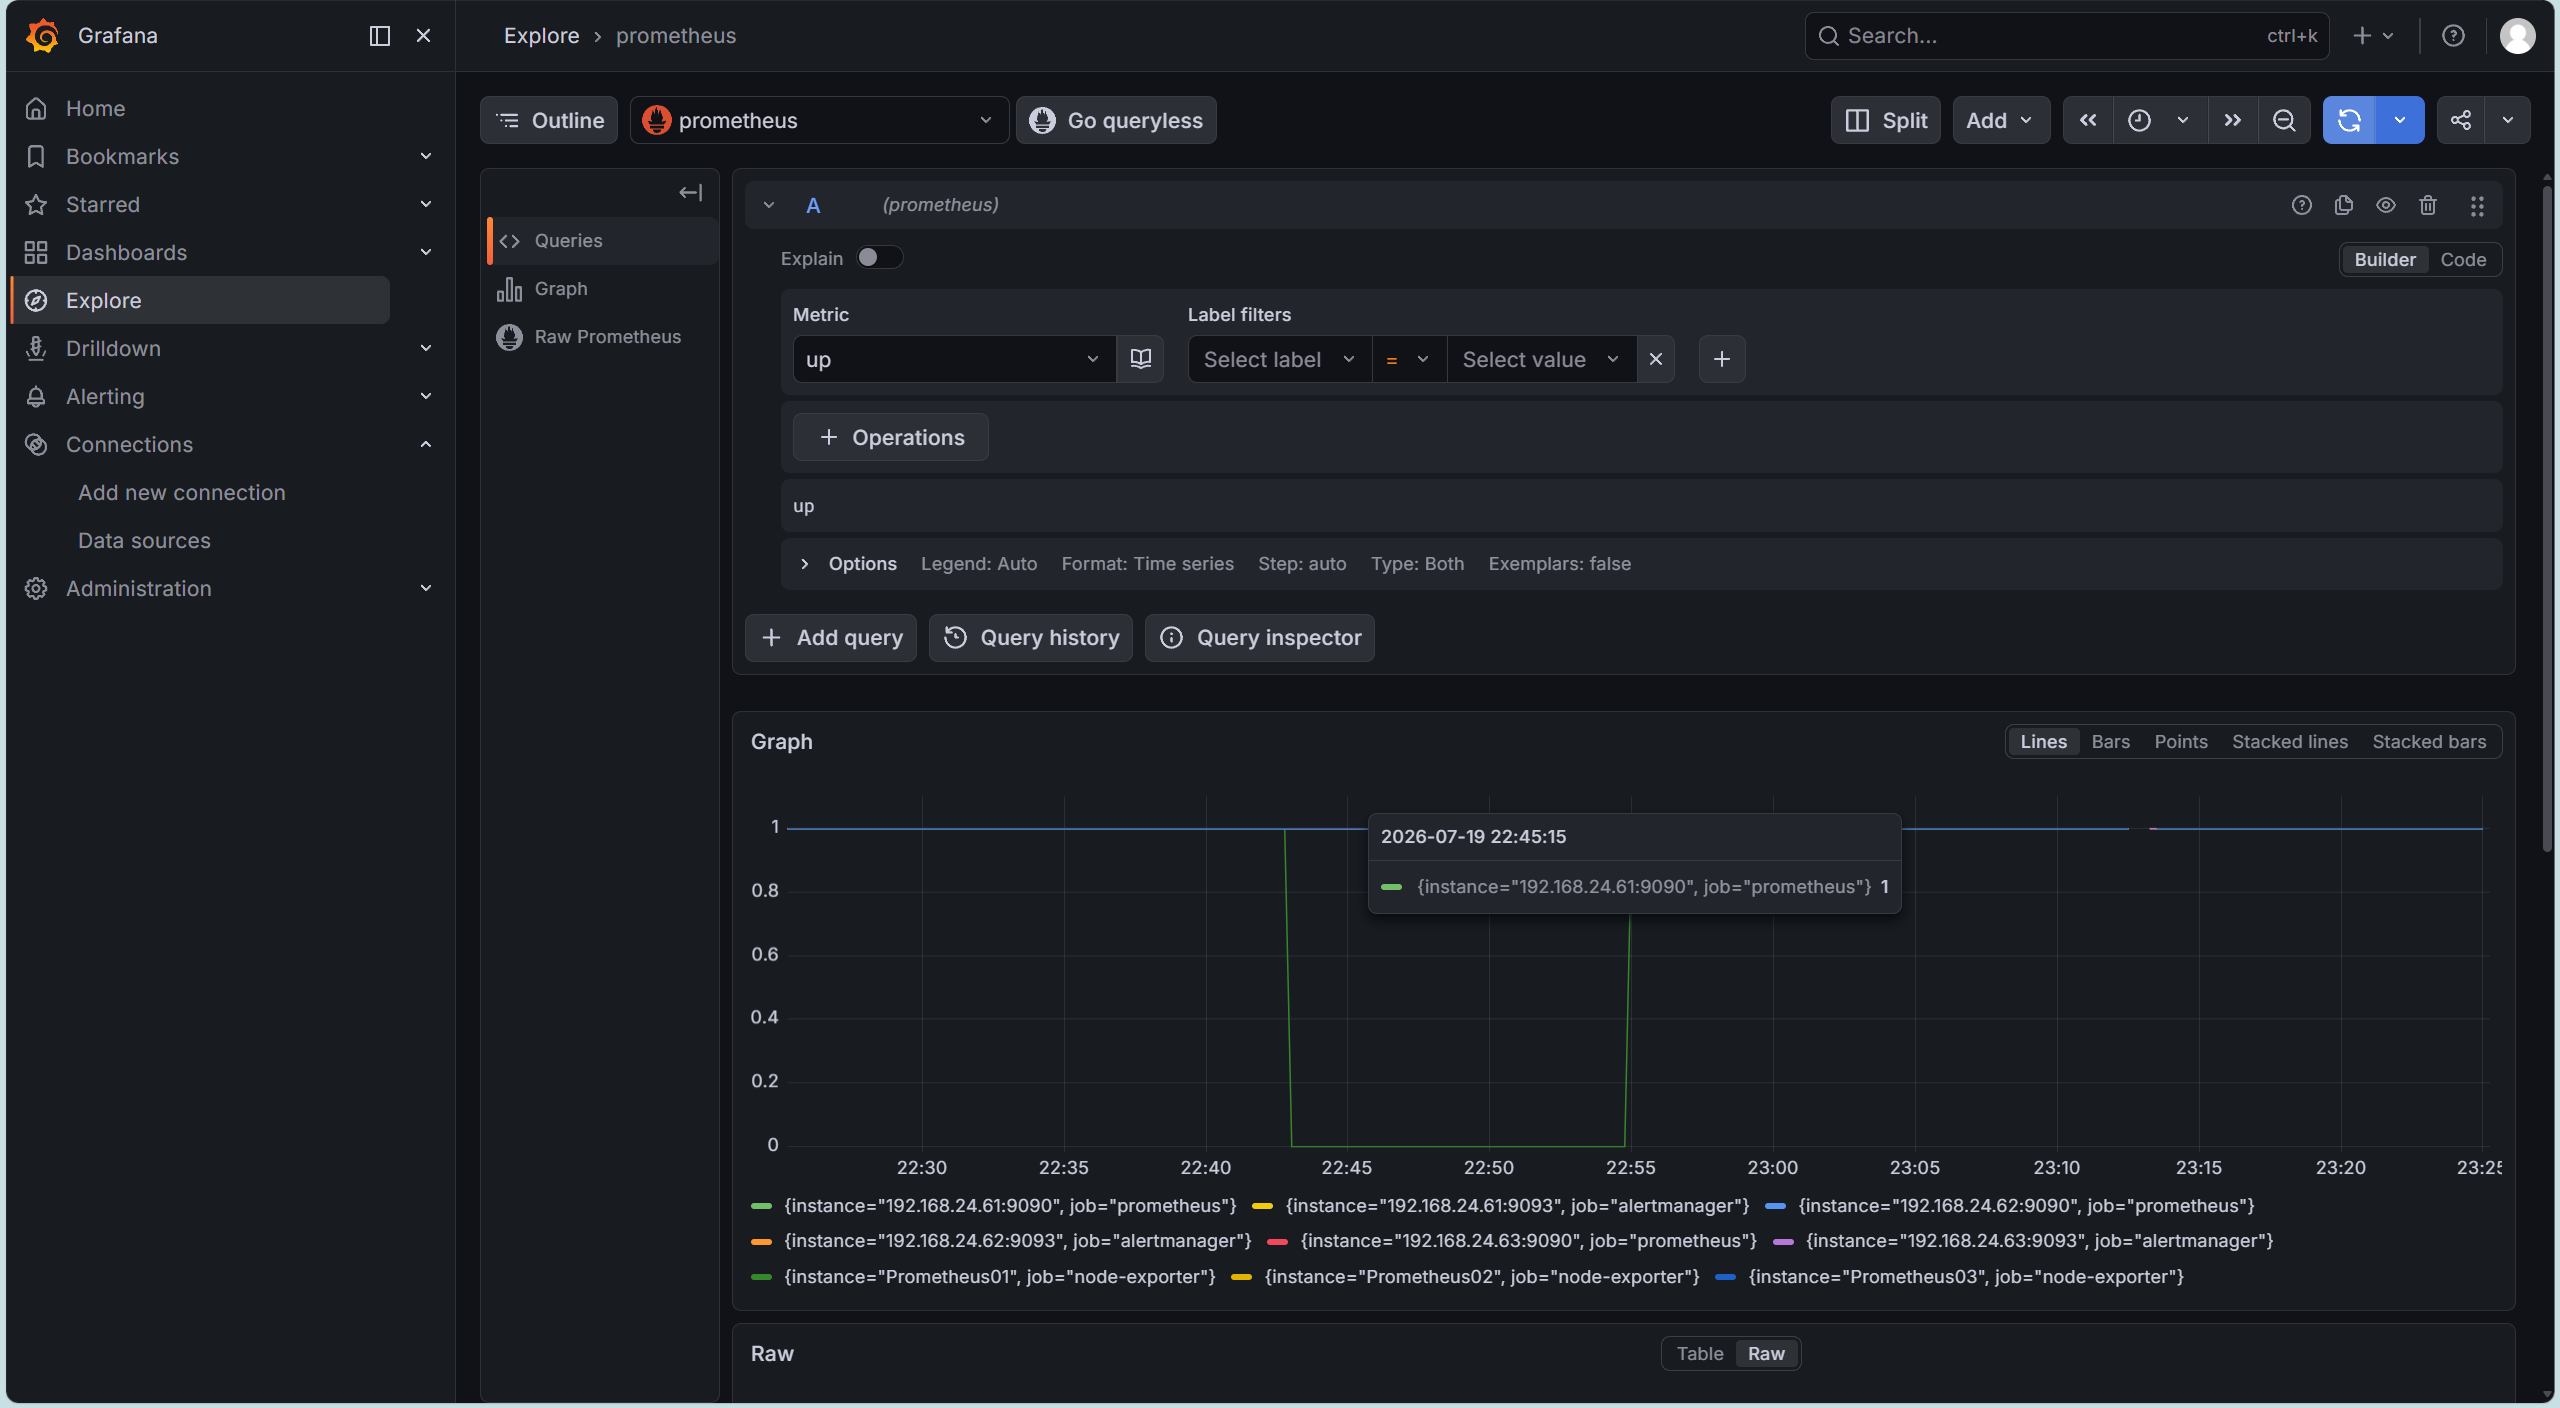
点击exporter,查询up
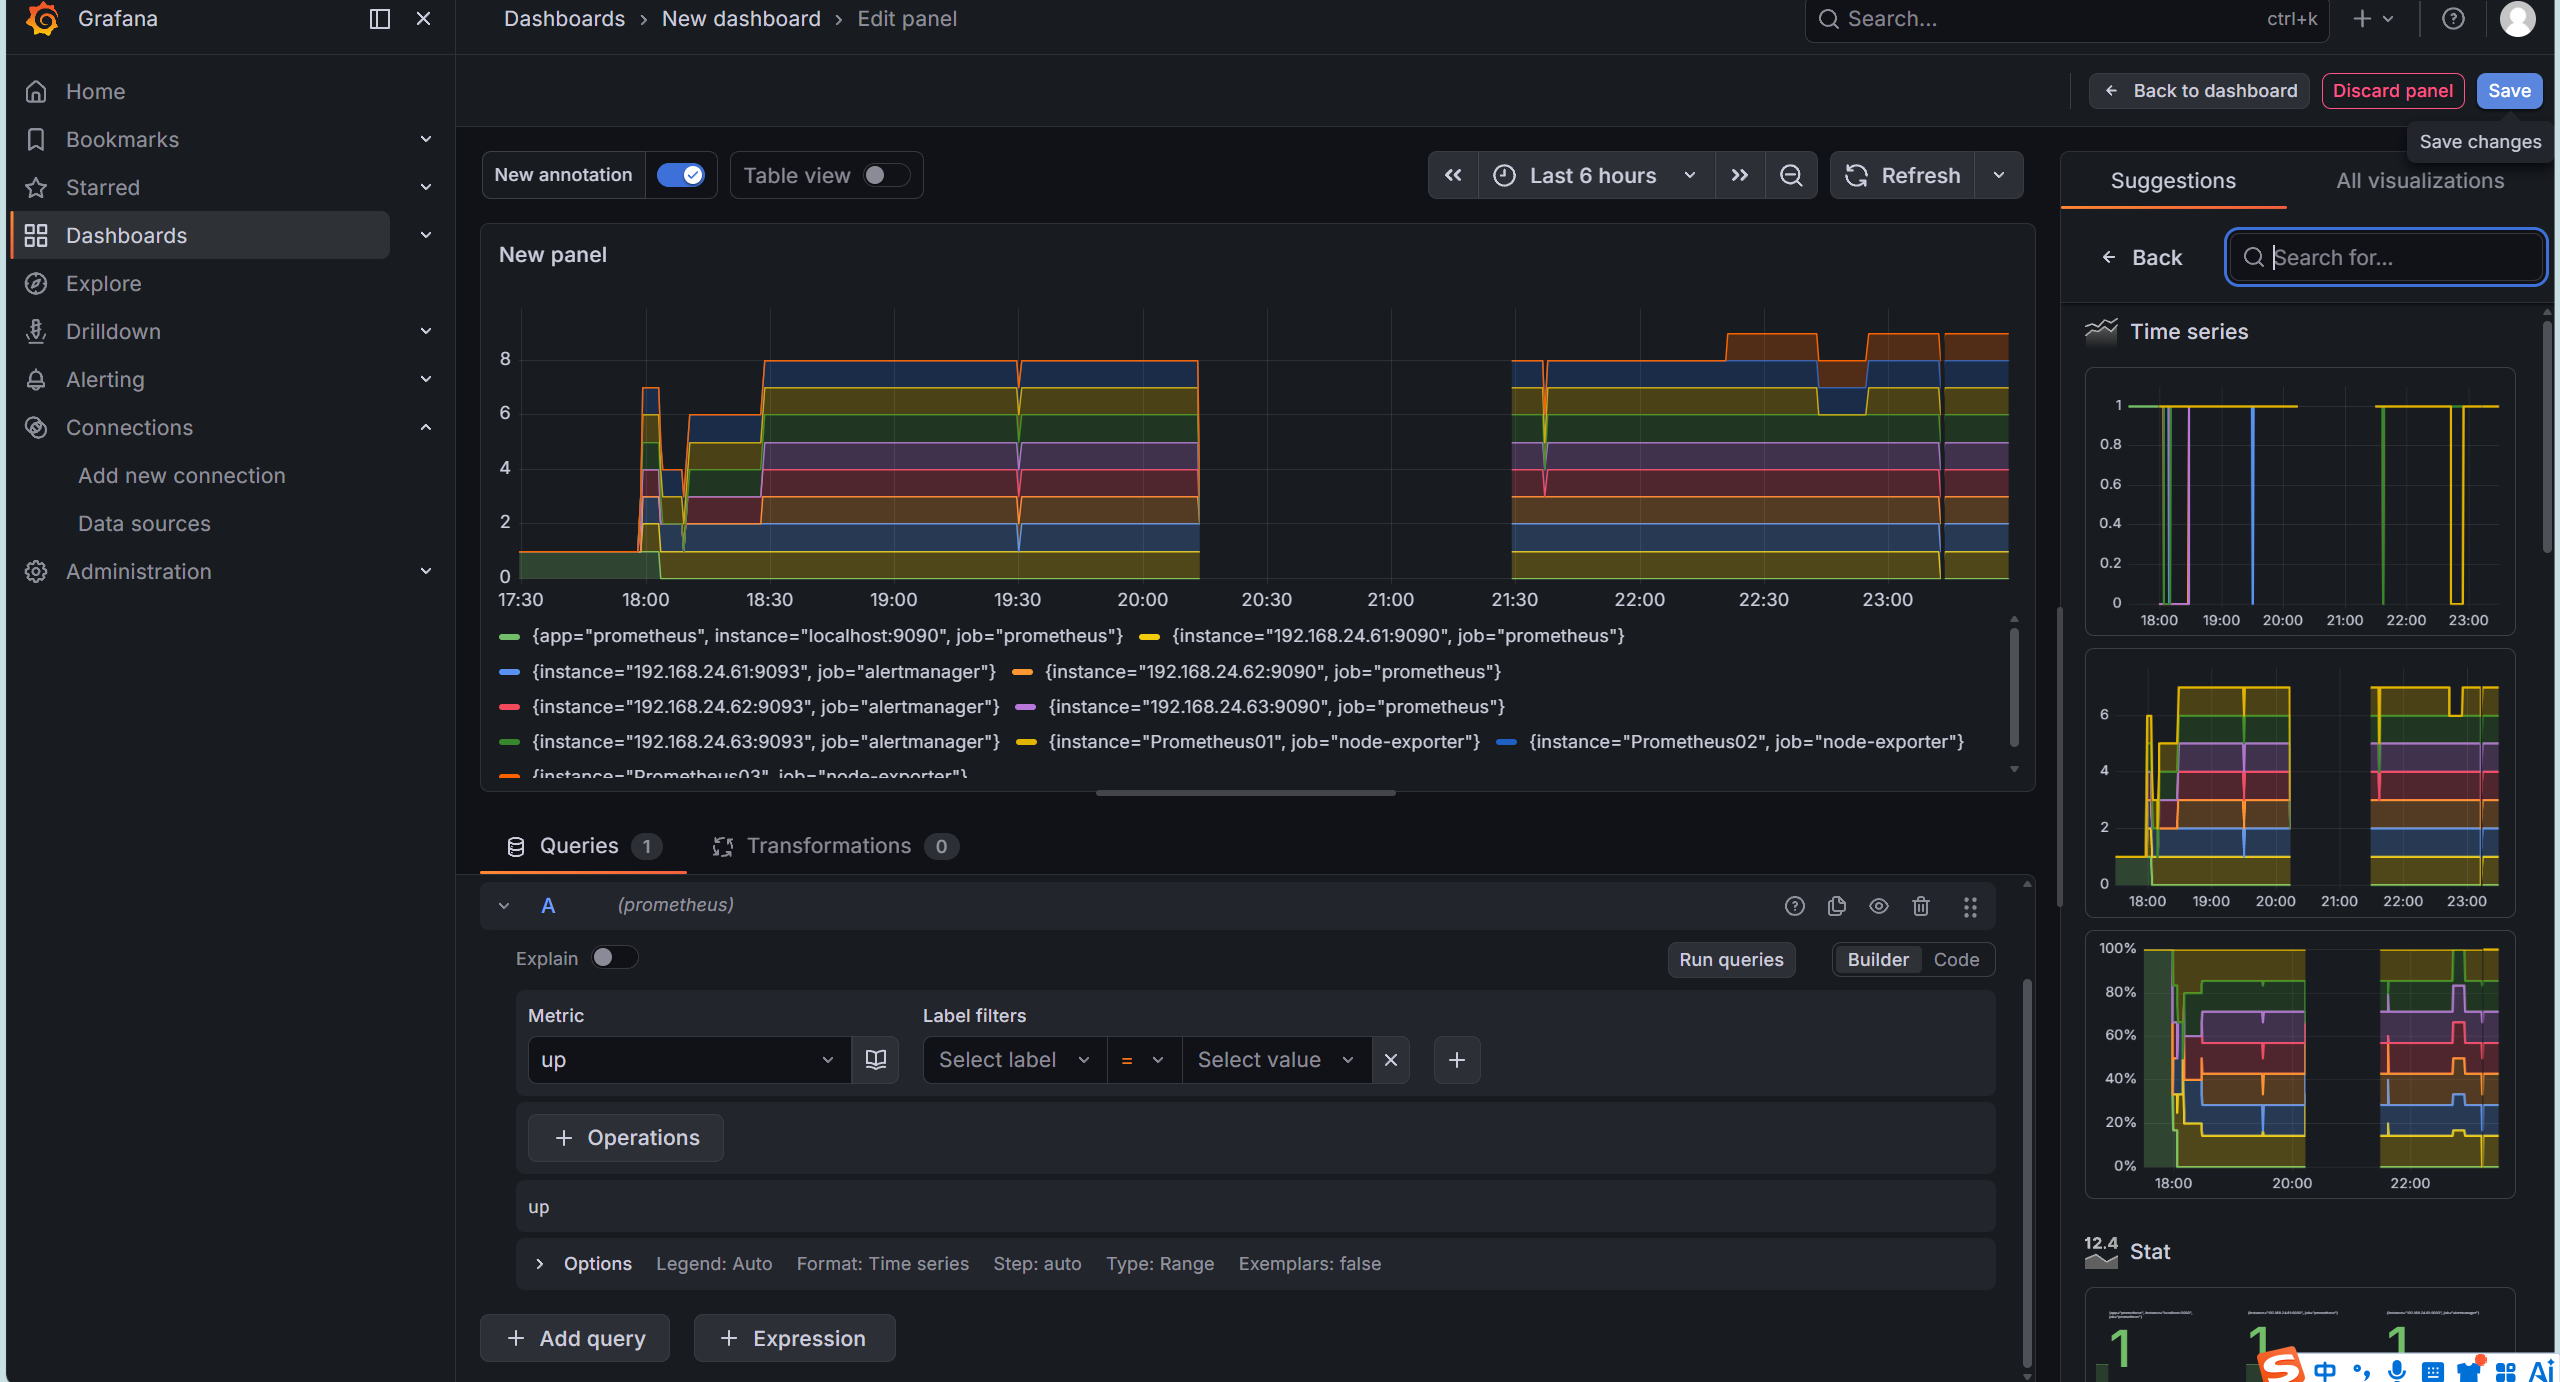
添加仪表盘:
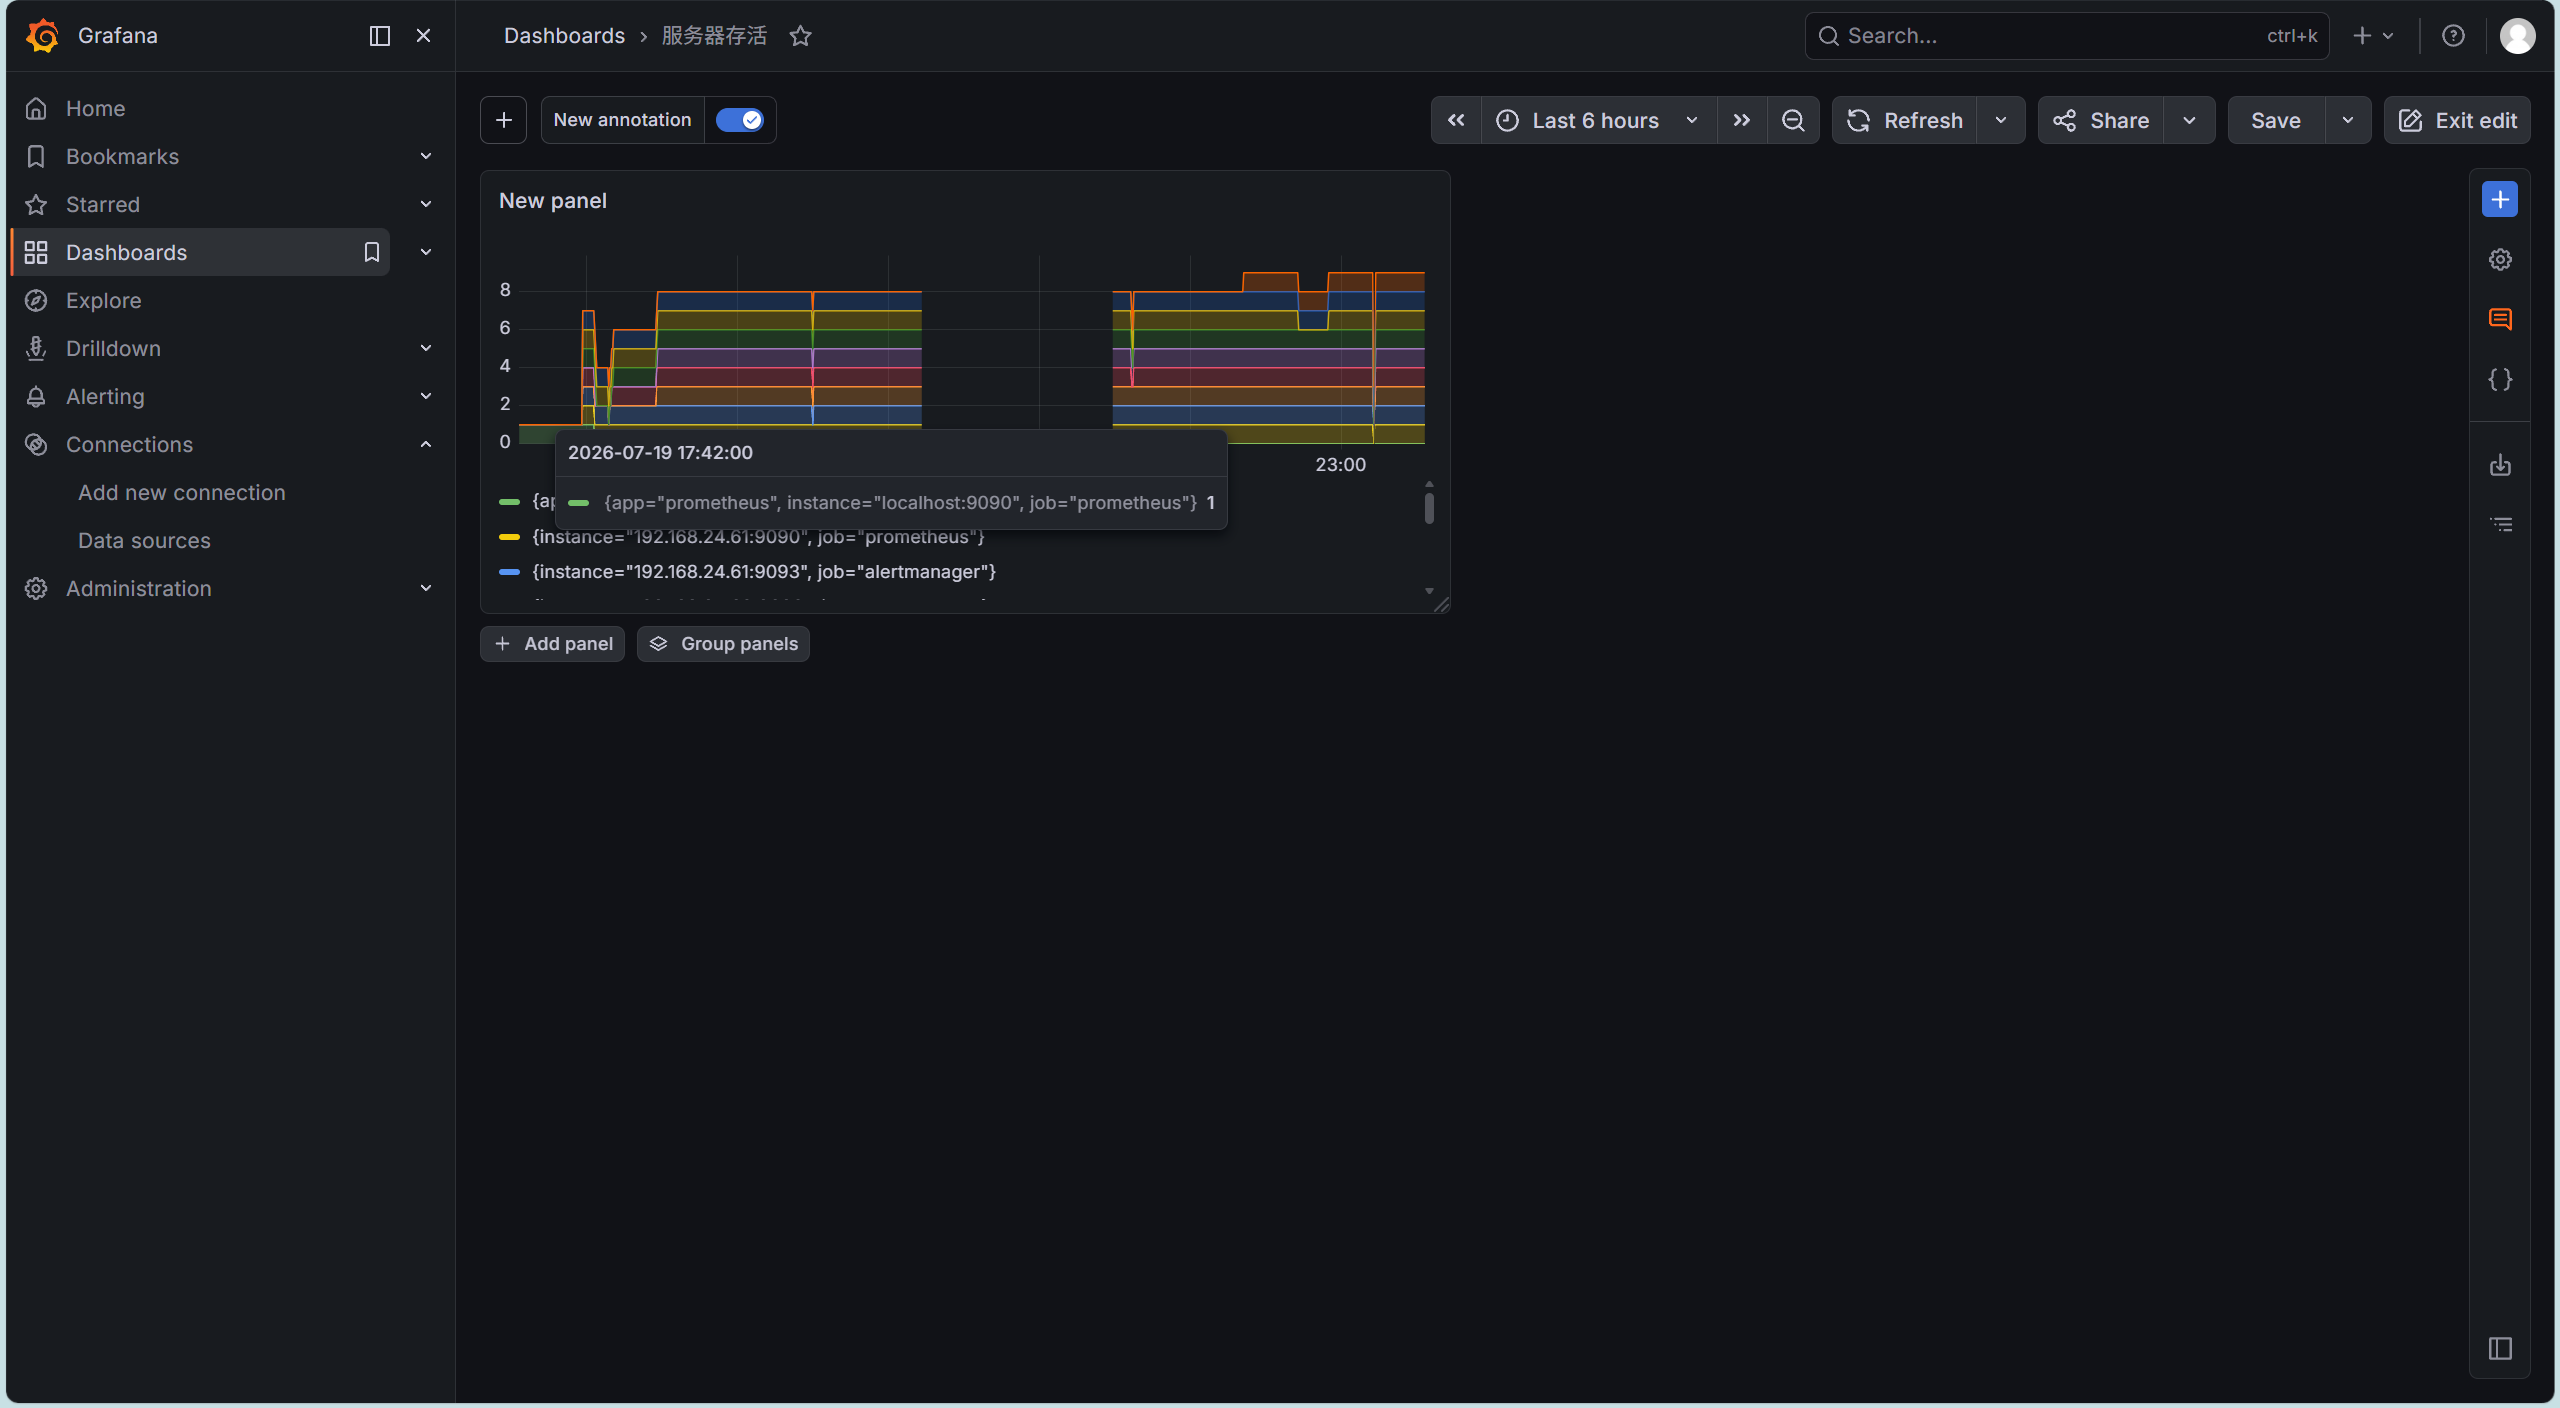
- 方式二(Provisioning 文件) :写
conf/provisioning/datasources/prometheus.yml→ 重启 Grafana → 3个数据源自动出现
浏览器访问 http://192.168.24.61:3000(默认 admin/admin),添加 Prometheus 数据源:
-
URL:
http://192.168.24.61:9090 -
URL:
http://192.168.24.62:9090 -
URL:
http://192.168.24.63:9090
💡"配置好数据源",实际生产建议把 3 个 Prometheus 都加进去,查询时手动切换或配合 Thanos 做全局查询。
4.12.2 Alertmanager 高可用
一、核心原理
Alertmanager 通过 Gossip 协议实现集群:
-
无主节点,所有节点平等
-
告警、沉默、抑制规则自动同步到所有节点
-
必须用奇数节点(3/5/7),避免脑裂
-
任意 1 个节点故障,剩余节点仍正常发告警
二、启动多个实例
这个是手动启动,如果原本有启动alertmanager会出现端口冲突的问题,下面服务文件是systmed启动,两者二选一即可
# 节点1:只监听 Gossip 端口,不指定 peer(它是首个节点)
./alertmanager --cluster.listen-address=192.168.24.61:9094

# 节点2:监听自身 Gossip 端口,并指向节点1作为对等节点加入集群
./alertmanager --cluster.listen-address=192.168.24.62:9094 --cluster.peer=192.168.24.61:9094

# 节点3:监听自身 Gossip 端口,并指向节点1作为对等节点加入集群
./alertmanager --cluster.listen-address=192.168.24.63:9094 --cluster.peer=192.168.24.61:9094
三、Systemd 服务文件
节点1:/usr/lib/systemd/system/alertmanager.service
换行续写注释不要在同一行,这里为了方便
[Unit]
Description=Alertmanager
Wants=network-online.target
After=network-online.target

[Service]
Type=simple
User=prometheus
Group=prometheus
ExecStart=/opt/monitor/alertmanager/alertmanager \
  --config.file=/opt/monitor/alertmanager/alertmanager.yml \  # 配置文件
  --storage.path=/opt/monitor/alertmanager/ \                 # 数据存储目录
  --web.external-url=http://192.168.24.61:9093 \             # 外部访问地址(节点1)
  --cluster.listen-address=0.0.0.0:9094                      # Gossip 监听地址
Restart=always                                                # 总是重启

[Install]
WantedBy=multi-user.target节点2:/usr/lib/systemd/system/alertmanager.service
[Unit]
Description=Alertmanager
Wants=network-online.target
After=network-online.target

[Service]
Type=simple
User=prometheus
Group=prometheus
ExecStart=/opt/monitor/alertmanager/alertmanager \
  --config.file=/opt/monitor/alertmanager/alertmanager.yml \
  --storage.path=/opt/monitor/alertmanager/ \
  --web.external-url=http://192.168.24.62:9093 \             # 外部访问地址(节点2)
  --cluster.listen-address=192.168.24.62:9094 \              # Gossip 监听地址(节点2)
  --cluster.peer=192.168.24.61:9094                         # 指向节点1加入集群
Restart=always

[Install]
WantedBy=multi-user.target节点3:/usr/lib/systemd/system/alertmanager.service
[Unit]
Description=Alertmanager
Wants=network-online.target
After=network-online.target

[Service]
Type=simple
User=prometheus
Group=prometheus
ExecStart=/opt/monitor/alertmanager/alertmanager \
  --config.file=/opt/monitor/alertmanager/alertmanager.yml \
  --storage.path=/opt/monitor/alertmanager/ \
  --web.external-url=http://192.168.24.63:9093 \             # 外部访问地址(节点3)
  --cluster.listen-address=192.168.24.63:9094 \              # Gossip 监听地址(节点3)
  --cluster.peer=192.168.24.61:9094                         # 指向节点1加入集群
Restart=always

[Install]
WantedBy=multi-user.target
手动删除中文可能会有行尾空格,处理如下:
sed -i 's/\\[[:space:]]*$/\\/' /usr/lib/systemd/system/alertmanager.service
删除每一行末尾所有的空白字符(空格、Tab 等)。$ 表示行尾,[[:space:]]* 匹配零个或多个空白字符。
四、Alertmanager 配置文件
路径:/opt/monitor/alertmanager/alertmanager.yml
global:
  resolve_timeout: 5m        # 5分钟未收到更新则标记告警恢复

route:
  receiver: 'default-receiver'  # 默认接收者
  group_by: ['alertname']       # 按告警名分组
  group_wait: 10s               # 组等待
  group_interval: 10s           # 组间隔
  repeat_interval: 1h           # 重复发送间隔

receivers:
- name: 'default-receiver'
  # 这里留空 webhook 占位
  # 实际可配置 email / webhook / 钉钉等
  webhook_configs:
    - url: 'http://localhost:5001/'   # 占位地址,按实际需求修改
五、在 Prometheus 中指定所有 Alertmanager
在 prometheus.yml的 alerting段已配置,三个地址:
alerting:
  alertmanagers:
    - static_configs:
        - targets:
            - '192.168.24.61:9093'
            - '192.168.24.62:9093'
            - '192.168.24.63:9093'
配置邮箱告警
一、163 邮箱 SMTP 参数(固定值)
| 项目 | 值 |
|---|---|
| SMTP 服务器 | smtp.163.com |
| 端口 | 465(SSL 隐式加密) |
| 用户名 | 17338776436@163.com |
| 密码 | 163 授权码(不是邮箱登录密码) |
| 发件人 | 17338776436@163.com |
注意:465 是"连接即加密",所以 Alertmanager 里要配
smtp_require_tls: false(否则它会去协商 STARTTLS,反而失败)。这是 163/QQ 邮箱最常踩的坑。
二、alertmanager.yml 邮件配置
先确认你的配置文件路径:
global:
  resolve_timeout: 5m
  smtp_smarthost: 'smtp.163.com:465'
  smtp_from: '17338776436@163.com'
  smtp_auth_username: '17338776436@163.com'
  smtp_auth_password: '<这里填你重置后的新授权码>'
  smtp_require_tls: false

route:
  receiver: 'email-default'
  group_by: ['alertname', 'instance']
  group_wait: 30s
  group_interval: 5m
  repeat_interval: 4h

receivers:
- name: 'email-default'
  email_configs:
  - to: '17338776436@163.com'
    from: '17338776436@163.com'
    smarthost: 'smtp.163.com:465'
    auth_username: '17338776436@163.com'
    auth_password: '<这里填你重置后的新授权码>'
    require_tls: false
    headers:
      Subject: '[Alertmanager] {{ .CommonAnnotations.summary }}'
小提示:
to和from你都填同一个邮箱,自己发给自己,方便验证。
三、让配置生效
# 方式 A:热加载(推荐,不中断服务)
/opt/monitor/alertmanager/amtool config reload --alertmanager.url=http://localhost:9093

# 如果没生效或没配热加载,就重启
systemctl restart alertmanager
# 或 kill -HUP <pid>

/opt/monitor/alertmanager/amtool config show --alertmanager.url=http://localhost:9093 | head -20
四、发一封测试邮件验证
不用等真实告警,直接往 Alertmanager 推一个测试 alert:
curl -H "Content-Type: application/json" -XPOST \
  http://localhost:9093/api/v2/alerts -d '[
  {
    "labels": {
      "alertname": "TestMailAlert",
      "severity": "warning"
    },
    "annotations": {
      "summary": "邮件告警测试",
      "description": "如果你收到这封邮件,说明 Alertmanager 邮件通道已打通"
    }
  }
]'
等 30 秒 (group_wait)后去邮箱查收。同时盯日志看有没有报错:
journalctl -u alertmanager -n 50 --no-pager | tail -20
# 若没用 systemd,看你的日志文件路径
4.12.3 集群验证与测试
一、检查配置文件
# 校验 Prometheus 配置
/opt/monitor/prometheus/promtool check config /opt/monitor/prometheus/prometheus.yml

例子:
[root@prometheus-01 prometheus]# /opt/monitor/prometheus/promtool check config /opt/monitor/prometheus/prometheus.yml
Checking /opt/monitor/prometheus/prometheus.yml
  SUCCESS: 1 rule files found
 SUCCESS: /opt/monitor/prometheus/prometheus.yml is valid prometheus config file syntax

Checking /opt/monitor/prometheus/alert.yml
  SUCCESS: 2 rules found


# 校验 Alertmanager 配置
/opt/monitor/alertmanager/amtool check-config /opt/monitor/alertmanager/alertmanager.yml

例子:
[root@prometheus-01 prometheus]# /opt/monitor/alertmanager/amtool check-config /opt/monitor/alertmanager/alertmanager.yml
Checking '/opt/monitor/alertmanager/alertmanager.yml'  SUCCESS
Found:
 - global config
 - route
 - 0 inhibit rules
 - 1 receivers
 - 0 templates


# 查看 Alertmanager 集群状态(确认3节点 alive),这里按理来说是要看见所有节点的
/opt/monitor/alertmanager/amtool cluster show --alertmanager.url=http://localhost:9093

[root@prometheus-01 prometheus]# /opt/monitor/alertmanager/amtool cluster show --alertmanager.url=http://localhost:9093
Cluster Status:  ready
Node Name:       01KXWP6R6EXJYSHX304AFJZJ1K
二、发送测试告警
curl -X POST http://localhost:9093/api/v1/alerts -d '[
{
"labels": {"alertname": "TestAlert", "instance": "example"},
"annotations": {"summary": "This is a test"}
}
]'
发送后访问
http://192.168.24.61:9093→ Alerts 页面应能看到TestAlert。
三、高可用故障注入测试
alertmanager的web网页查看集群是是否成功:
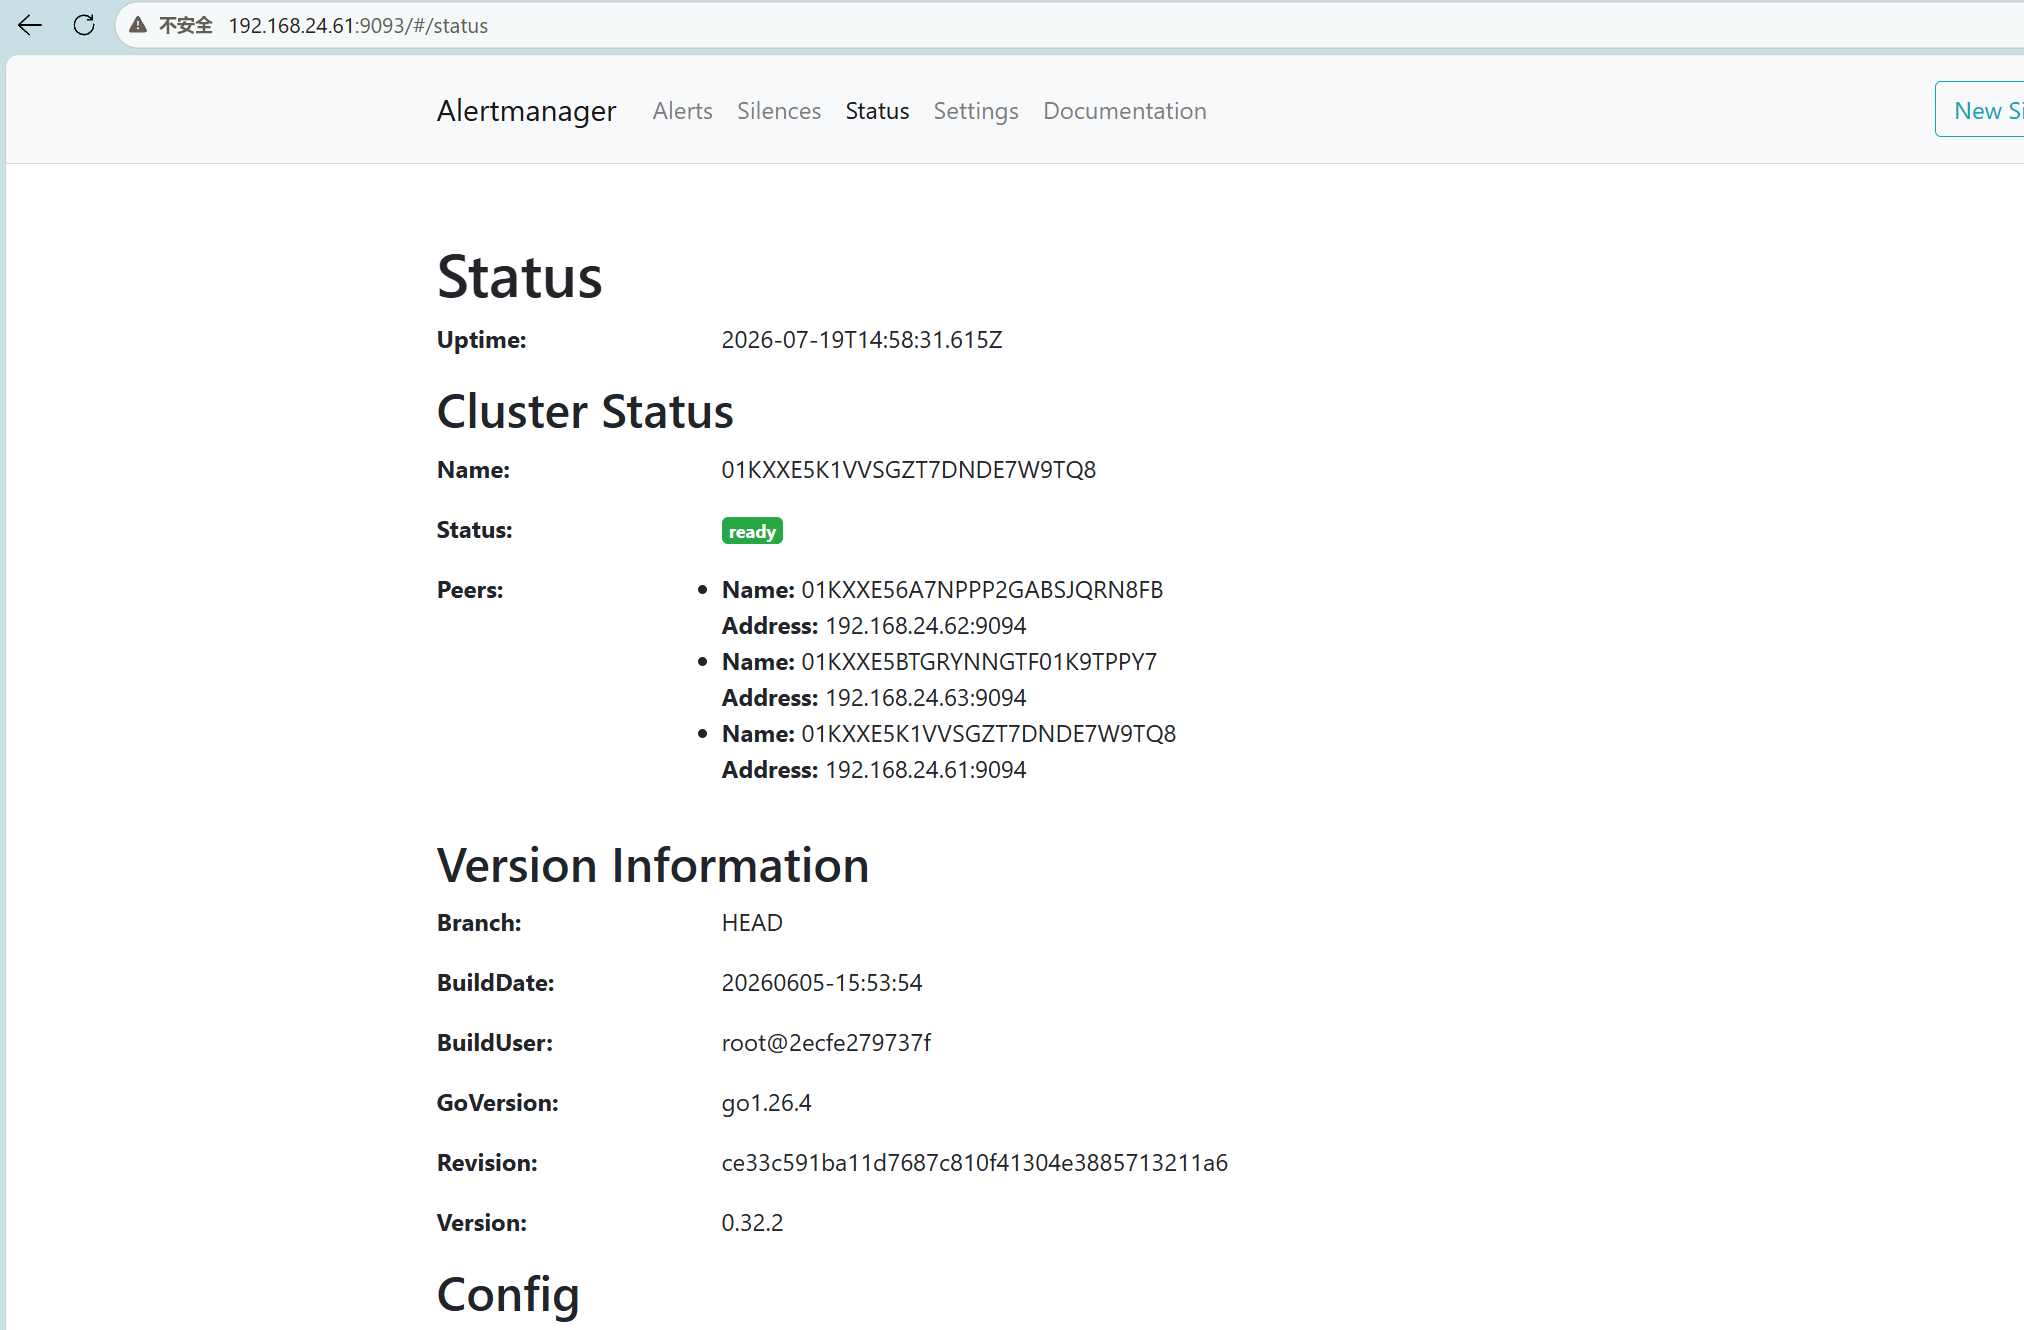
停掉节点1的node_exporter再恢复,不重复接收到邮件



查看Prometheus是否都正常监控
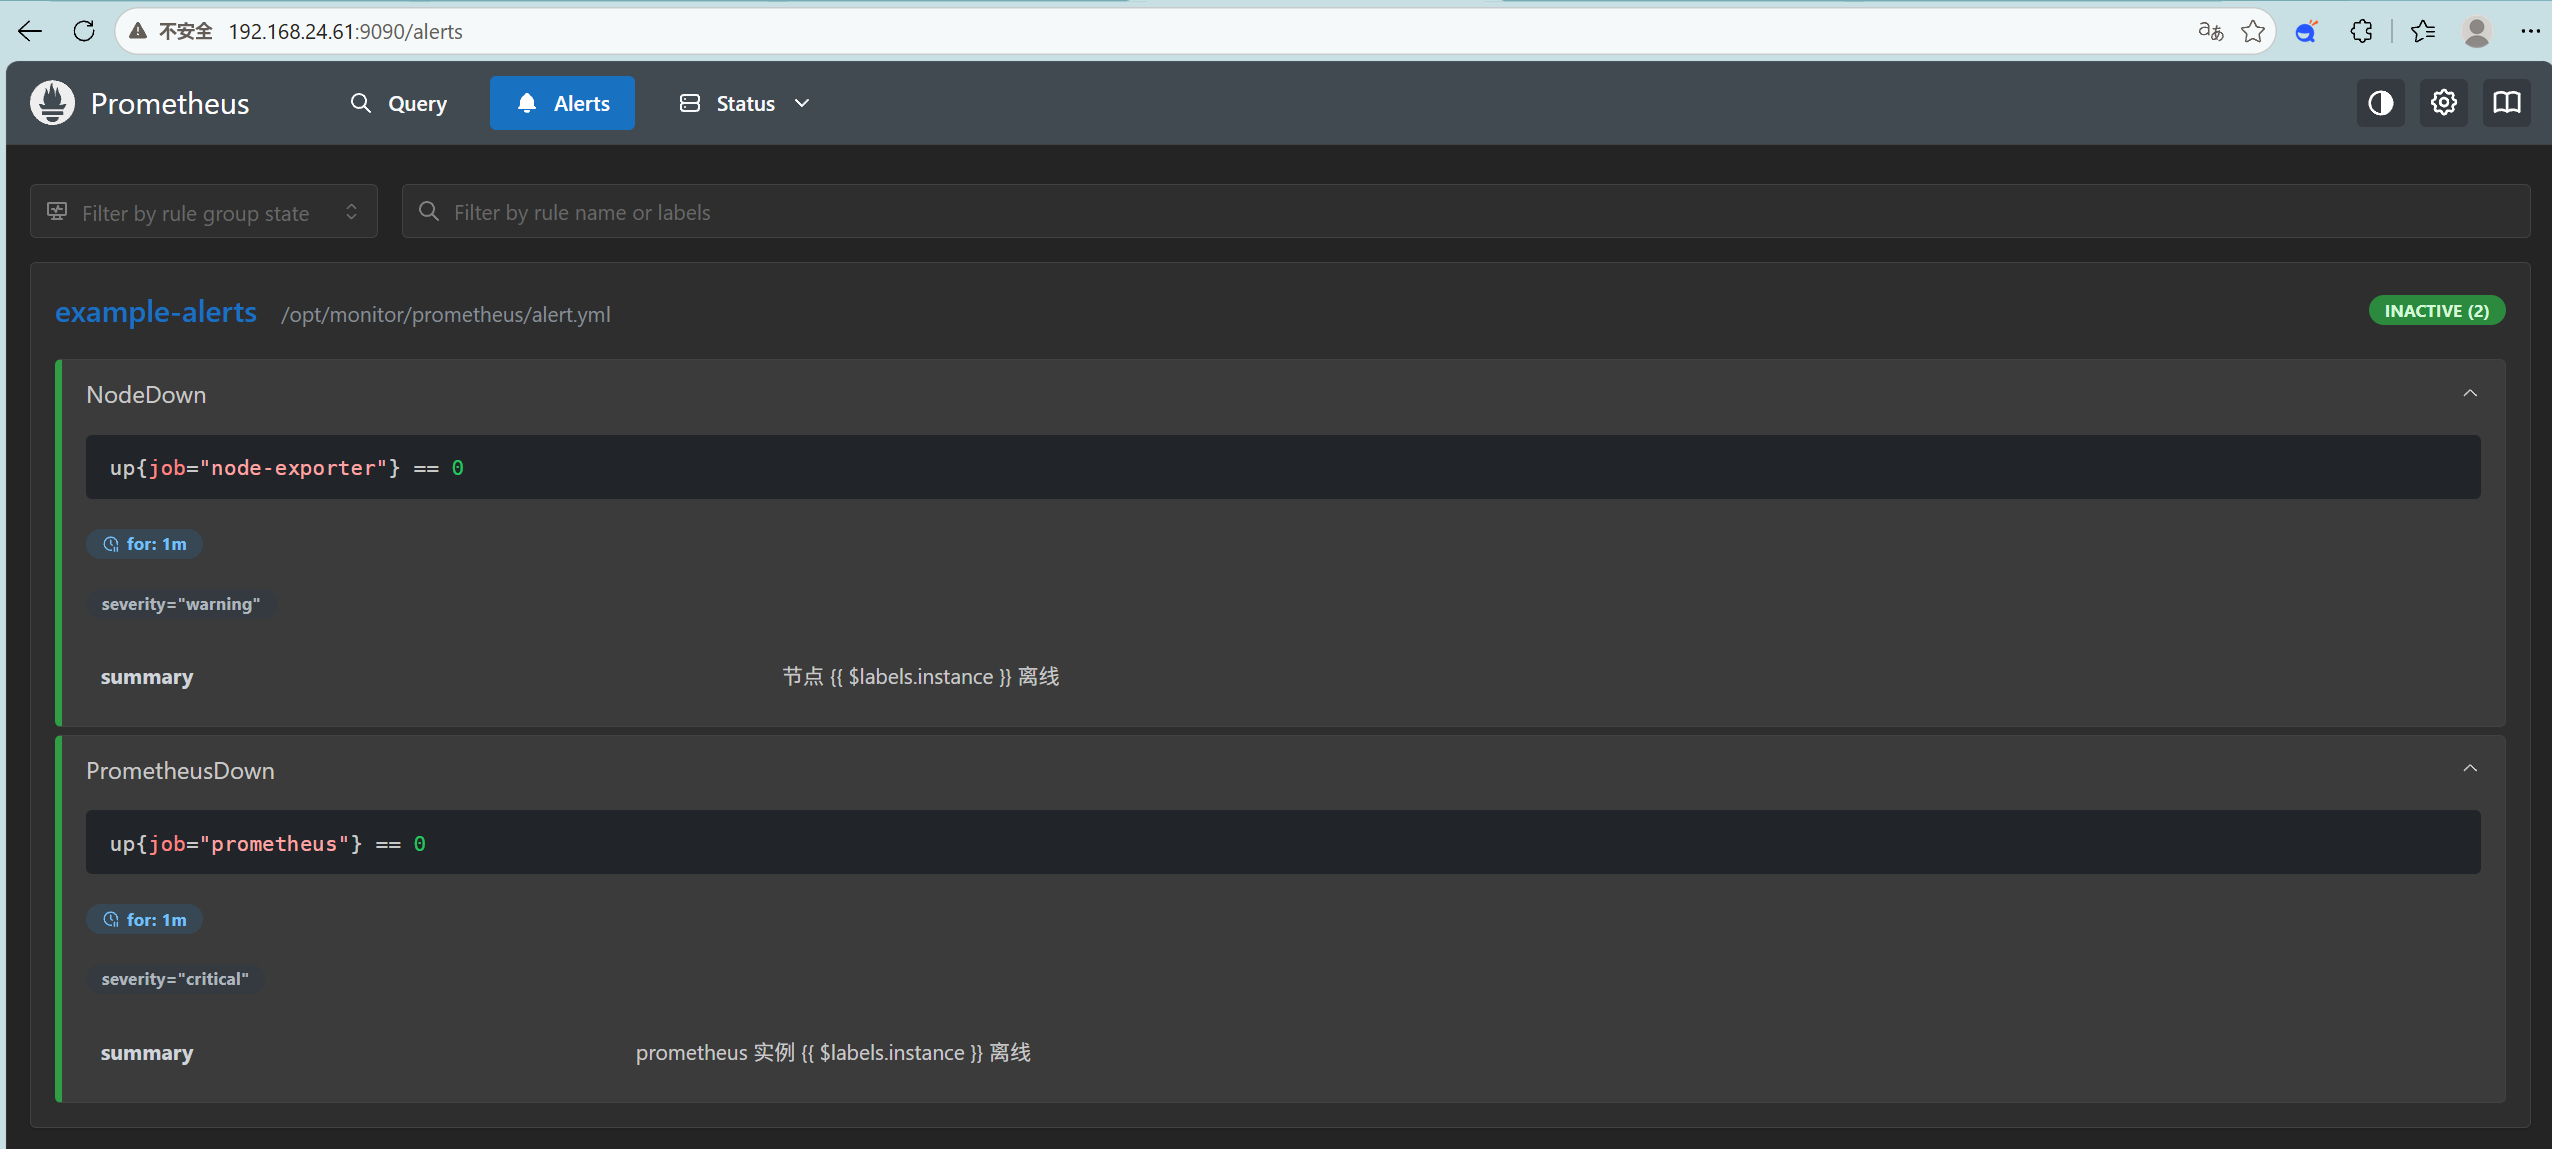
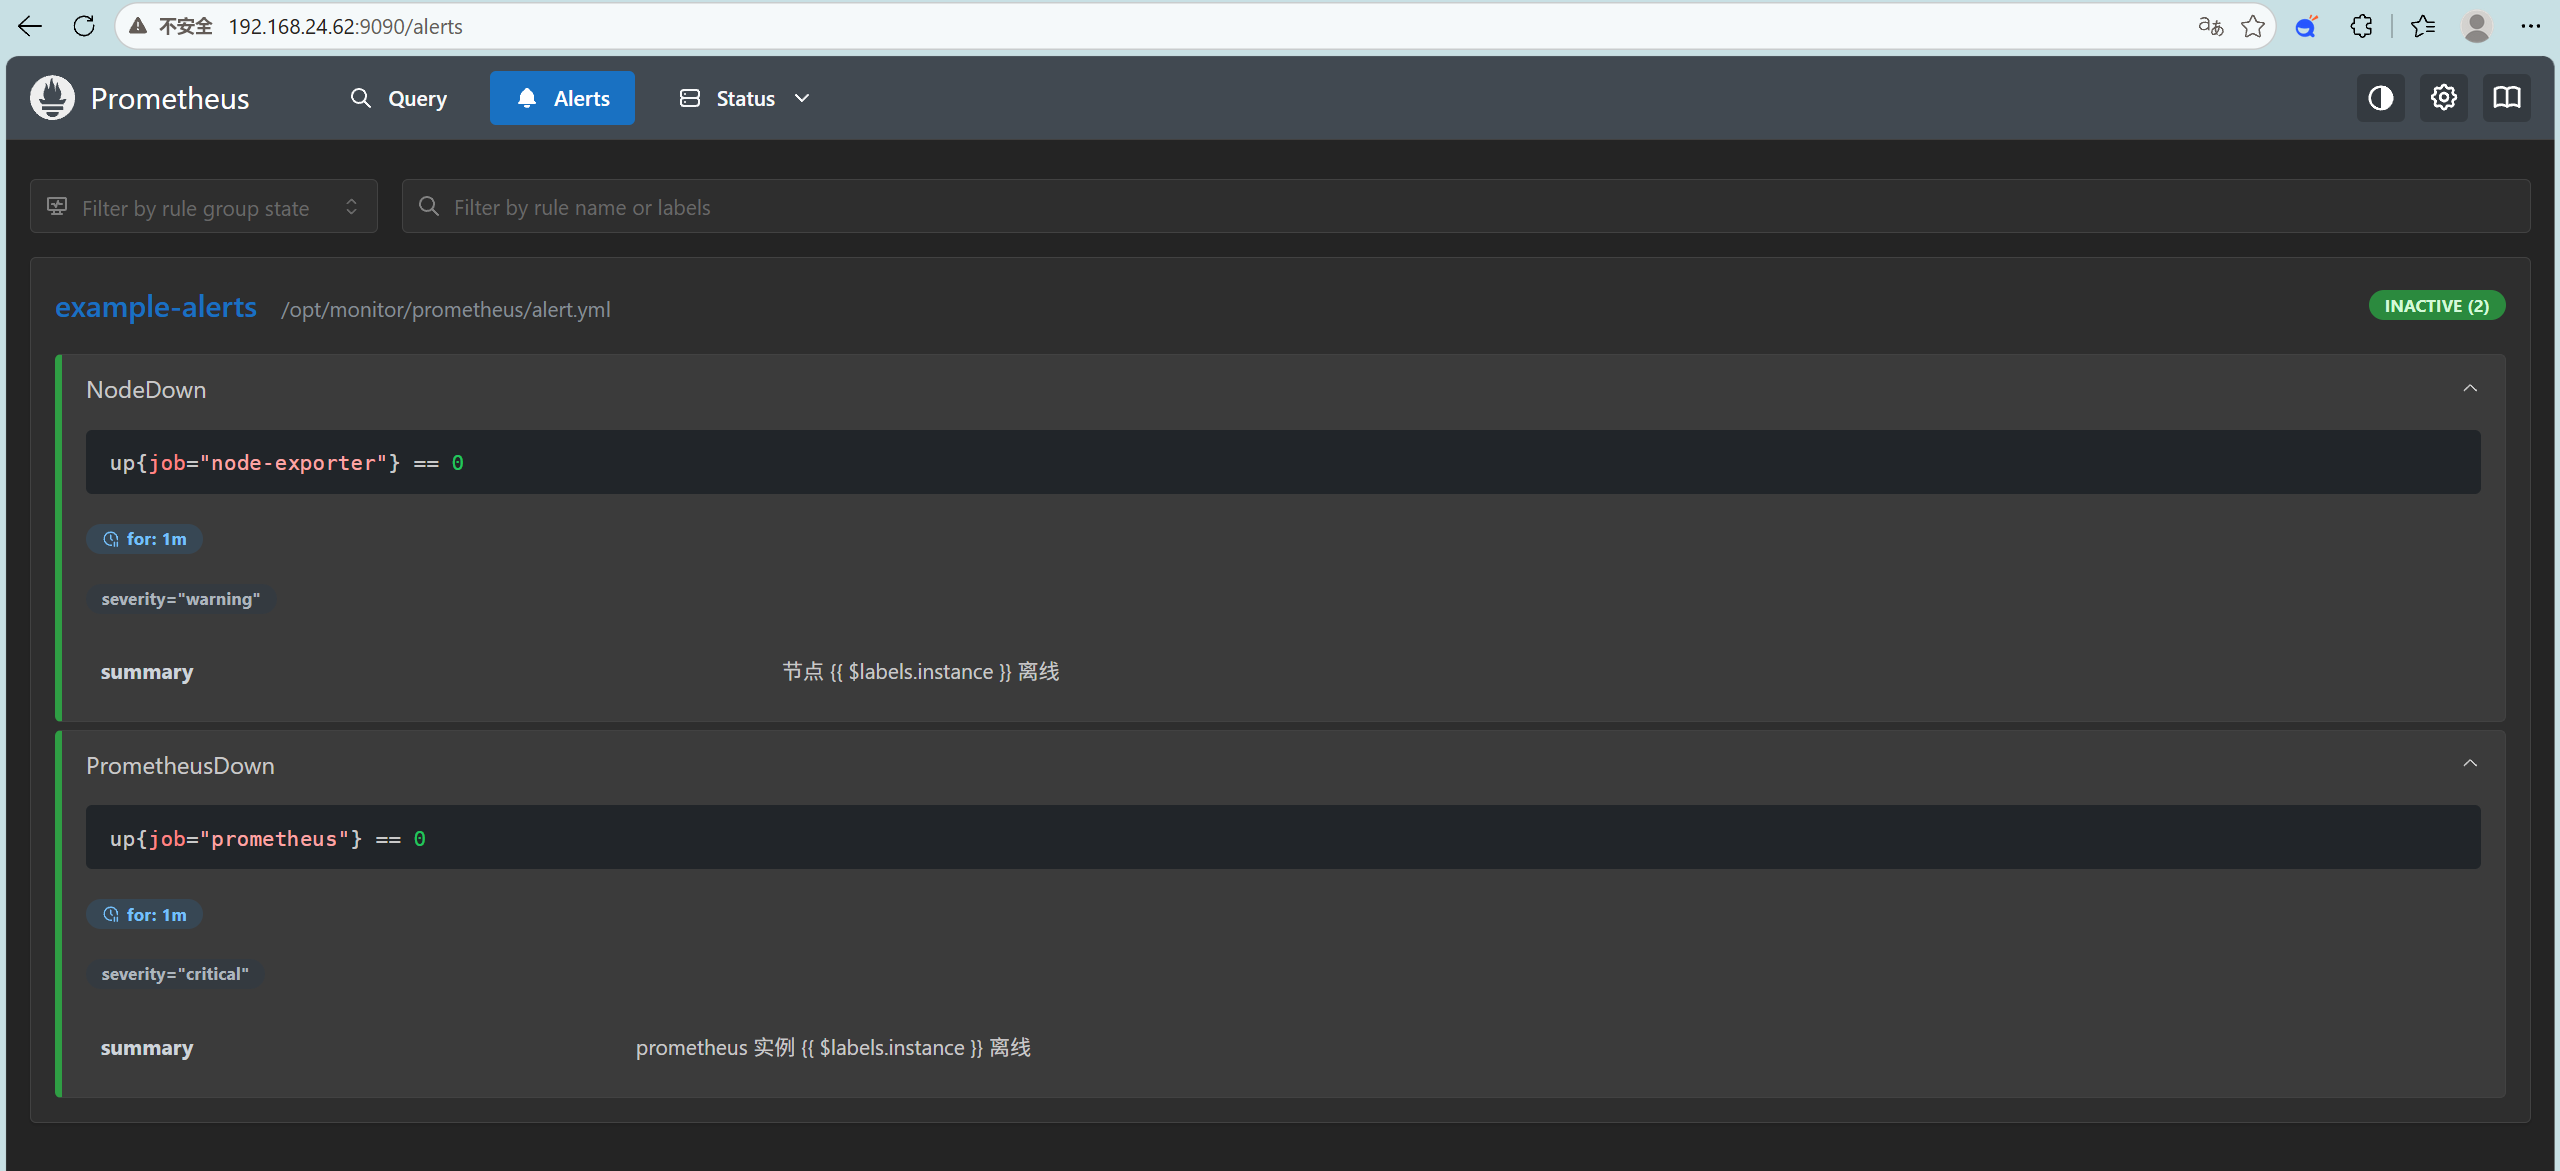
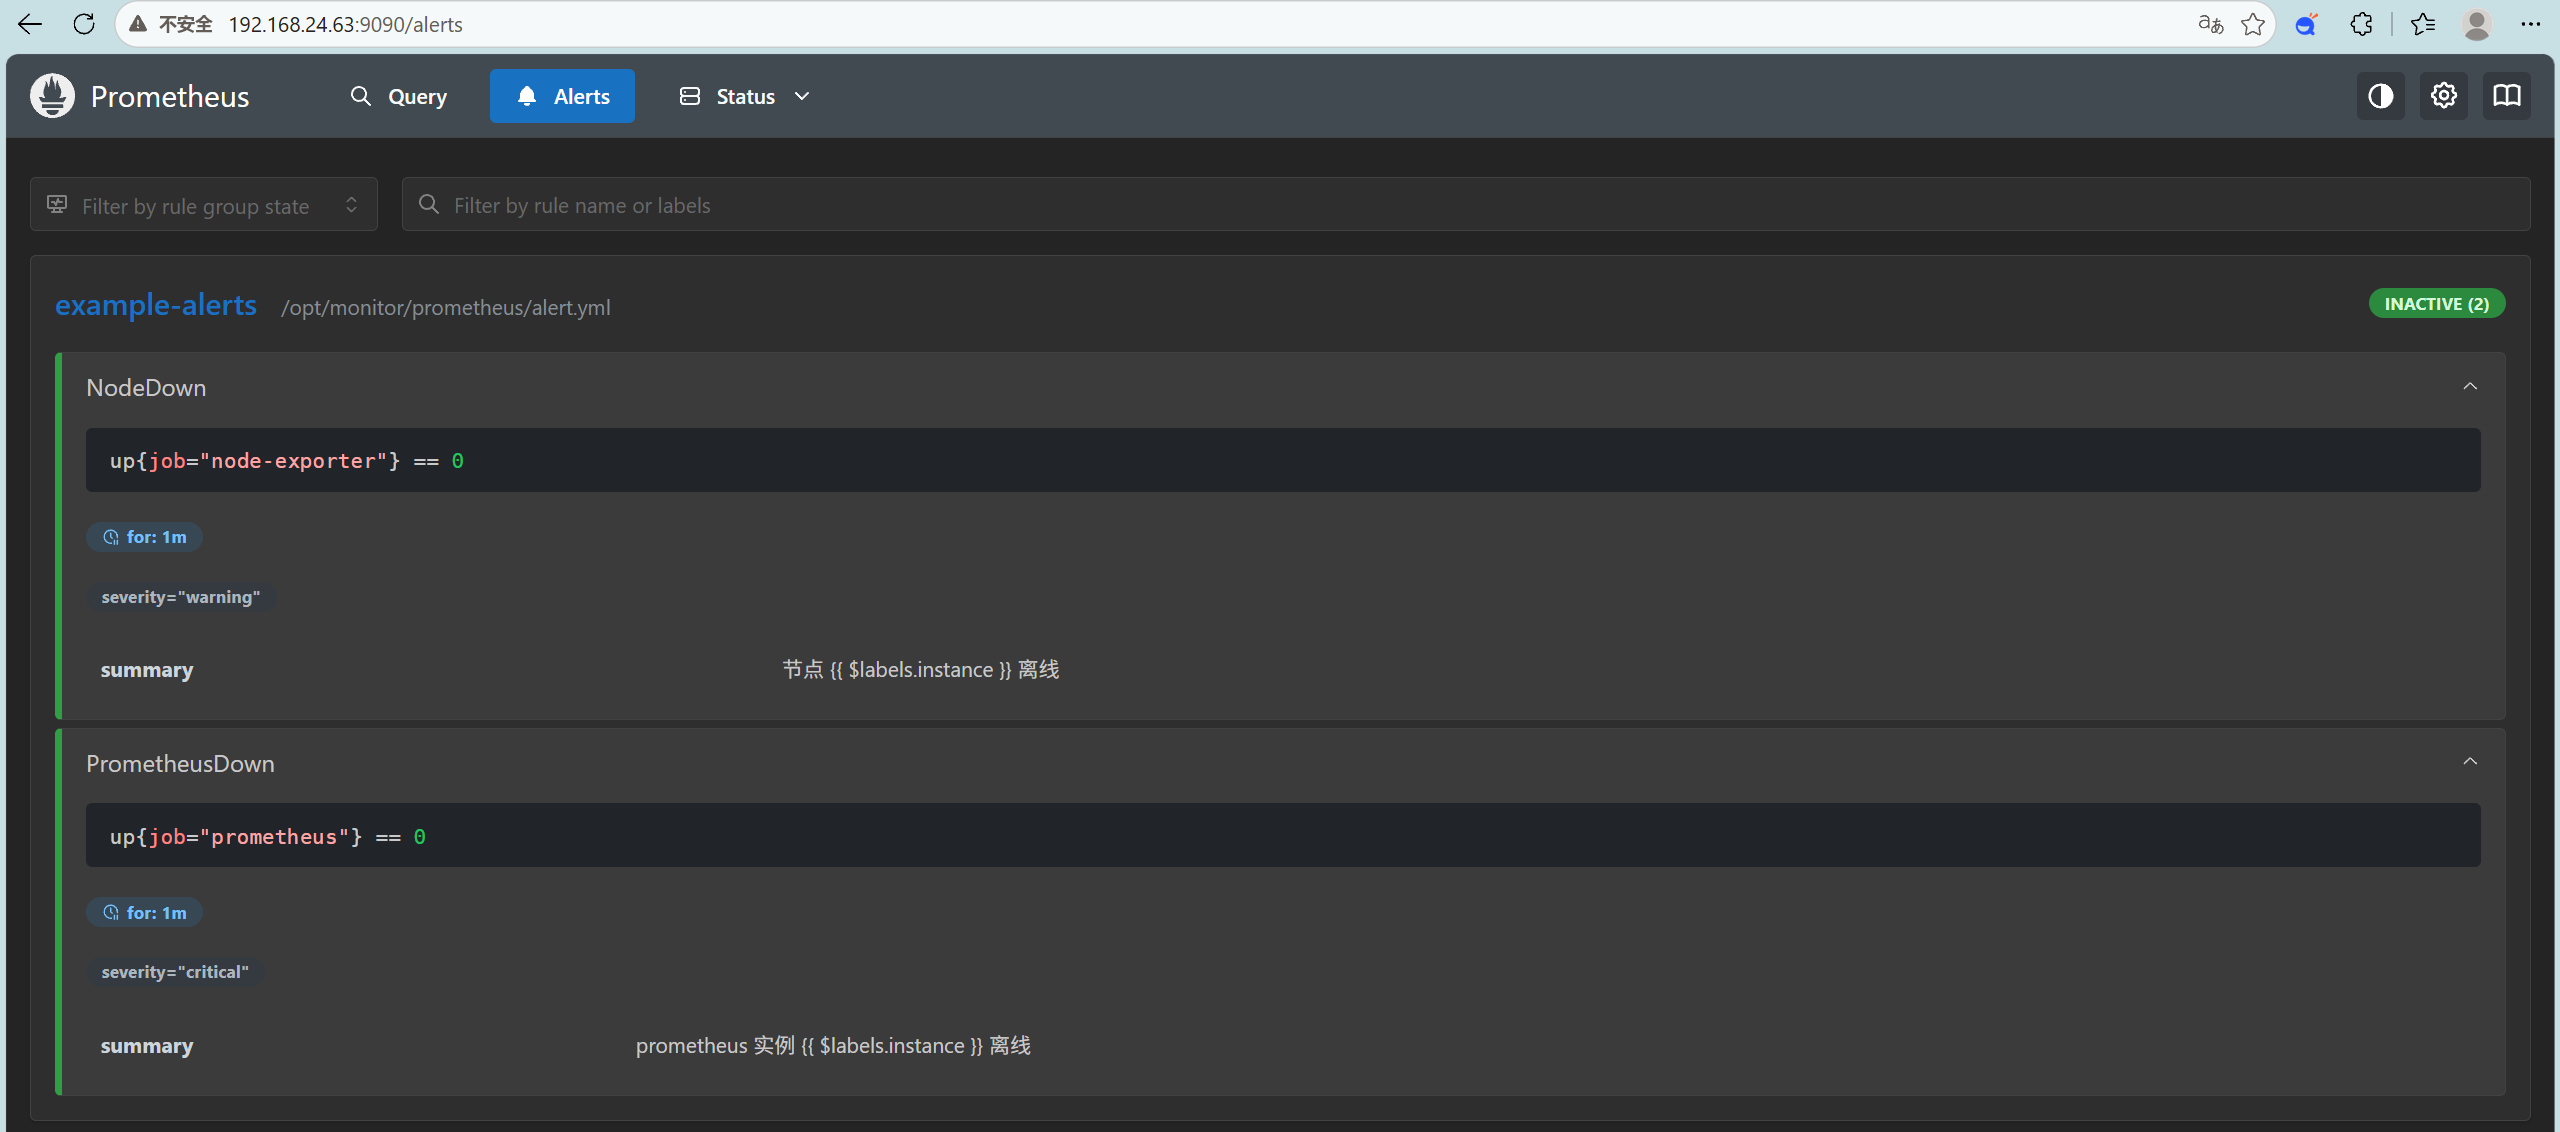
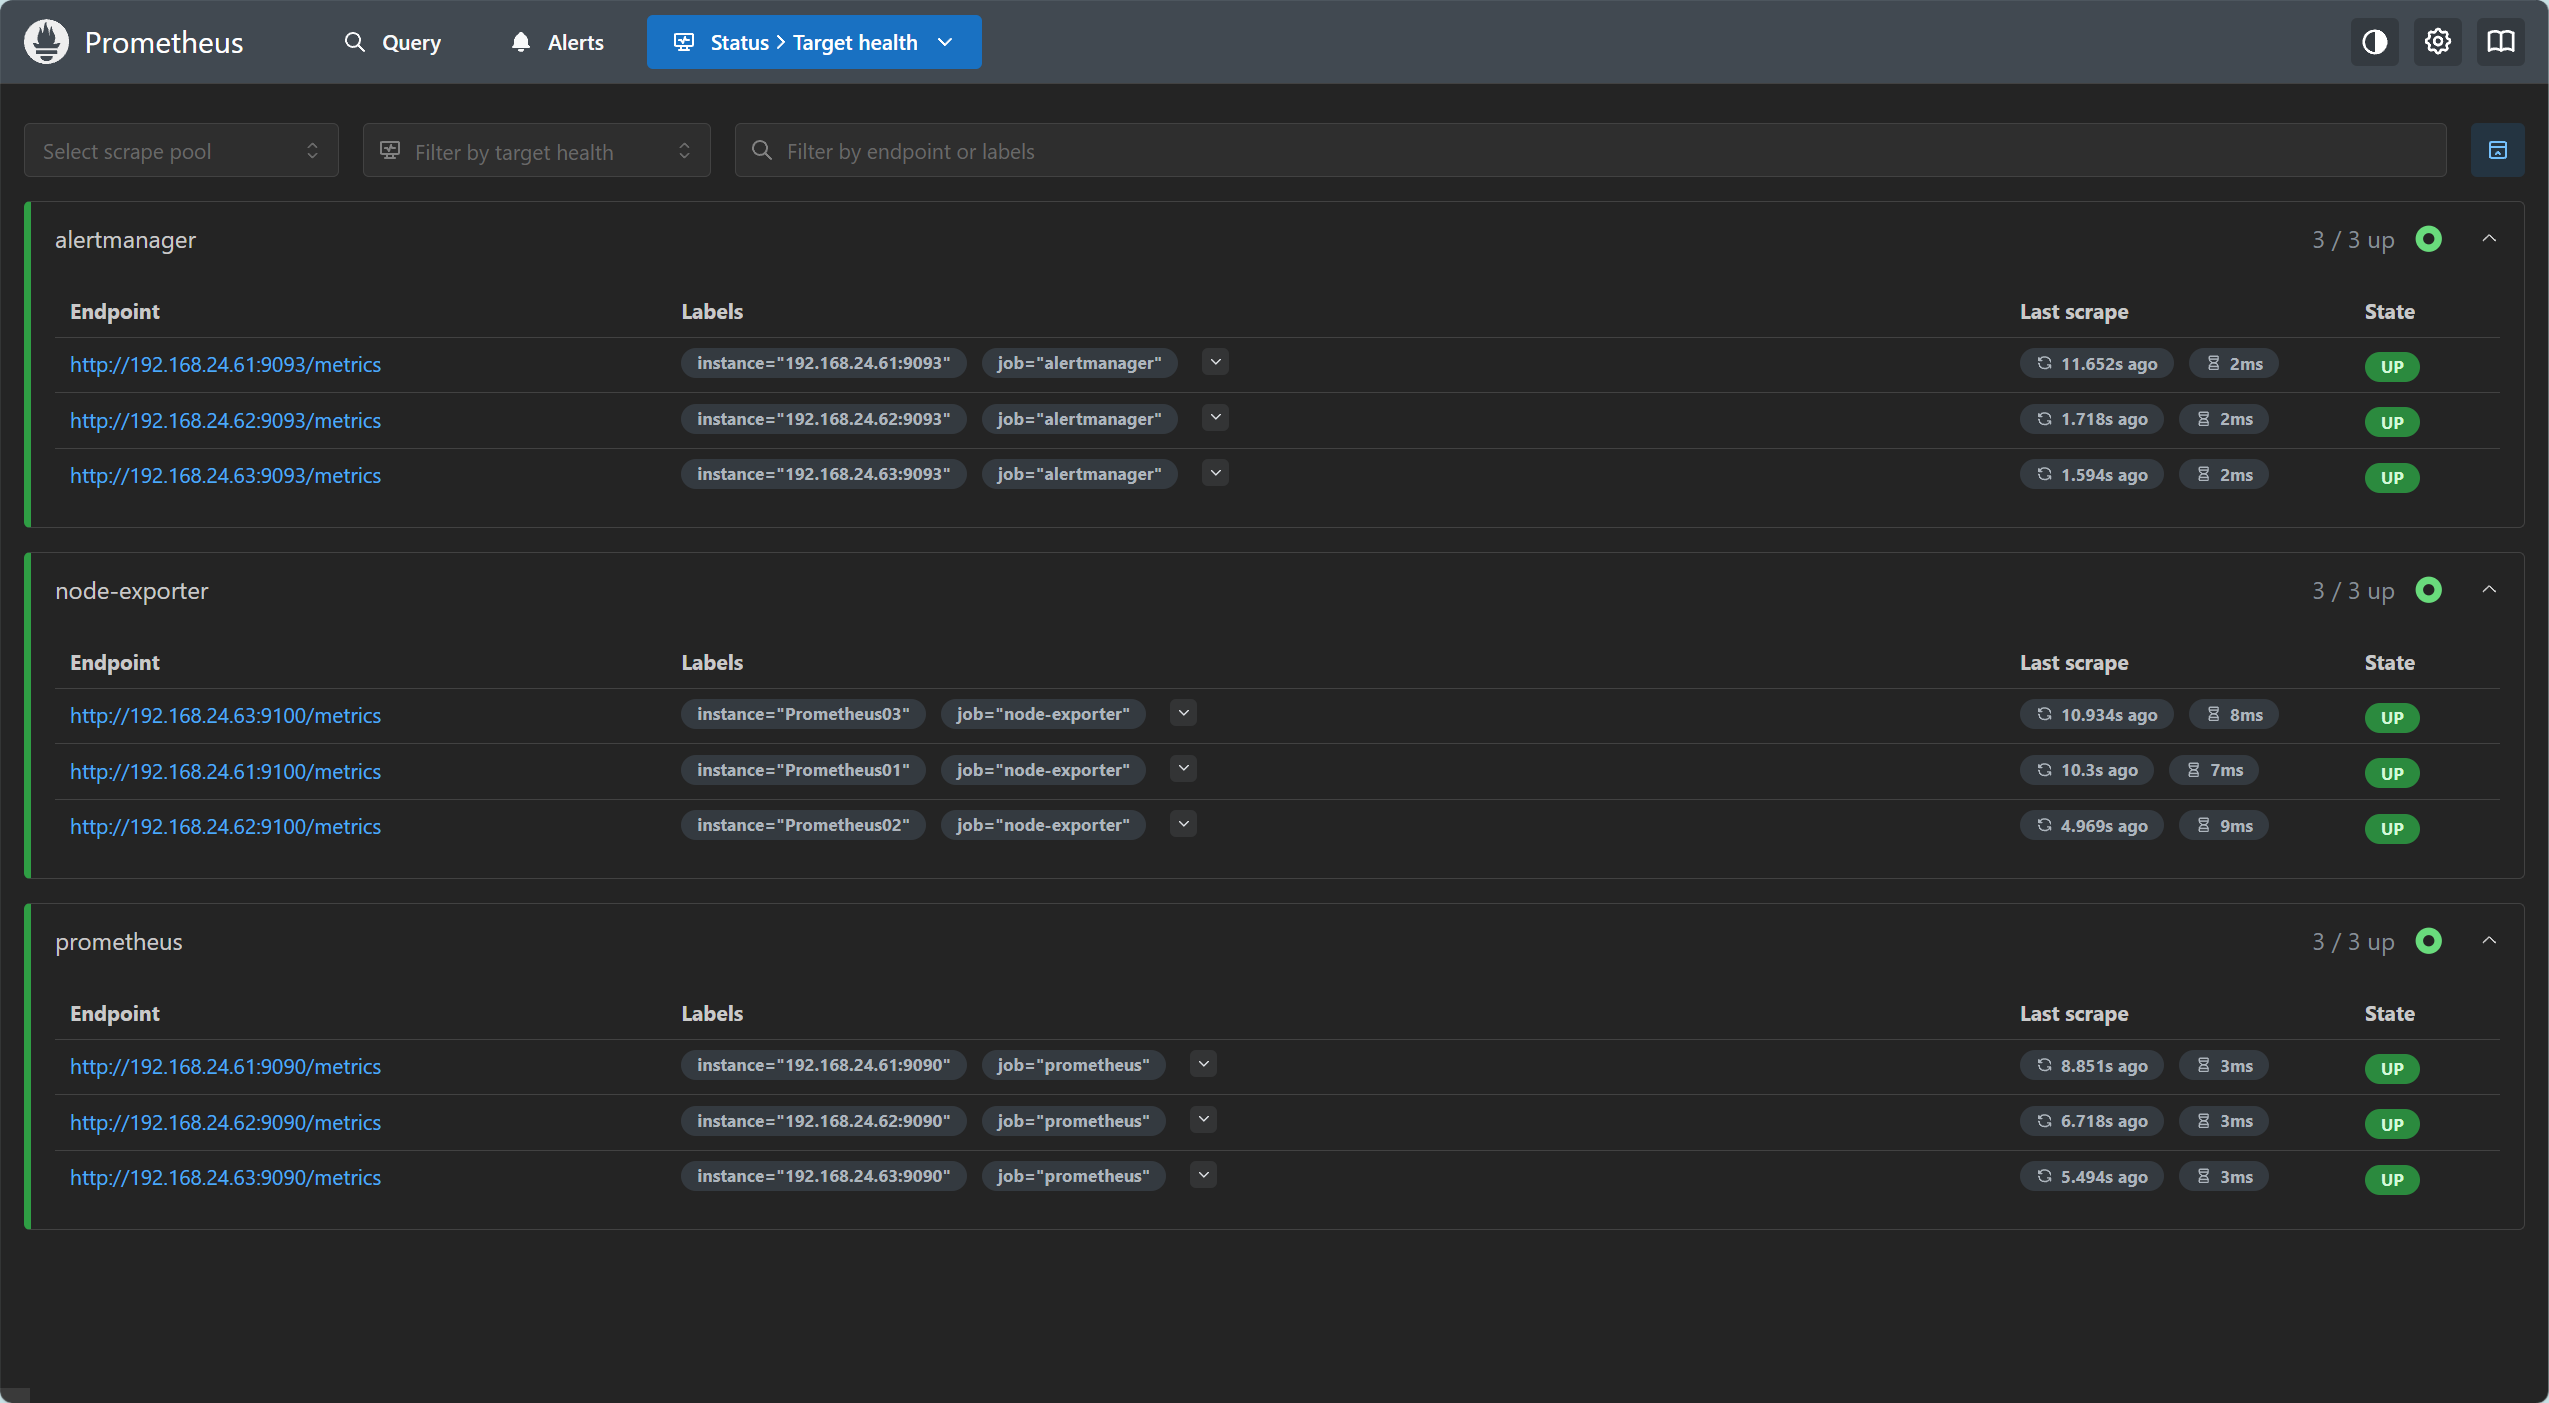
target是否3台都有:
总结
一、Prometheus 高可用的原理:多副本并行,互不复制
Prometheus 的高可用采用无状态的副本冗余 模式,而非分布式集群。你将多台 Prometheus 配置为完全相同 的采集任务(scrape_configs),让每一台都独立地、并行地去拉取相同的监控目标(targets),各自维护一份独立的本地时序数据库(TSDB)。它们之间不共享数据、不互相复制、不做选主,本质上是"一模一样的三胞胎各干各的"。
这样做的核心价值在于消除单点故障 :当其中一台 Prometheus 宕机时,其余副本仍在持续采集和生成告警,监控视野和告警能力不会中断。但硬币的另一面是------由于三台都会独立评估告警规则,同一个故障(例如某节点宕机)会被三台 Prometheus 各自产生一条完全相同的告警,如果直接发给通知渠道,就会造成严重的重复骚扰。这正是 Alertmanager 集群存在的根本理由。
二、Alertmanager 的原理:接收、去重、路由、发送
Alertmanager 是告警的调度中枢,负责把 Prometheus 抛来的原始告警加工成最终的通知。它在逻辑上承担四个关键环节:
-
接收与去重(Dedup):Alertmanager 根据告警的指纹(label 集合的 hash)识别"同一条告警"。当多台 Prometheus 发来内容相同的告警时,Alertmanager 只保留一份,确保用户只收到一次通知。
-
分组(Grouping) :将相关的多条告警按标签(如
alertname、instance、cluster)聚合成一个批次发送,避免在故障爆发期(如机房断网)瞬间涌出上百封邮件,而是合并成一封摘要。 -
路由(Routing):基于标签匹配树状路由规则,把不同类别的告警导向不同的接收者(receiver)------例如严重故障发短信、普通告警发邮件、特定服务的告警 @ 对应值班人。
-
静默与抑制(Silence & Inhibition):支持临时屏蔽已知故障的告警(如计划内维护),或在更高优先级告警触发时自动抑制低优先级告警(如"机房断电"触发后,抑制该机房下所有"应用报错"告警)。
三、两者如何协作:高可用 × 高可用 = 端到端无单点
在典型的部署中,多台 Prometheus 各自把告警发送给多台 Alertmanager 组成的集群,形成两层高可用的叠加:
-
横向看:Prometheus 层防止"采集中断",Alertmanager 层防止"通知中断"。
-
纵向看 :每台 Prometheus 会向所有健康的 Alertmanager 实例推送告警(Active 列表),而 Alertmanager 之间通过 gossip 协议(基于 memberlist 库,使用 9094/UDP 端口)形成一个逻辑集群,实时同步告警状态、通知记录和静默规则。
-
关键效果 :无论哪一台 Prometheus 或哪一台 Alertmanager 发生故障,告警链路都能自动绕过故障节点,且借助 gossip 层的全局去重与状态共享,确保每一条告警在全网只被通知一次,既不会因 HA 冗余而重复轰炸,也不会因节点切换而漏发。
简而言之,Prometheus 高可用解决的是"故障时仍能持续产生正确告警 ",Alertmanager 解决的则是"让这些告警以恰当的方式、恰当的频次、发给恰当的人"------前者保证告警不丢,后者保证告警不烦,二者共同构成了生产级监控告警体系的两大支柱。