大家好,我是Java1234_小锋老师,分享一套锋哥原创的基于Spark实时电商用户行为分析与预测(Java版本+可视化大屏+Kafka+SpringBoot+Vue3)
项目介绍
随着电子商务行业的快速发展,平台每天都会产生海量的用户行为数据,包括浏览、加购、收藏和购买等。如何对这些行为数据进行实时采集、高效统计与科学预测,已成为电商运营决策和智能推荐的关键问题。传统的离线批处理方式存在延迟高、反馈慢、难以支撑实时运营的不足,因此构建一套面向实时场景的电商用户行为分析与预测系统具有重要的工程意义和应用价值。
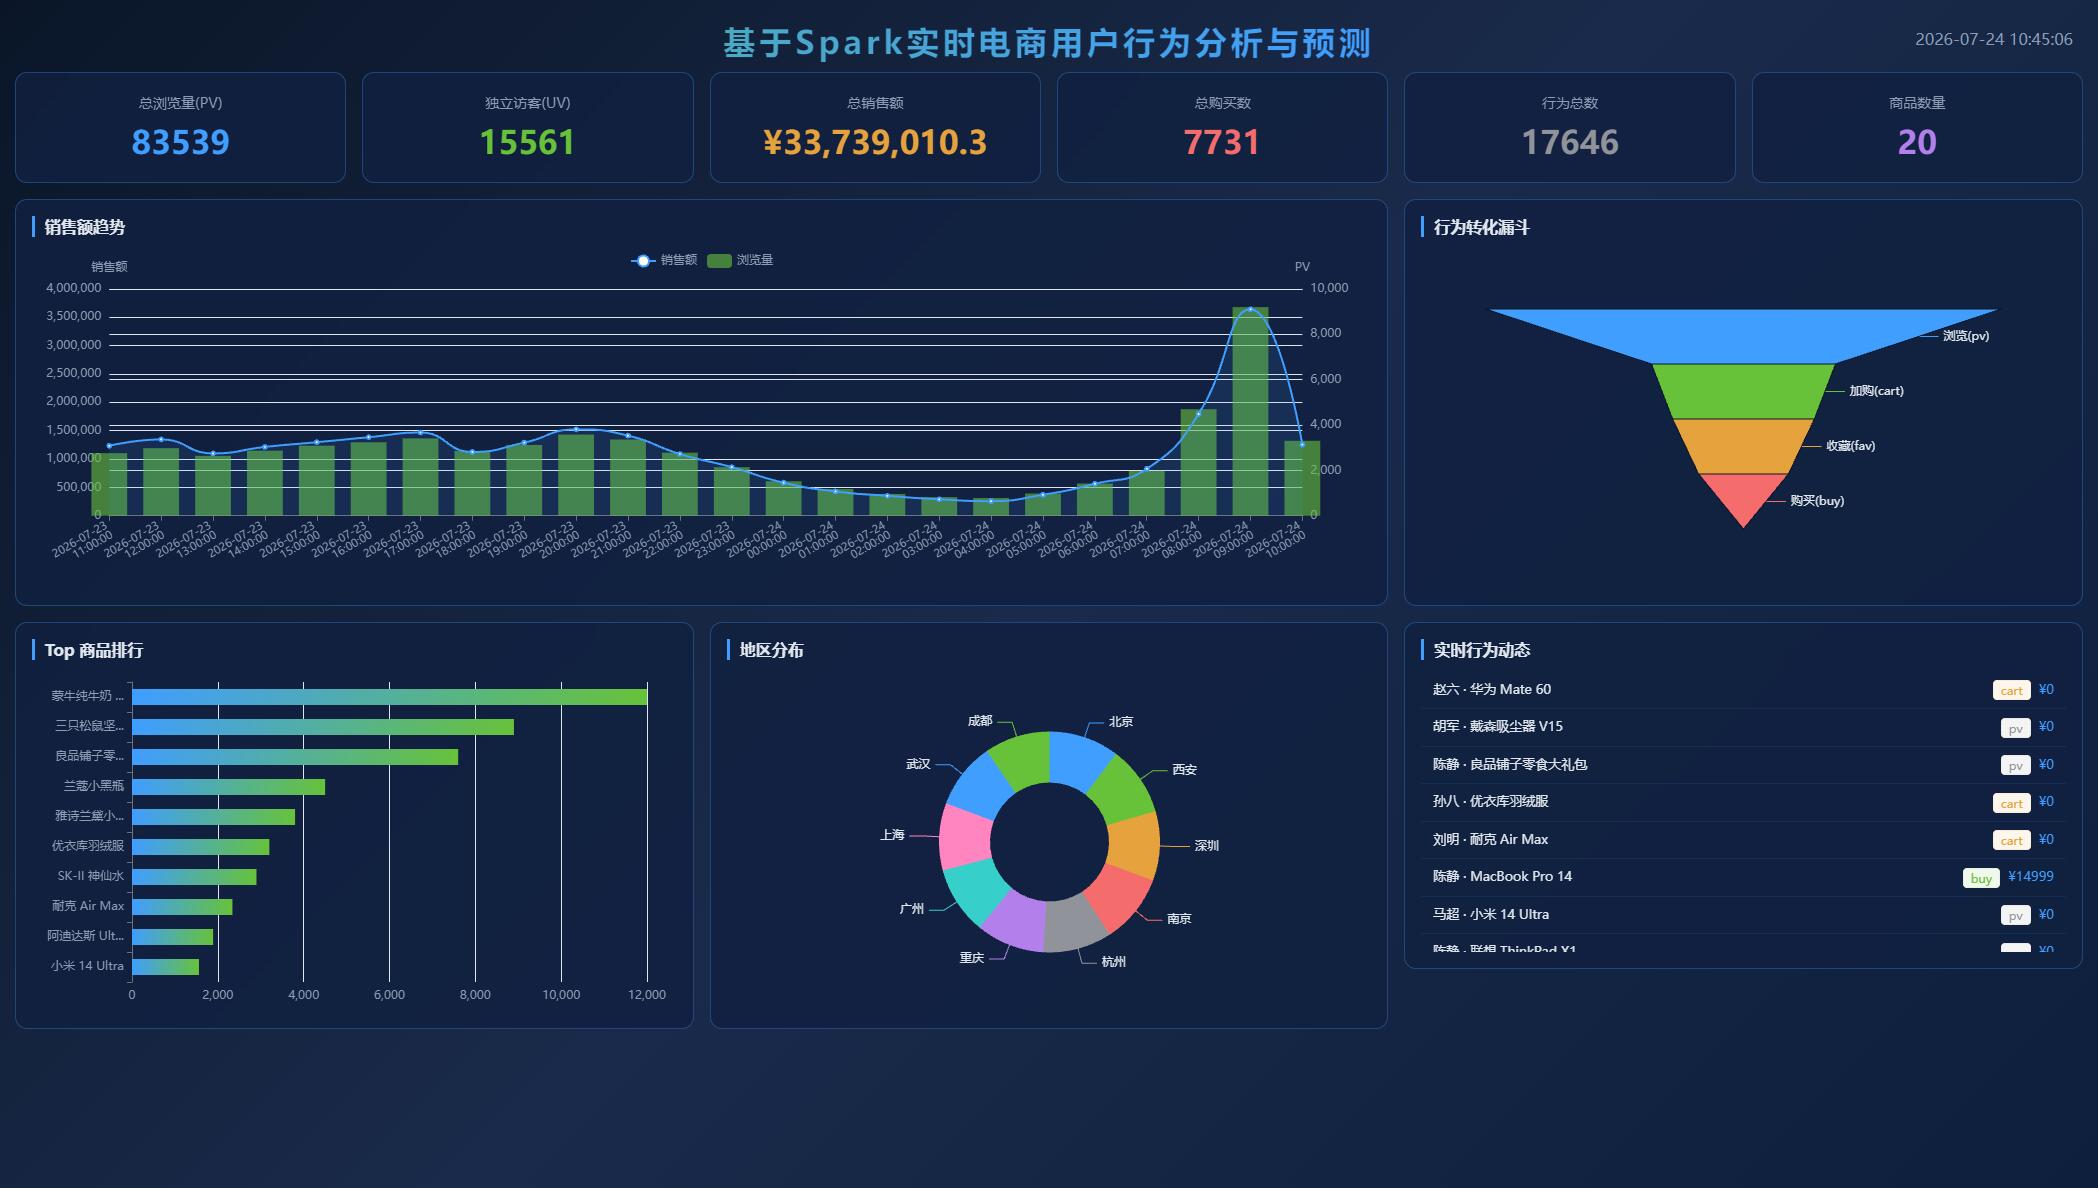
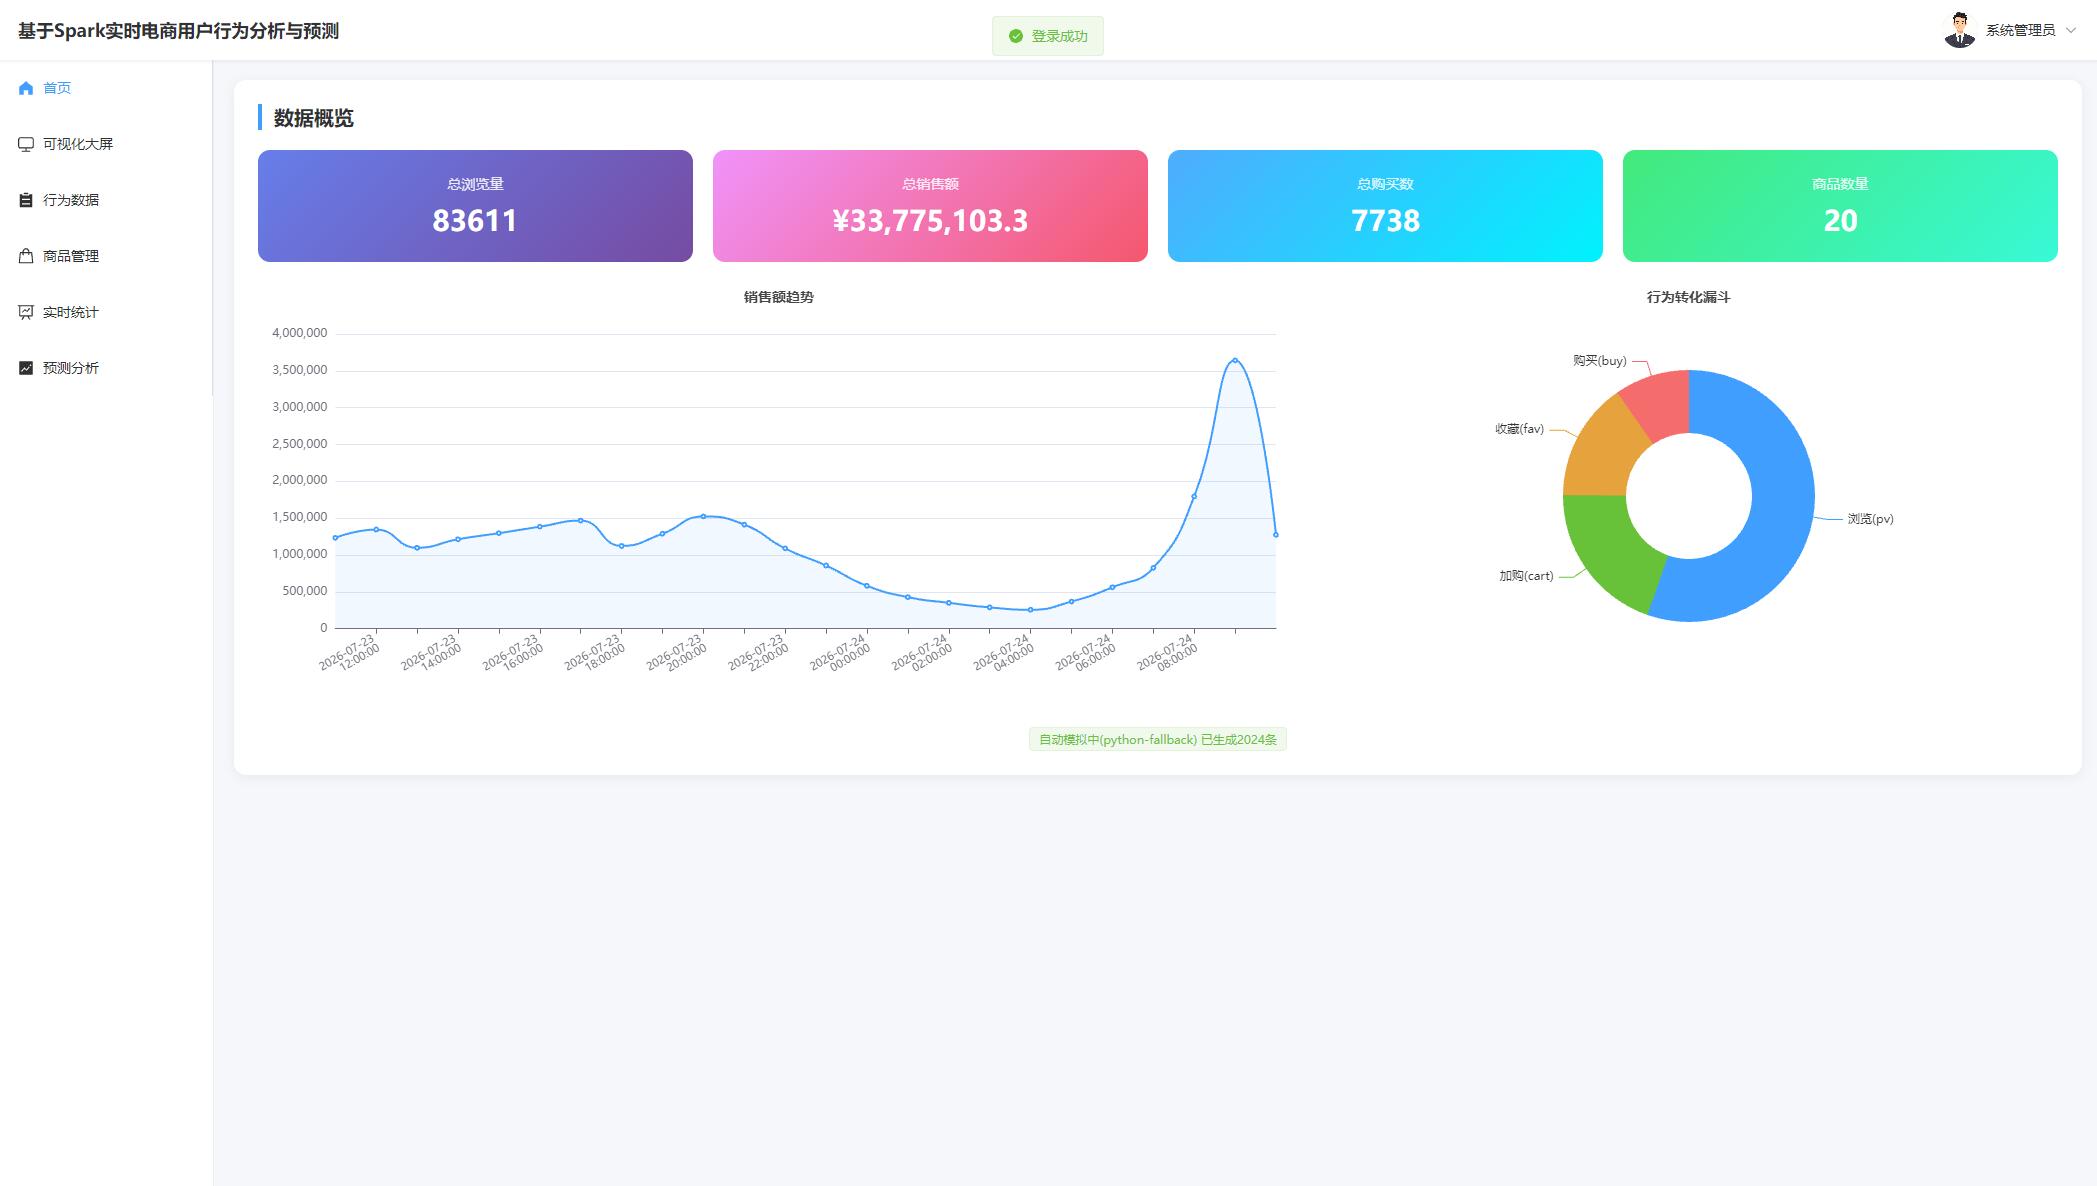
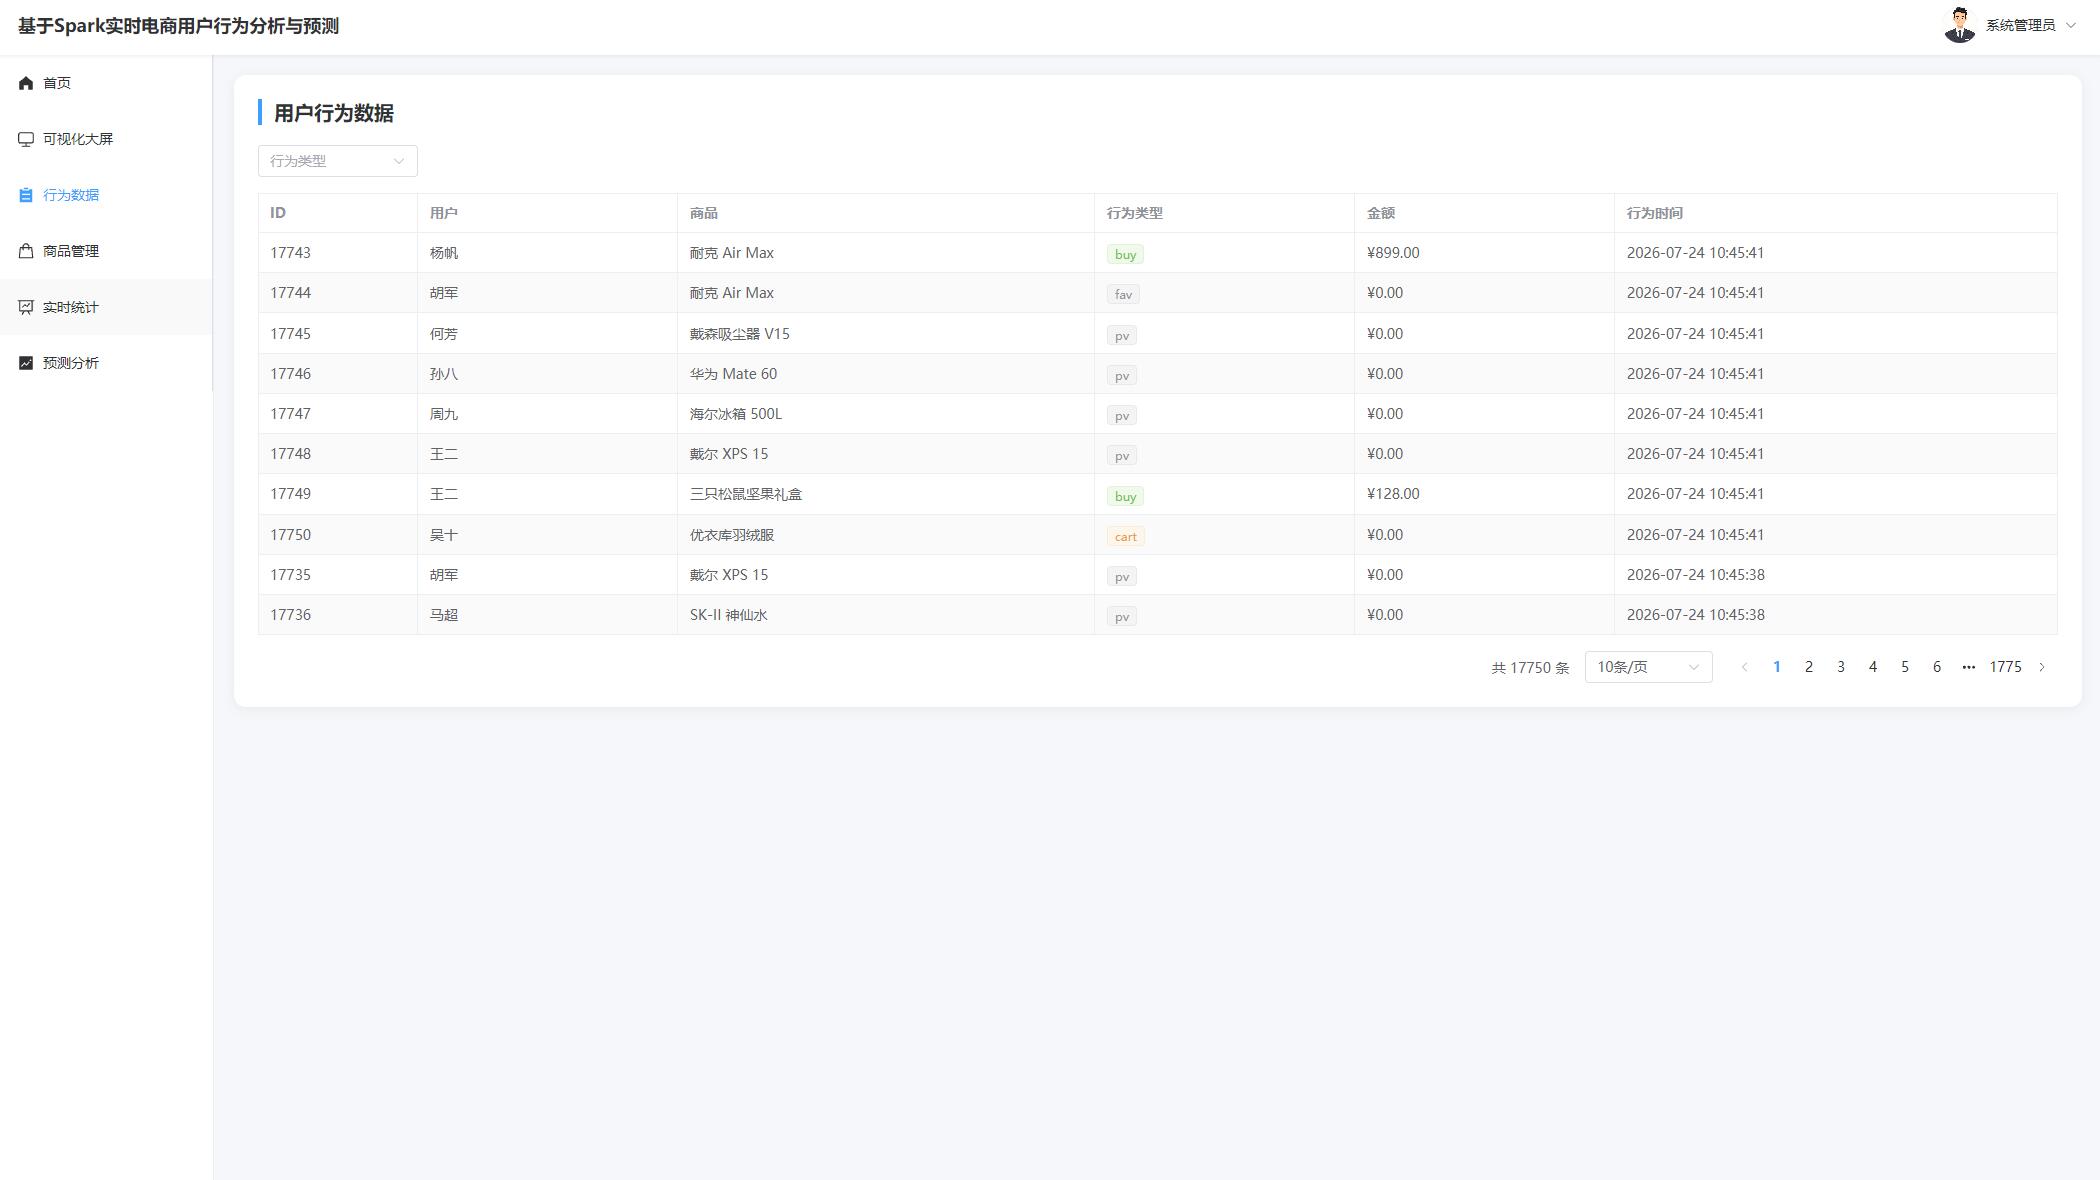
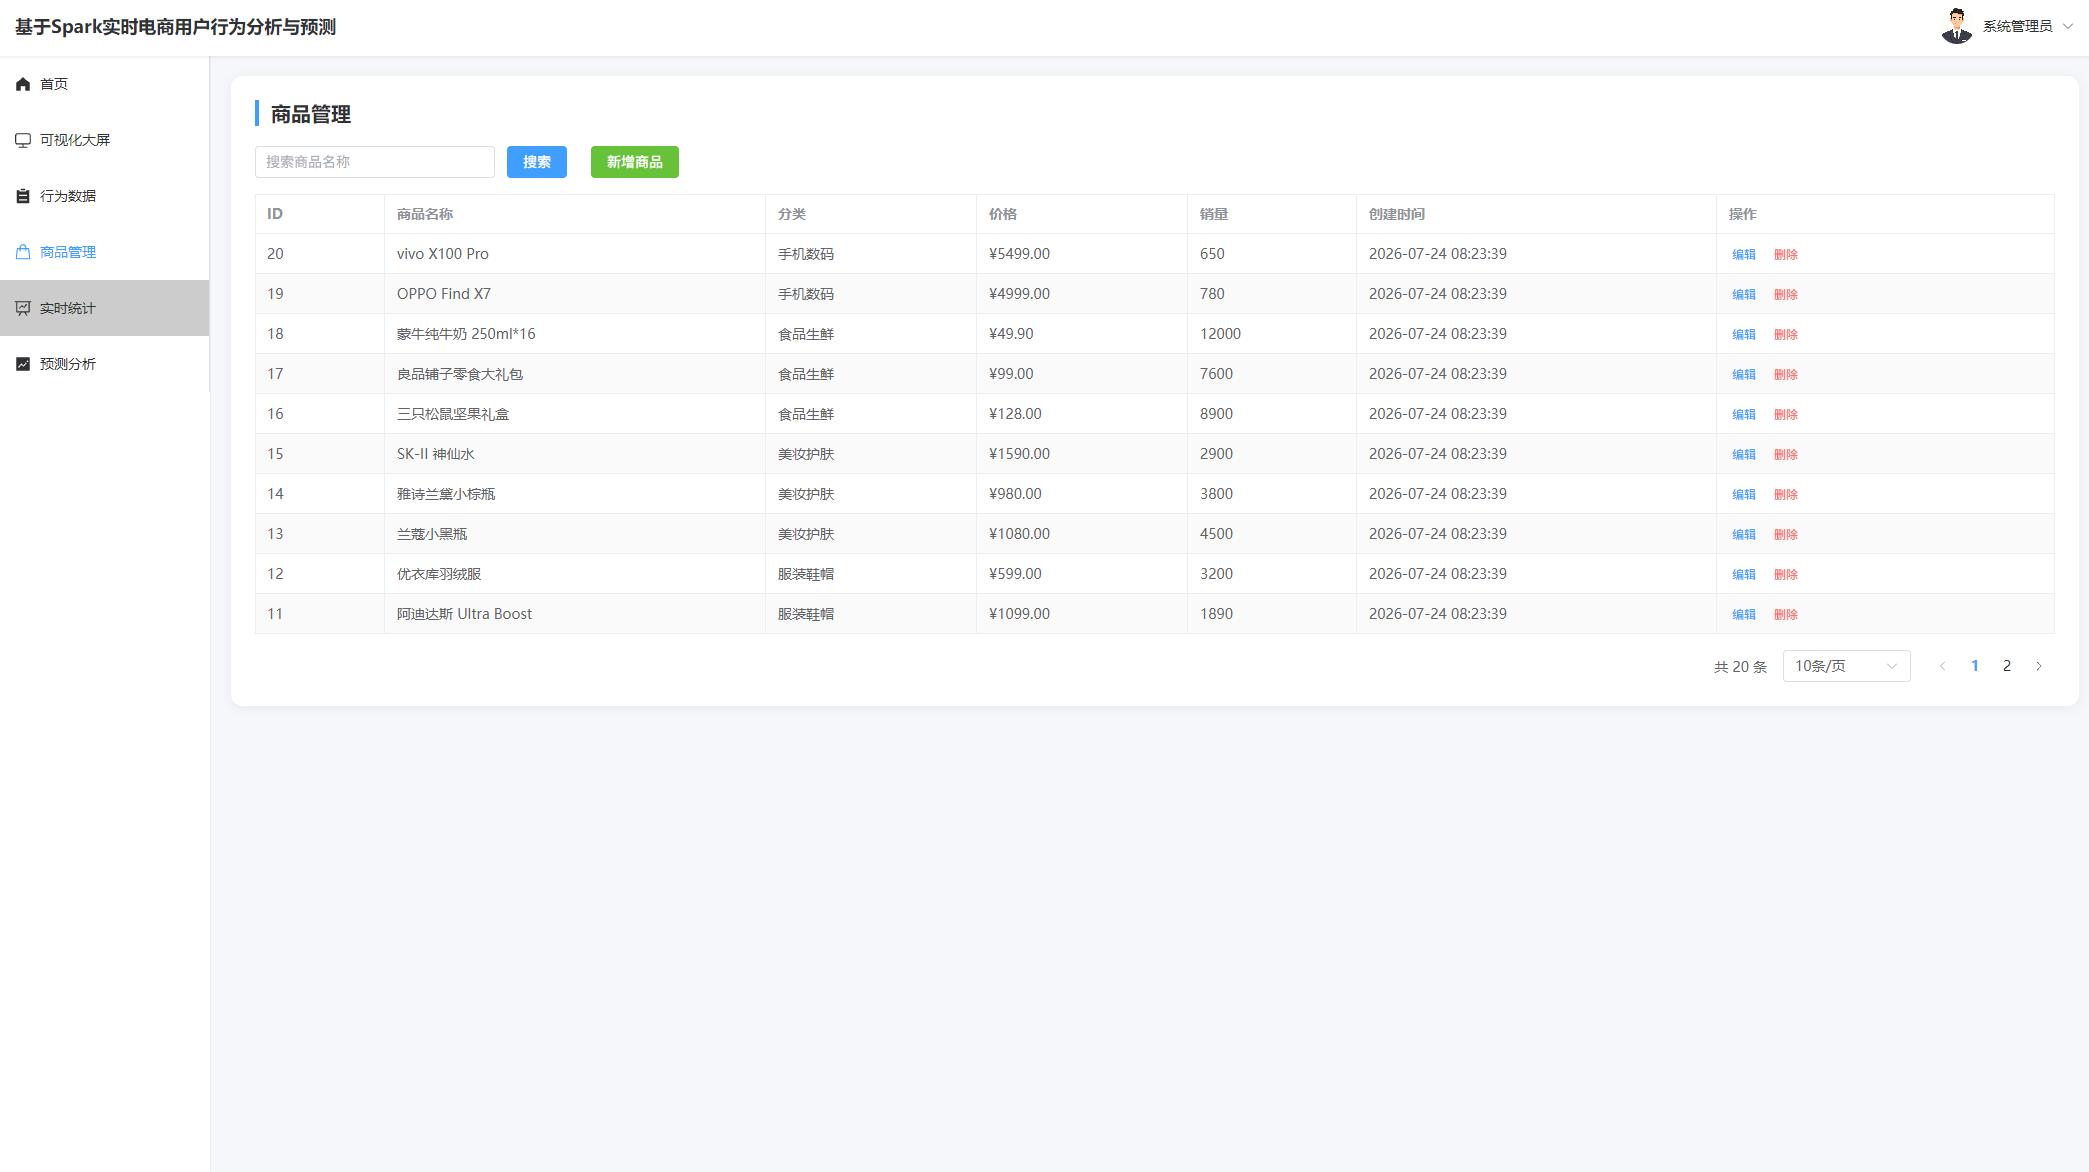
本文设计并实现了基于 Spark 的实时电商用户行为分析与预测系统。系统采用前后端分离架构,后端以 Java 与 Spring Boot 为核心构建 REST 接口服务,结合 Apache Kafka 完成行为事件的异步投递与缓冲,利用 Spark MLlib 对窗口销售额进行线性回归预测,并将结果持久化至 MySQL;前端基于 Vue3、Element Plus 与 ECharts 实现管理后台与可视化大屏。系统主要功能包括管理员登录与个人中心、数据概览、行为数据查询、商品管理、实时统计、销售额预测以及可视化大屏展示。
在数据分析方面,系统通过行为模拟器持续生成 pv、cart、fav、buy 四类行为事件,按时间窗口聚合 PV、UV、加购数、收藏数、购买数和销售额等指标;在预测方面,采用滞后特征与小时特征构建训练集,优先使用 Spark 线性回归模型,并在异常情况下自动降级为 Java OLS 回归,保证服务可用性。测试结果表明,系统能够稳定完成实时统计与预测展示,界面交互清晰,能够满足本科毕业设计对完整性、可用性和技术综合性的要求。
源码下载
链接: https://pan.baidu.com/s/1bdwW7xpV4z9jKPVVHKTscg?pwd=1234
提取码: 1234
系统展示
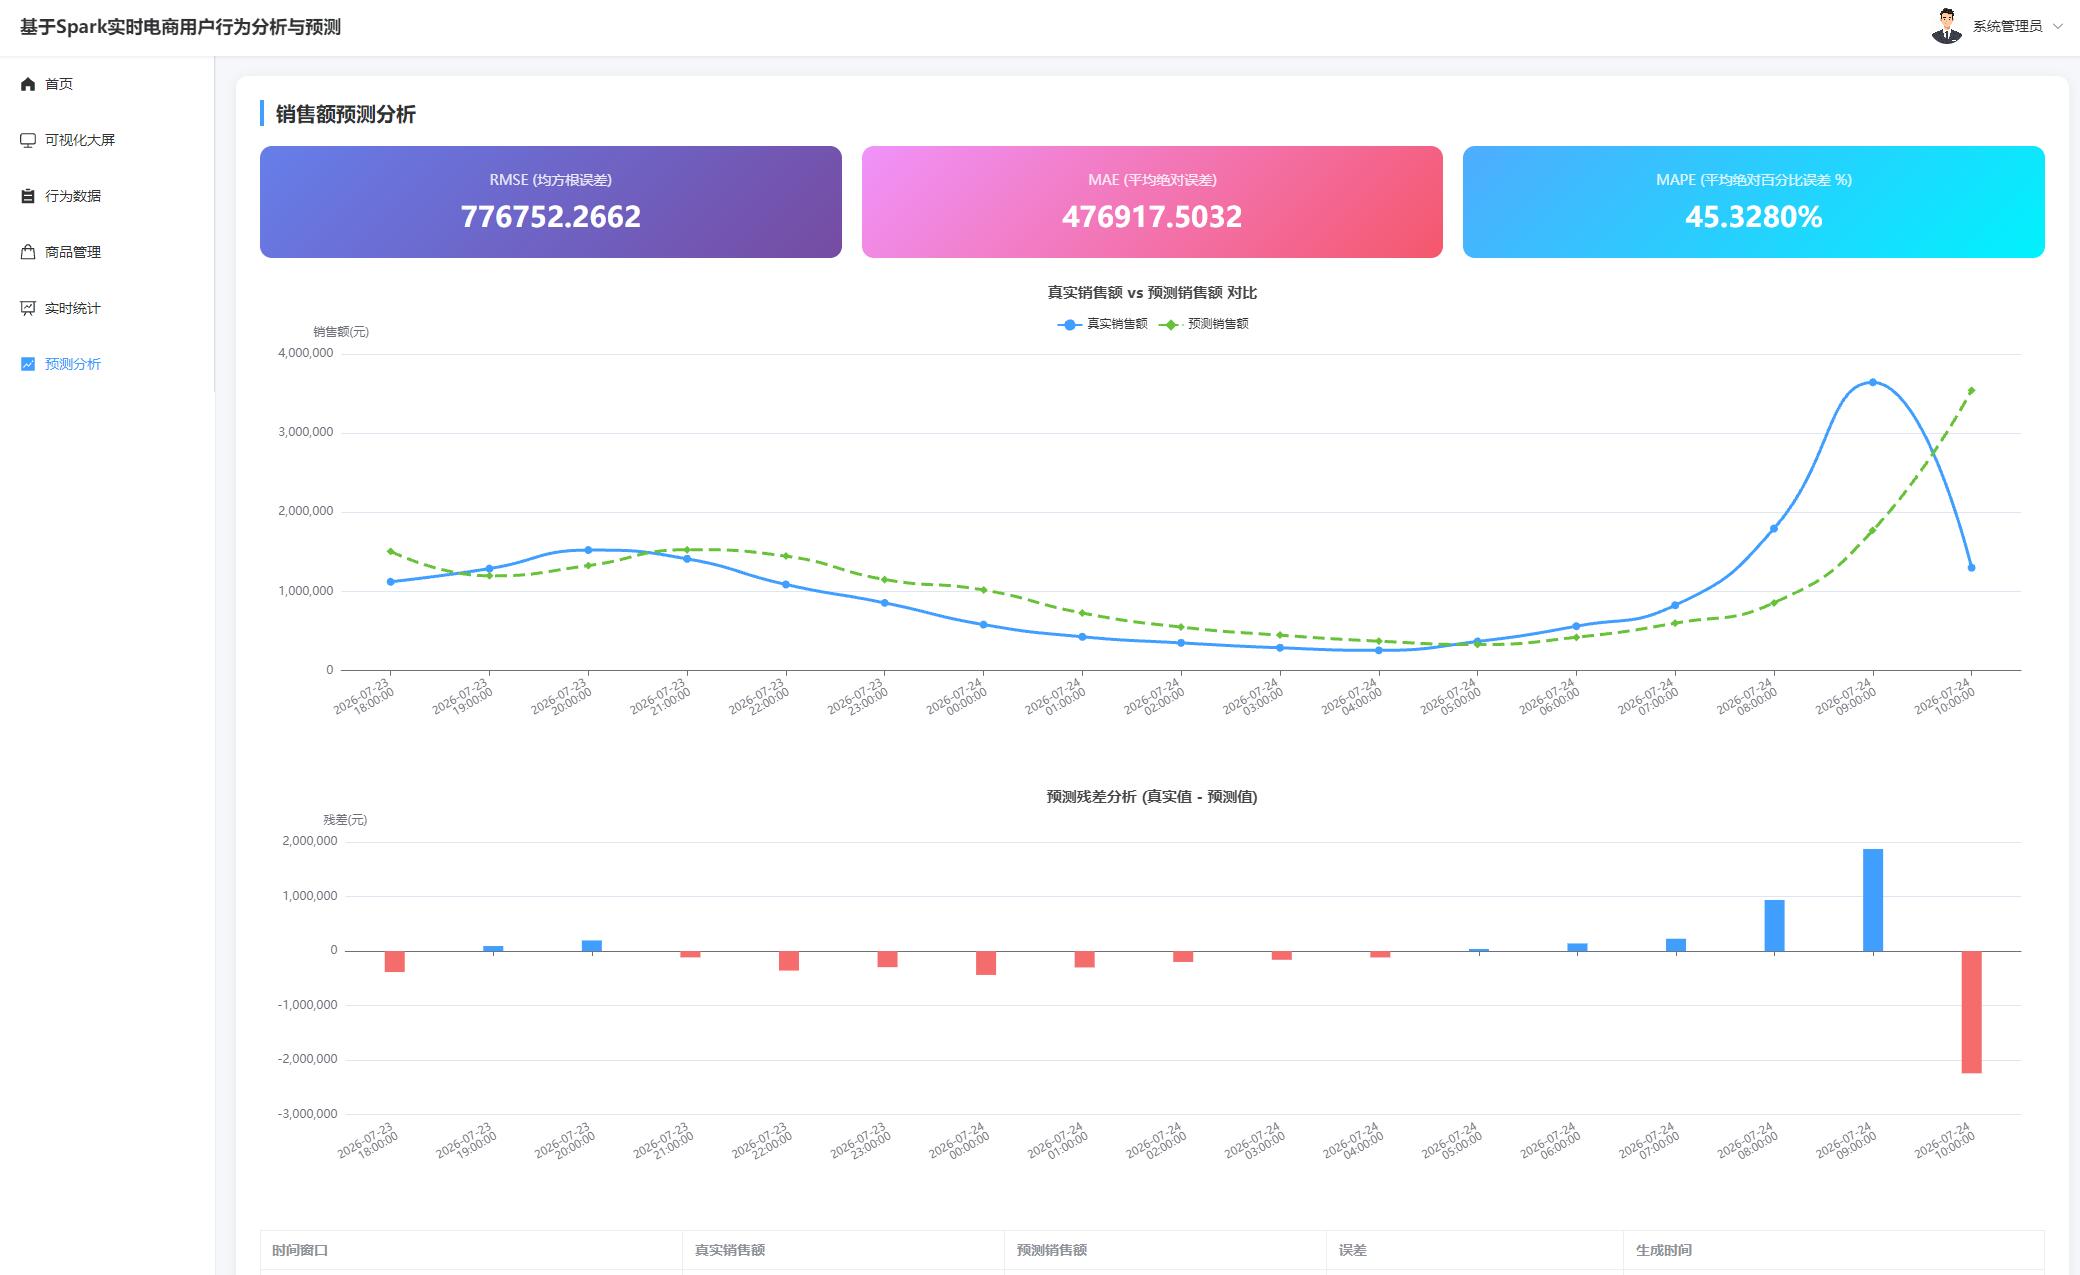


核心代码
java
package com.java1234.controller;

import com.java1234.common.PageResult;
import com.java1234.common.Result;
import com.java1234.dto.ErrorMetricOut;
import com.java1234.dto.PredictionOut;
import com.java1234.service.PredictionService;
import org.springframework.web.bind.annotation.GetMapping;
import org.springframework.web.bind.annotation.RequestMapping;
import org.springframework.web.bind.annotation.RequestParam;
import org.springframework.web.bind.annotation.RestController;

import java.util.List;
import java.util.Map;

/**
 * 预测分析控制器
 */
@RestController
@RequestMapping("/api/prediction")
public class PredictionController {

    private final PredictionService predictionService;

    public PredictionController(PredictionService predictionService) {
        this.predictionService = predictionService;
    }

    /**
     * 分页查询预测结果
     */
    @GetMapping("/list")
    public Result<PageResult<PredictionOut>> list(
            @RequestParam(defaultValue = "1") int page,
            @RequestParam(defaultValue = "10") int size) {
        return Result.ok(predictionService.list(page, size));
    }

    /**
     * 对比图表
     */
    @GetMapping("/compare")
    public Result<List<PredictionOut>> compare() {
        return Result.ok(predictionService.compare());
    }

    /**
     * 误差指标
     */
    @GetMapping("/error")
    public Result<ErrorMetricOut> error() {
        return Result.ok(predictionService.error());
    }

    /**
     * 残差数据
     */
    @GetMapping("/residual")
    public Result<List<Map<String, Object>>> residual() {
        return Result.ok(predictionService.residual());
    }
}
html
<template>
  <div class="page-container">
    <div class="page-card">
      <div class="page-title">销售额预测分析</div>

      <!-- 误差指标卡片 -->
      <div class="error-cards">
        <div class="error-card">
          <div class="metric-label">RMSE (均方根误差)</div>
          <div class="metric-value">{{ errorMetric.rmse }}</div>
        </div>
        <div class="error-card">
          <div class="metric-label">MAE (平均绝对误差)</div>
          <div class="metric-value">{{ errorMetric.mae }}</div>
        </div>
        <div class="error-card">
          <div class="metric-label">MAPE (平均绝对百分比误差 %)</div>
          <div class="metric-value">{{ errorMetric.mape }}%</div>
        </div>
      </div>

      <!-- 真实 vs 预测对比图 -->
      <div ref="compareRef" class="pred-chart pred-chart-compare"></div>

      <!-- 残差图 -->
      <div ref="residualRef" class="pred-chart pred-chart-residual"></div>

      <!-- 预测数据表格 -->
      <el-table :data="tableData" stripe border style="width:100%">
        <el-table-column prop="window_time" label="时间窗口" min-width="170">
          <template #default="{ row }">{{ formatWindowTime(row.window_time) }}</template>
        </el-table-column>
        <el-table-column prop="true_sales" label="真实销售额" min-width="130">
          <template #default="{ row }">
            <span style="color:#409eff;font-weight:600">¥{{ row.true_sales }}</span>
          </template>
        </el-table-column>
        <el-table-column prop="pred_sales" label="预测销售额" min-width="130">
          <template #default="{ row }">
            <span style="color:#67c23a;font-weight:600">¥{{ row.pred_sales }}</span>
          </template>
        </el-table-column>
        <el-table-column label="误差" min-width="120">
          <template #default="{ row }">
            <span :style="{ color: Math.abs(row.true_sales - row.pred_sales) > 500 ? '#f56c6c' : '#909399' }">
              ¥{{ (row.true_sales - row.pred_sales).toFixed(2) }}
            </span>
          </template>
        </el-table-column>
        <el-table-column prop="create_time" label="生成时间" min-width="170">
          <template #default="{ row }">{{ formatDateTime(row.create_time) }}</template>
        </el-table-column>
      </el-table>
      <el-pagination
        style="margin-top:16px;justify-content:flex-end"
        v-model:current-page="page"
        v-model:page-size="size"
        :total="total"
        layout="total, prev, pager, next"
        @change="loadTable"
      />
    </div>
  </div>
</template>

<script setup>
import { ref, onMounted, onUnmounted } from 'vue'
import * as echarts from 'echarts'
import request from '@/utils/request'
import { formatDateTime, formatWindowTime } from '@/utils/format'

const errorMetric = ref({ rmse: 0, mae: 0, mape: 0 })
const tableData = ref([])
const page = ref(1)
const size = ref(10)
const total = ref(0)
const compareRef = ref(null)
const residualRef = ref(null)
let charts = []

/**
 * X 轴日期时间标签配置(分行显示,避免底部裁切)
 */
function buildAxisLabel() {
  return {
    rotate: 30,
    interval: 'auto',
    hideOverlap: true,
    fontSize: 11,
    margin: 16,
    formatter(val) {
      const text = formatWindowTime(val)
      if (text.length >= 16) return `${text.slice(0, 10)}\n${text.slice(11)}`
      return text
    },
  }
}

/**
 * 初始化真实销售额 vs 预测销售额对比图
 */
function initCompareChart(data) {
  const chart = echarts.init(compareRef.value)
  const labels = data.map(d => formatWindowTime(d.window_time))
  chart.setOption({
    title: { text: '真实销售额 vs 预测销售额 对比', left: 'center', textStyle: { fontSize: 15 } },
    tooltip: {
      trigger: 'axis',
      formatter(params) {
        const idx = params[0]?.dataIndex ?? 0
        const lines = [labels[idx] || '']
        params.forEach(p => lines.push(`${p.marker}${p.seriesName}: ${p.value}`))
        return lines.join('<br/>')
      },
    },
    // 图例放顶部,避免与底部日期重叠
    legend: { data: ['真实销售额', '预测销售额'], top: 32 },
    xAxis: {
      type: 'category',
      data: labels,
      axisTick: { alignWithLabel: true },
      axisLabel: buildAxisLabel(),
    },
    yAxis: { type: 'value', name: '销售额(元)' },
    series: [
      {
        name: '真实销售额',
        type: 'line',
        smooth: true,
        data: data.map(d => Number(d.true_sales)),
        itemStyle: { color: '#409eff' },
        lineStyle: { width: 3 },
        symbol: 'circle',
        symbolSize: 8,
      },
      {
        name: '预测销售额',
        type: 'line',
        smooth: true,
        data: data.map(d => Number(d.pred_sales)),
        itemStyle: { color: '#67c23a' },
        lineStyle: { width: 3, type: 'dashed' },
        symbol: 'diamond',
        symbolSize: 8,
      },
    ],
    grid: { left: 20, right: 24, bottom: 28, top: 72, containLabel: true },
  })
  charts.push(chart)
}

/**
 * 初始化预测残差分析图
 */
function initResidualChart(data) {
  const chart = echarts.init(residualRef.value)
  const labels = data.map(d => formatWindowTime(d.window_time))
  chart.setOption({
    title: { text: '预测残差分析 (真实值 - 预测值)', left: 'center', textStyle: { fontSize: 15 } },
    tooltip: {
      trigger: 'axis',
      formatter(params) {
        const idx = params[0]?.dataIndex ?? 0
        const p = params[0]
        return `${labels[idx] || ''}<br/>${p.marker}残差: ${p.value}`
      },
    },
    xAxis: {
      type: 'category',
      data: labels,
      axisTick: { alignWithLabel: true },
      axisLabel: buildAxisLabel(),
    },
    yAxis: { type: 'value', name: '残差(元)' },
    series: [{
      type: 'bar',
      data: data.map(d => ({
        value: d.residual,
        itemStyle: { color: d.residual >= 0 ? '#409eff' : '#f56c6c' },
      })),
      barWidth: 20,
    }],
    grid: { left: 20, right: 24, bottom: 28, top: 56, containLabel: true },
  })
  charts.push(chart)
}

/**
 * 加载预测图表与误差指标
 */
async function loadData() {
  const [errorRes, compareRes, residualRes] = await Promise.all([
    request.get('/prediction/error'),
    request.get('/prediction/compare'),
    request.get('/prediction/residual'),
  ])
  errorMetric.value = errorRes.data
  charts.forEach(c => c.dispose())
  charts = []
  initCompareChart(compareRes.data)
  initResidualChart(residualRes.data)
}

/**
 * 分页加载预测结果表格
 */
async function loadTable() {
  const res = await request.get('/prediction/list', { params: { page: page.value, size: size.value } })
  tableData.value = res.data.items
  total.value = res.data.total
}

onMounted(() => { loadData(); loadTable() })
onUnmounted(() => charts.forEach(c => c.dispose()))
</script>

<style scoped>
/* 预留足够高度,保证倾斜日期时间不被裁切 */
.pred-chart {
  width: 100%;
  margin-bottom: 24px;
}
.pred-chart-compare {
  height: 480px;
}
.pred-chart-residual {
  height: 420px;
}
</style>