知识点:
-
数据绑定 ()
-
X轴上显示点数(主类中)
-
添加随机值在图表中 (值针对Y轴值)
-
清空图表
-
图标titel显示
实例
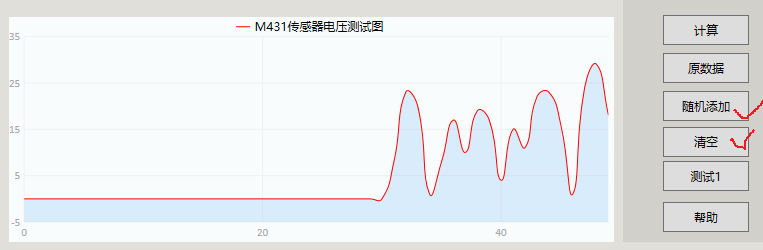
html
 <lvc:CartesianChart x:Name="LiveCharts1"
                    Margin="10,200,185,10"
                    Series="{Binding SeriesCollection}"  //BeanDataKalman.cs中
                    Background="#FFF8FCFD"
                    LegendLocation="Top" >

</lvc:CartesianChart>
BeanDataKalman.cs
cs
using System;
using System.Collections.Generic;
using System.ComponentModel;
using System.Runtime.CompilerServices;
using System.Text;
using System.Xml.Linq;
using LiveCharts;

namespace Wpf_Math.BeanDatas
{
    public class BeanDataKalman : INotifyPropertyChanged
    {

        private string _msgTips;
        private SeriesCollection _seriesCollection;


        public BeanDataKalman()
        {
            // 在构造函数中初始化
            _seriesCollection = new SeriesCollection();
        }


        public string MsgTips
        {
            get => _msgTips;
            set { _msgTips = value; OnPropertyChanged(); }
        }

        public SeriesCollection SeriesCollection
        {
            get => _seriesCollection;
            set
            {
                if (_seriesCollection != value)
                {
                    _seriesCollection = value;
                    OnPropertyChanged();
                }
            }
        }

        public event PropertyChangedEventHandler? PropertyChanged;

        protected void OnPropertyChanged([CallerMemberName] string name = null)
        => PropertyChanged?.Invoke(this, new PropertyChangedEventArgs(name));
    }

}
主窗体调用
cs
using System;
using System.Collections.Generic;
using System.Diagnostics;
using System.Drawing.Printing;
using System.Reflection.Emit;
using System.Reflection.Metadata;
using System.Text;
using System.Windows;
using System.Windows.Controls;
using System.Windows.Data;
using System.Windows.Documents;
using System.Windows.Input;
using System.Windows.Media;
using System.Windows.Media.Animation;
using System.Windows.Media.Imaging;
using System.Windows.Media.Media3D;
using System.Windows.Navigation;
using System.Windows.Shapes;
using System.Xml.Linq;
using LiveCharts;
using LiveCharts.Defaults;
using LiveCharts.Wpf;
using Wpf_Math.BeanDatas;

namespace Wpf_Math.MyFilter_Kalman
{
    public partial class UC_KalmanFilter : UserControl
    {

        int i;
        BeanDataKalman beanData = new BeanDataKalman();
        private double[] Yvalue = new Double[50];      //Yvalue数据值    X轴上显示50点

        public UC_KalmanFilter()
        {
            InitializeComponent();
            this.DataContext = beanData;
            beanData.MsgTips = "提示:";
            InitializeLiveCharts1();
        }
        private void InitializeLiveCharts1()
        {

            LineSeries myLineseries = new LineSeries()         //实例化一条折线图
            {

                Title = "M431传感器电压测试图",                 //设置折线的标题
                StrokeThickness = 1,                          // 设置折线粗细
                LineSmoothness = 1,                           //折线图直线形式     0 or 1
                PointGeometry = null,                         //折线图的无点样式
                Values = new ChartValues<double>(Yvalue)      //添加折线图的数据
            };
            beanData.SeriesCollection.Add(myLineseries);
        }


        private void Button_Click(object sender, RoutedEventArgs e)
        {
            Button button = (Button)sender;
            switch (button.Name)
            {
                case "btn_add":      {addData();break; }
                case "btn_clear":
                    {

                        LiveCharts1.Series.Clear();  //只清空数据,不删除 Series
                        InitializeLiveCharts1();     //重复新初始化初始化
                        break;
                    }
                default: break;
            }
        }

        private void addData()
        {
             double n = new Random().Next(0, 30);
            //通过Dispatcher在工作线程中更新窗体的UI元素
            beanData.SeriesCollection[0].Values.Add(n);    //更新纵坐标数据
            beanData.SeriesCollection[0].Values.RemoveAt(0);
        }
    }

}