FastAPI + Echarts 构建可交互数据仪表板
项目概述
本项目是一个使用 uv + Python 3.14 + FastAPI 构建的 Web 服务示例。项目包含以下核心内容:
- 静态资源托管 :通过 FastAPI 的
StaticFiles中间件托管static/目录下的静态文件。 - CORS 跨域支持 :通过
CORSMiddleware中间件配置跨域访问策略。 - jQuery AJAX 示例 :首页通过本地引入的 jQuery 发起 AJAX 请求,调用
/api/hello接口并展示返回结果。 - ECharts 图表案例:提供折线图、柱状图、饼图、散点图四种常用图表的展示页面。
- 图表数据接口 :通过
/api/chart-data/{chart_type}接口为前端图表提供动态数据。
本教程将带领你了解项目的结构、启动方式以及各个功能模块的使用方法,所有代码均完整列出,按照教程即可独立完成开发。
项目目录结构
fastapi-app/
├── main.py                         # FastAPI 入口,包含路由与中间件配置
├── pyproject.toml                   # 项目依赖配置
├── uv.lock                          # 依赖锁定文件
├── .venv/                           # 虚拟环境
├── tutorial.md                      # 本教程文档
├── docs/
│   └── images/                      # 运行效果截图
│       ├── home.png
│       ├── charts_index.png
│       ├── line.png
│       ├── bar.png
│       ├── pie.png
│       └── scatter.png
└── static/                          # 静态资源根目录
    ├── index.html                   # 首页(jQuery AJAX 示例)
    ├── js/
    │   ├── jquery-4.0.0.min.js      # 本地 jQuery 库
    │   └── echarts.min.js           # 本地 ECharts 6.1.0 库
    └── charts/                      # ECharts 图表案例目录
        ├── index.html               # 图表案例索引页
        ├── line.html                # 折线图案例
        ├── bar.html                 # 柱状图案例
        ├── pie.html                 # 饼图案例
        └── scatter.html             # 散点图案例
环境准备
在运行本项目之前,请确保你的开发环境满足以下条件:
-
安装 uv:uv 是一个高性能的 Python 包管理器和运行器。如果尚未安装,可以通过以下命令安装:
bash# Windows (PowerShell) powershell -ExecutionPolicy ByPass -c "irm https://astral.sh/uv/install.ps1 | iex"安装完成后,在终端中运行
uv --version检查是否安装成功。 -
Python 版本 :本项目使用 Python 3.14。uv 会自动根据项目配置管理 Python 版本,无需手动安装。
-
安装依赖:在项目根目录执行以下命令初始化虚拟环境并安装依赖:
bash# 创建 Python 3.14 虚拟环境 uv venv --python 3.14 # 初始化项目并安装 FastAPI 和 Uvicorn uv init uv add fastapi uvicorn安装完成后,
pyproject.toml内容如下:toml[project] name = "fastapi-app" version = "0.1.0" description = "Add your description here" readme = "README.md" requires-python = ">=3.14" dependencies = [ "fastapi>=0.140.13", "uvicorn>=0.51.0", ]
项目启动
在项目根目录下打开终端,执行以下命令启动服务:
bash
uv run uvicorn main:app --host 127.0.0.1 --port 8000命令说明:
uv run:使用 uv 运行项目依赖环境中的命令。uvicorn:ASGI 服务器,用于运行 FastAPI 应用。main:app:表示从main.py文件中加载名为app的 FastAPI 实例。--host 127.0.0.1:服务监听本机地址。--port 8000:服务监听 8000 端口。
启动成功后,打开浏览器访问 http://127.0.0.1:8000,即可看到项目首页。
后端入口 main.py
main.py 是整个项目的后端入口,负责创建 FastAPI 应用、挂载静态资源、配置 CORS 跨域、提供 API 接口。完整代码如下:
python
# 从 fastapi 包导入 FastAPI 类,用于创建 Web 应用实例
from fastapi import FastAPI
# 从 fastapi.staticfiles 导入 StaticFiles,用于挂载静态文件目录
from fastapi.staticfiles import StaticFiles
# 从 fastapi.middleware.cors 导入 CORSMiddleware,用于处理跨域请求
from fastapi.middleware.cors import CORSMiddleware
# 从 fastapi.responses 导入 FileResponse,用于返回本地文件作为响应
from fastapi.responses import FileResponse
# 从 fastapi 导入 HTTPException,用于返回 HTTP 错误响应
from fastapi import HTTPException

# 创建 FastAPI 应用实例,app 是整个 Web 服务的入口对象
app = FastAPI()

# 挂载静态文件服务:
# 第一个参数 "/static" 是 URL 路径前缀,
# StaticFiles(directory="static") 指定本地 static 目录为静态资源根目录,
# name="static" 是给该挂载点起的名称,便于反向生成 URL
app.mount("/static", StaticFiles(directory="static"), name="static")

# 为 FastAPI 应用添加 CORS(跨域资源共享)中间件
app.add_middleware(
    # 使用 CORSMiddleware 中间件类
    CORSMiddleware,
    # allow_origins 允许的来源列表,["*"] 表示允许所有来源访问
    allow_origins=["*"],
    # allow_credentials 是否允许携带身份凭证(如 Cookie),
    # 由于与 allow_origins=["*"] 配合时需要反射 Origin,这里设为 False 以直接返回 *
    allow_credentials=False,
    # allow_methods 允许的 HTTP 方法列表,["*"] 表示允许 GET/POST/PUT/DELETE 等所有方法
    allow_methods=["*"],
    # allow_headers 允许的请求头列表,["*"] 表示允许所有自定义请求头
    allow_headers=["*"],
)

# 定义根路径 "/" 的 GET 路由
@app.get("/")
# 路由处理函数:当用户访问首页时执行
def read_root():
    # 返回 static/index.html 文件内容,作为首页展示
    return FileResponse("static/index.html")

# 定义 "/api/hello" 路径的 GET 路由,用于前端 AJAX 调用测试
@app.get("/api/hello")
# 路由处理函数:返回一段 JSON 数据
def read_hello():
    # 返回包含 message 字段的字典,FastAPI 会自动将其序列化为 JSON
    return {"message": "Hello from FastAPI!"}


# 定义 "/api/chart-data/{chart_type}" 路径的 GET 路由,用于返回 ECharts 图表数据
@app.get("/api/chart-data/{chart_type}")
# 路由处理函数:根据 chart_type 返回对应类型的图表数据
def get_chart_data(chart_type: str):
    # 允许的图表类型列表
    allowed_types = {"line", "bar", "pie", "scatter"}
    # 如果请求的类型不在允许列表中,返回 HTTP 400 错误
    if chart_type not in allowed_types:
        raise HTTPException(status_code=400, detail=f"Invalid chart_type: {chart_type}. Allowed values: line, bar, pie, scatter")

    # line 类型:返回折线图数据
    if chart_type == "line":
        return {
            "categories": ["Mon", "Tue", "Wed", "Thu", "Fri", "Sat", "Sun"],
            "values": [120, 200, 150, 80, 70, 110, 130],
        }

    # bar 类型:返回柱状图数据
    if chart_type == "bar":
        return {
            "categories": ["Mon", "Tue", "Wed", "Thu", "Fri", "Sat", "Sun"],
            "values": [120, 200, 150, 80, 70, 110, 130],
        }

    # pie 类型:返回饼图数据
    if chart_type == "pie":
        return {
            "data": [
                {"value": 1048, "name": "Search Engine"},
                {"value": 735, "name": "Direct"},
                {"value": 580, "name": "Email"},
                {"value": 484, "name": "Union Ads"},
                {"value": 300, "name": "Video Ads"},
            ]
        }

    # scatter 类型:返回散点图数据
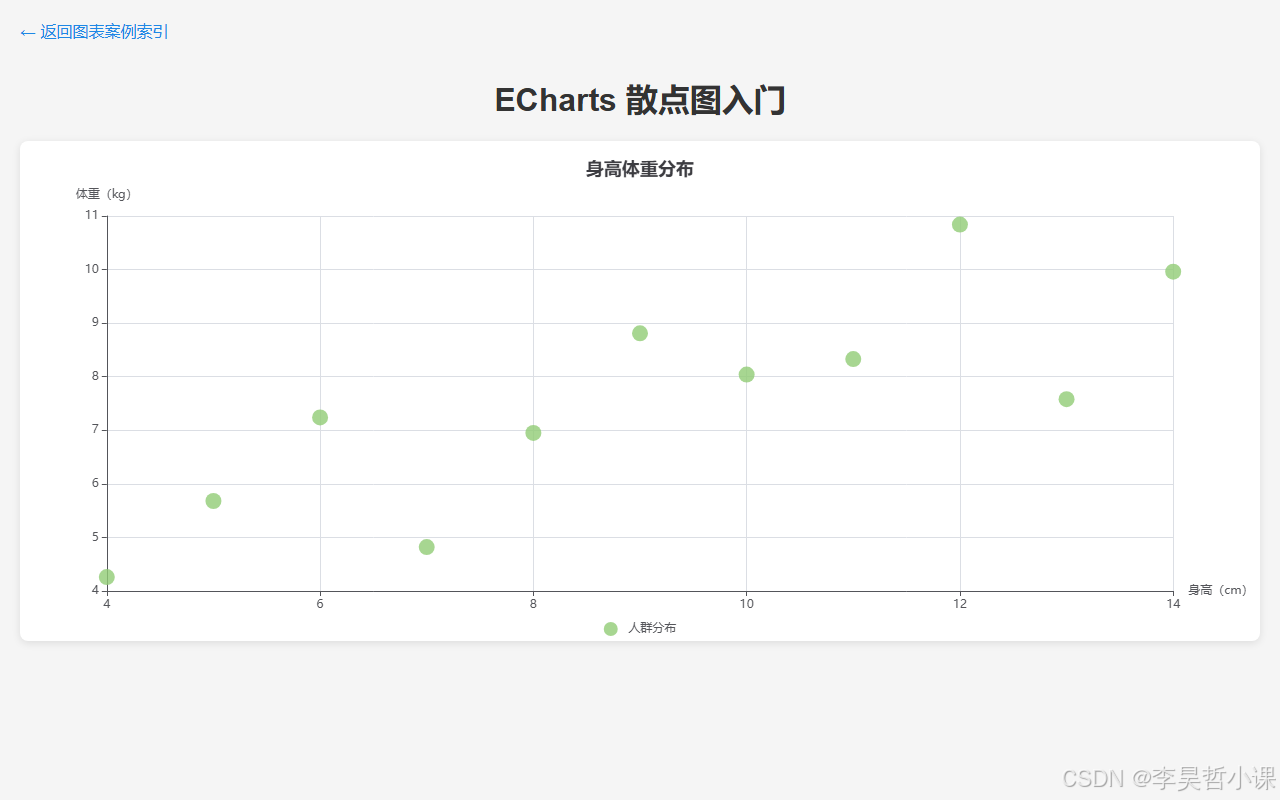
    if chart_type == "scatter":
        return {
            "data": [
                [10.0, 8.04],
                [8.0, 6.95],
                [13.0, 7.58],
                [9.0, 8.81],
                [11.0, 8.33],
                [14.0, 9.96],
                [6.0, 7.24],
                [4.0, 4.26],
                [12.0, 10.84],
                [7.0, 4.82],
                [5.0, 5.68],
            ]
        }
静态资源托管
本项目使用 FastAPI 提供的 StaticFiles 将 static/ 目录挂载为静态资源目录:
python
app.mount("/static", StaticFiles(directory="static"), name="static")static/目录下的所有文件(如 HTML、CSS、JavaScript、图片等)都可以通过/static/文件名的路径访问。- 首页路由(
/)会直接返回static/index.html文件的内容,因此访问http://127.0.0.1:8000时,看到的就是首页页面。
CORS 跨域配置
CORS(Cross-Origin Resource Sharing,跨域资源共享)是一种浏览器安全机制,允许或限制不同源(域名、端口、协议)之间的资源请求。本项目配置了 CORSMiddleware 中间件来处理跨域请求:
python
app.add_middleware(
    CORSMiddleware,
    allow_origins=["*"],       # 允许所有来源访问
    allow_credentials=False,   # 不携带 Cookie 等凭据(与 "*" 配合时必须为 False)
    allow_methods=["*"],       # 允许所有 HTTP 方法
    allow_headers=["*"],        # 允许所有自定义请求头
)
各参数含义:
allow_origins:允许访问的源列表。设置为["*"]表示允许所有来源。allow_credentials:是否允许携带 Cookie 等凭据信息。注意:当allow_origins为["*"]时,Starlette 会反射实际 Origin 而非返回*,因此需设为False才能直接返回Access-Control-Allow-Origin: *。allow_methods:允许的 HTTP 方法列表,例如GET、POST等。allow_headers:允许的请求头列表。
通过该配置,前端页面可以正常向后端接口发起请求,而不会被浏览器拦截。
图表数据接口
前端图表页面通过调用后端接口获取数据,接口路径为:
GET /api/chart-data/{chart_type}其中 {chart_type} 为图表类型参数,支持以下取值:
line:折线图bar:柱状图pie:饼图scatter:散点图
如果传入不支持的类型,接口将返回 HTTP 400 错误,提示允许的参数值。
各类型返回的 JSON 数据结构
折线图(line)
返回 categories 作为 X 轴类目数据,values 作为对应的系列数值:
json
{
  "categories": ["Mon", "Tue", "Wed", "Thu", "Fri", "Sat", "Sun"],
  "values": [120, 200, 150, 80, 70, 110, 130]
}
柱状图(bar)
与折线图数据结构相同,使用 categories 作为类目,values 作为柱子高度:
json
{
  "categories": ["Mon", "Tue", "Wed", "Thu", "Fri", "Sat", "Sun"],
  "values": [120, 200, 150, 80, 70, 110, 130]
}
饼图(pie)
返回 data 数组,每个元素包含 value(数值)和 name(名称):
json
{
  "data": [
    {"value": 1048, "name": "Search Engine"},
    {"value": 735, "name": "Direct"},
    {"value": 580, "name": "Email"},
    {"value": 484, "name": "Union Ads"},
    {"value": 300, "name": "Video Ads"}
  ]
}
散点图(scatter)
返回 data 数组,每个元素为包含 X 轴和 Y 轴取值的二维数组:
json
{
  "data": [
    [10.0, 8.04],
    [8.0, 6.95],
    [13.0, 7.58],
    [9.0, 8.81],
    [11.0, 8.33],
    [14.0, 9.96],
    [6.0, 7.24],
    [4.0, 4.26],
    [12.0, 10.84],
    [7.0, 4.82],
    [5.0, 5.68]
  ]
}
首页 static/index.html
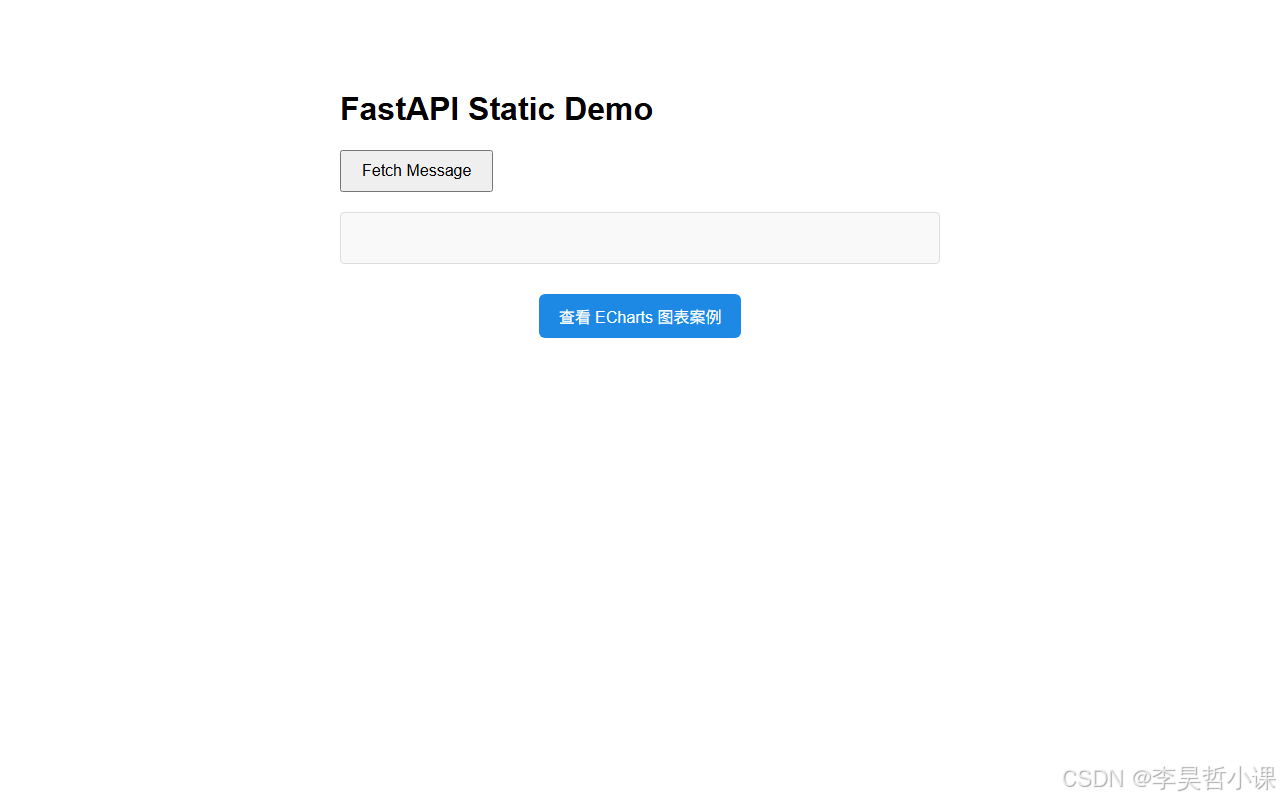
首页展示了 jQuery AJAX 的基本用法:页面引入本地 jQuery,点击按钮后通过 AJAX 调用 /api/hello 接口,并将返回结果展示在页面上。同时页面底部提供了进入 ECharts 图表案例的入口链接。完整代码如下:
html
<!-- 声明文档类型为 HTML5 -->
<!DOCTYPE html>
<!-- 根元素,lang="en" 表示页面主要语言为英文 -->
<html lang="en">
<!-- head 区域:包含页面的元数据、标题和样式 -->
<head>
    <!-- 设置字符编码为 UTF-8,防止中文等字符乱码 -->
    <meta charset="UTF-8">
    <!-- 设置视口,使页面在移动设备上自适应宽度 -->
    <meta name="viewport" content="width=device-width, initial-scale=1.0">
    <!-- 设置浏览器标签页上显示的页面标题 -->
    <title>FastAPI Static Demo</title>
    <!-- style 标签:定义页面内部 CSS 样式 -->
    <style>
        /* body 选择器:设置整个页面的基础样式 */
        body {
            /* 设置页面字体为 Arial,若不可用则使用无衬线字体 */
            font-family: Arial, sans-serif;
            /* 设置内容区域最大宽度为 600 像素 */
            max-width: 600px;
            /* 上下外边距 50px,左右自动居中 */
            margin: 50px auto;
            /* 内边距 20 像素 */
            padding: 20px;
        }
        /* button 选择器:设置按钮样式 */
        button {
            /* 上下内边距 10px,左右内边距 20px */
            padding: 10px 20px;
            /* 字体大小 16 像素 */
            font-size: 16px;
            /* 鼠标悬停时显示手型指针 */
            cursor: pointer;
        }
        /* #result 选择器:设置结果显示区域的样式 */
        #result {
            /* 上方外边距 20 像素,与按钮分隔 */
            margin-top: 20px;
            /* 内边距 15 像素 */
            padding: 15px;
            /* 1 像素宽度的浅灰色实线边框 */
            border: 1px solid #ddd;
            /* 边框圆角 4 像素 */
            border-radius: 4px;
            /* 背景色为浅灰 */
            background-color: #f9f9f9;
            /* 最小高度 20 像素,保证空时也有占位 */
            min-height: 20px;
        }
    </style>
</head>
<!-- body 区域:页面可见内容 -->
<body>
    <!-- 页面主标题 -->
    <h1>FastAPI Static Demo</h1>
    <!-- 按钮,用户点击后触发 AJAX 请求,id="fetchBtn" 用于 JavaScript 选择 -->
    <button id="fetchBtn">Fetch Message</button>
    <!-- 用于展示 AJAX 请求结果的区域,id="result" 用于 JavaScript 填充内容 -->
    <div id="result"></div>

    <!-- 新增:ECharts 图表案例入口链接 -->
    <div style="margin-top: 30px; text-align: center;">
        <a href="/static/charts/index.html" style="display: inline-block; padding: 10px 20px; font-size: 16px; color: #fff; background-color: #1e88e5; text-decoration: none; border-radius: 6px; transition: background-color 0.3s ease;">
            查看 ECharts 图表案例
        </a>
    </div>

    <!-- 引入本地 static/js 目录下的 jQuery 文件,用于发起 AJAX 请求 -->
    <script src="/static/js/jquery-4.0.0.min.js"></script>
    <!-- script 标签:页面内部 JavaScript 逻辑 -->
    <script>
        // 等待整个 HTML 文档加载完成后再执行
        $(document).ready(function() {
            // 定义 fetchMessage 函数,用于向后端发起 AJAX 请求
            function fetchMessage() {
                // 使用 jQuery 的 ajax 方法发起异步 HTTP 请求
                $.ajax({
                    // 请求目标地址,即 FastAPI 提供的 /api/hello 接口
                    url: '/api/hello',
                    // 使用 HTTP GET 方法
                    method: 'GET',
                    // 请求成功时的回调函数,data 为后端返回的 JSON 数据
                    success: function(data) {
                        // 将返回数据中的 message 字段设置为 result div 的文本内容
                        $('#result').text(data.message);
                    },
                    // 请求失败时的回调函数
                    error: function(xhr, status, error) {
                        // 在 result 区域显示错误信息
                        $('#result').text('Error: ' + error);
                    }
                });
            }

            // 为 id="fetchBtn" 的按钮绑定点击事件,点击时调用 fetchMessage 函数
            $('#fetchBtn').on('click', fetchMessage);
        });
    </script>
</body>
</html>
jQuery AJAX 示例说明
示例流程如下:
-
页面加载完成后,jQuery 发起一个 GET 请求到
/api/hello。 -
后端返回一段 JSON 数据,例如:
json{ "message": "Hello from FastAPI!" } -
前端接收到响应后,将返回的内容展示在页面指定区域。
这种方式展示了前后端交互的基本流程,也是本项目中 AJAX 调用的典型用法。
常用图表案例
本项目集成了 ECharts 图表库,并在 static/charts/ 目录下存放了四种常用图表的案例页面。每个案例页面均通过 <script> 标签引入本地 static/js/echarts.min.js 和 static/js/jquery-4.0.0.min.js,然后使用 jQuery 的 $.ajax() 方法从 /api/chart-data/{chart_type} 接口获取动态数据,最后调用 ECharts 渲染图表。
项目启动后,可通过浏览器直接访问以下页面查看效果。
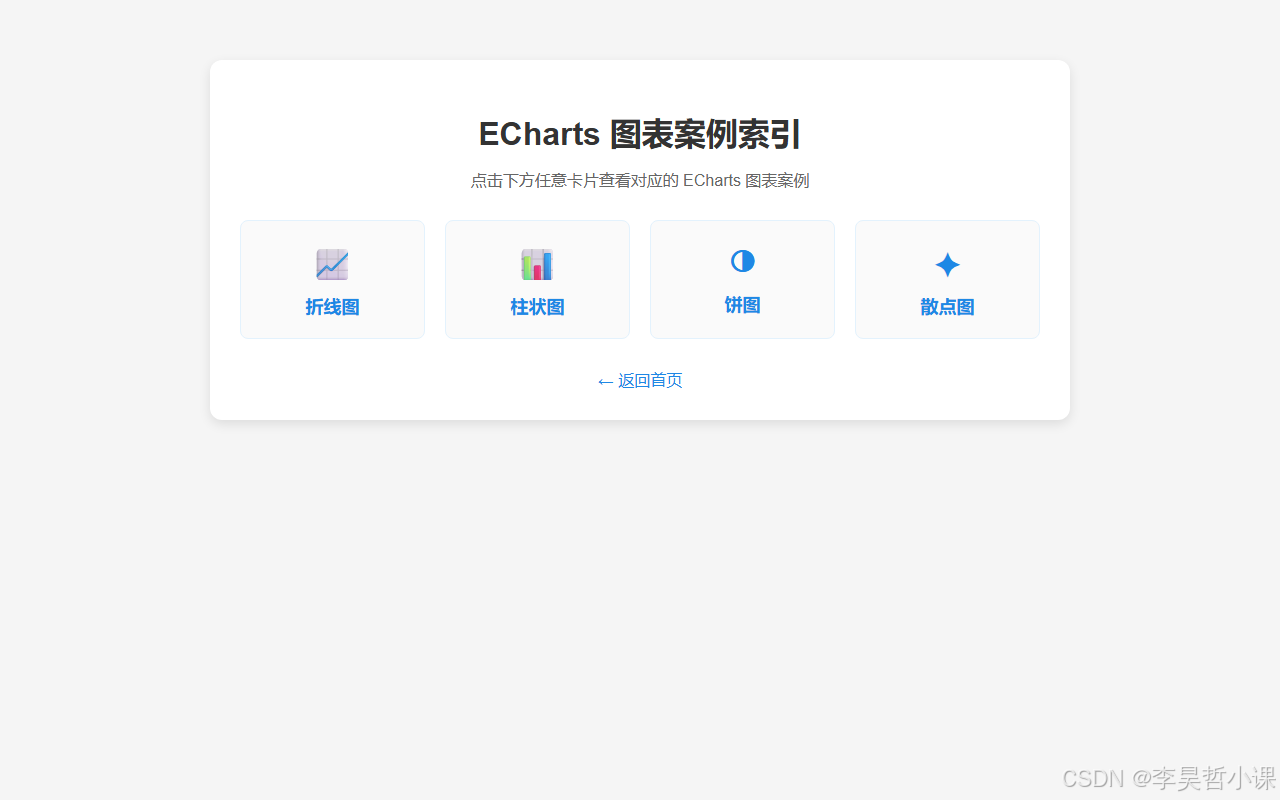
图表案例索引页 static/charts/index.html
图表索引页汇总了所有图表案例入口,使用 CSS Grid 布局展示卡片式导航。完整代码如下:
html
<!-- 声明文档类型为 HTML5 -->
<!DOCTYPE html>
<!-- 根元素,页面主要语言为中文 -->
<html lang="zh-CN">
<!-- head 区域:包含页面的元数据、标题和样式 -->
<head>
<!-- 设置字符编码为 UTF-8,防止中文等字符乱码 -->
<meta charset="UTF-8">
<!-- 设置视口,使页面在移动设备上自适应宽度 -->
<meta name="viewport" content="width=device-width, initial-scale=1.0">
<!-- 设置浏览器标签页上显示的页面标题 -->
<title>ECharts 图表案例索引</title>
<!-- style 标签:定义页面内部 CSS 样式 -->
<style>
/* body 选择器:设置整个页面的基础样式 */
body {
/* 设置页面字体,优先使用微软雅黑,保证中文显示美观 */
font-family: Arial, "Microsoft YaHei", sans-serif;
/* 页面背景色为浅灰 */
background-color: #f5f5f5;
/* 外边距和内边距清零 */
margin: 0;
padding: 0;
}
/* 页面容器,限制最大宽度并居中显示 */
.container {
/* 最大宽度 800 像素 */
max-width: 800px;
/* 上下外边距 60px,左右自动居中 */
margin: 60px auto;
/* 内边距 30 像素 */
padding: 30px;
/* 背景色为白色 */
background-color: #fff;
/* 边框圆角 12 像素 */
border-radius: 12px;
/* 添加轻微阴影,增强层次感 */
box-shadow: 0 4px 12px rgba(0, 0, 0, 0.1);
}
/* 页面主标题样式 */
h1 {
/* 文字居中 */
text-align: center;
/* 字体颜色为深灰 */
color: #333;
/* 底部外边距 10 像素 */
margin-bottom: 10px;
}
/* 副标题/说明文字样式 */
.subtitle {
/* 文字居中 */
text-align: center;
/* 字体颜色为灰色 */
color: #666;
/* 底部外边距 30 像素 */
margin-bottom: 30px;
}
/* 图表入口网格布局 */
.chart-grid {
/* 使用 CSS Grid 布局 */
display: grid;
/* 每列最小 160px,自动填充剩余空间 */
grid-template-columns: repeat(auto-fit, minmax(160px, 1fr));
/* 网格间距 20 像素 */
gap: 20px;
/* 底部外边距 30 像素 */
margin-bottom: 30px;
}
/* 单个图表入口卡片样式 */
.chart-card {
/* 块级弹性布局 */
display: flex;
/* 垂直方向排列 */
flex-direction: column;
/* 内容水平垂直居中 */
align-items: center;
justify-content: center;
/* 内边距 20 像素 */
padding: 20px;
/* 字体大小 18 像素 */
font-size: 18px;
/* 字体加粗 */
font-weight: bold;
/* 文字颜色为深蓝色 */
color: #1e88e5;
/* 去除下划线 */
text-decoration: none;
/* 边框为 1 像素浅蓝实线 */
border: 1px solid #e3f2fd;
/* 边框圆角 8 像素 */
border-radius: 8px;
/* 背景色为浅蓝 */
background-color: #fafafa;
/* 鼠标悬停时显示手型指针 */
cursor: pointer;
/* 添加过渡动画,使悬停效果更平滑 */
transition: all 0.3s ease;
}
/* 图表入口卡片悬停效果 */
.chart-card:hover {
/* 悬停时背景色变为浅蓝 */
background-color: #e3f2fd;
/* 阴影加深 */
box-shadow: 0 4px 12px rgba(30, 136, 229, 0.2);
/* 整体向上移动 2 像素 */
transform: translateY(-2px);
}
/* 图表图标样式 */
.chart-icon {
/* 图标字体大小 32 像素 */
font-size: 32px;
/* 底部外边距 10 像素 */
margin-bottom: 10px;
}
/* 返回首页链接容器 */
.home-link {
/* 文字居中 */
text-align: center;
}
/* 返回首页链接样式 */
.home-link a {
/* 链接颜色为蓝色 */
color: #1e88e5;
/* 去除下划线 */
text-decoration: none;
}
/* 返回首页链接悬停效果 */
.home-link a:hover {
/* 悬停时显示下划线 */
text-decoration: underline;
}
</style>
</head>
<!-- body 区域:页面可见内容 -->
<body>
<!-- 页面主容器 -->
<div class="container">
<!-- 页面主标题 -->
<h1>ECharts 图表案例索引</h1>
<!-- 页面副标题说明 -->
<p class="subtitle">点击下方任意卡片查看对应的 ECharts 图表案例</p>
<!-- 图表案例入口网格 -->
<div class="chart-grid">
<!-- 折线图案例入口 -->
<a href="line.html" class="chart-card">
<span class="chart-icon">📈</span>
<span>折线图</span>
</a>
<!-- 柱状图案例入口 -->
<a href="bar.html" class="chart-card">
<span class="chart-icon">📊</span>
<span>柱状图</span>
</a>
<!-- 饼图案例入口 -->
<a href="pie.html" class="chart-card">
<span class="chart-icon">◑</span>
<span>饼图</span>
</a>
<!-- 散点图案例入口 -->
<a href="scatter.html" class="chart-card">
<span class="chart-icon">✦</span>
<span>散点图</span>
</a>
</div>
<!-- 返回首页链接 -->
<div class="home-link">
<a href="/">← 返回首页</a>
</div>
</div>
</body>
</html>图表索引页运行效果如下:
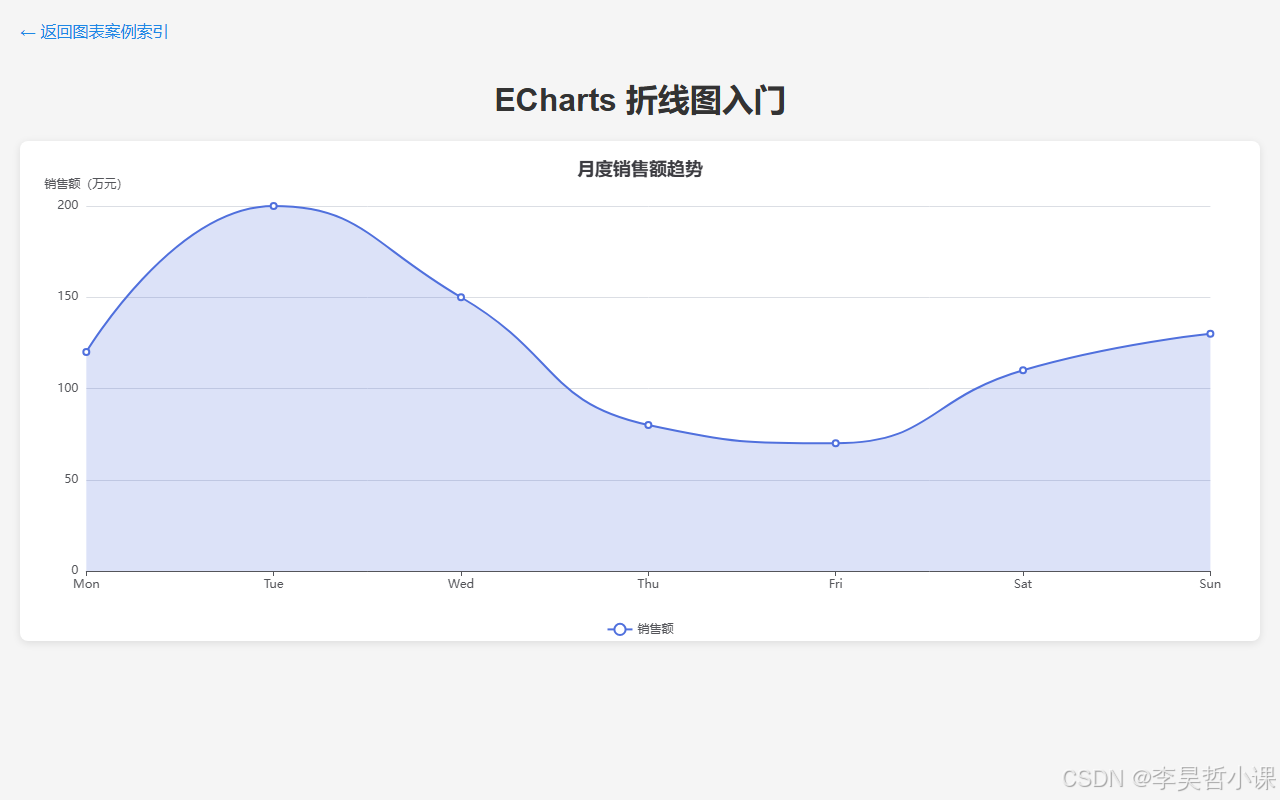
折线图 static/charts/line.html
- 访问 URL :
http://127.0.0.1:8000/static/charts/line.html - 数据接口 :
/api/chart-data/line - 特点简述:折线图通过连续的线段连接各个数据点,适合展示数据随时间变化的趋势。本案例展示了一周内销售额的变化趋势,并带有平滑曲线和面积填充效果。
完整代码如下:
html
<!DOCTYPE html>
<html lang="zh-CN">
<head>
<meta charset="UTF-8">
<meta name="viewport" content="width=device-width, initial-scale=1.0">
<title>ECharts 折线图入门</title>
<!-- 引入本地 ECharts -->
<script src="/static/js/echarts.min.js"></script>
<!-- 引入本地 jQuery,用于 AJAX 请求 -->
<script src="/static/js/jquery-4.0.0.min.js"></script>
<style>
body {
font-family: Arial, "Microsoft YaHei", sans-serif;
margin: 0;
padding: 20px;
background-color: #f5f5f5;
}
h1 {
text-align: center;
color: #333;
}
/* 返回链接样式 */
.back-link {
display: inline-block;
margin-bottom: 15px;
color: #1e88e5;
text-decoration: none;
}
.back-link:hover {
text-decoration: underline;
}
/* 图表容器,需要明确宽高 */
#main {
width: 100%;
height: 500px;
background-color: #fff;
border-radius: 8px;
box-shadow: 0 2px 8px rgba(0, 0, 0, 0.1);
}
</style>
</head>
<body>
<!-- 返回图表索引页 -->
<a href="/static/charts/index.html" class="back-link">← 返回图表案例索引</a>
<h1>ECharts 折线图入门</h1>
<!-- 图表渲染容器 -->
<div id="main"></div>
<script>
$(document).ready(function () {
// 初始化 ECharts 实例
var myChart = echarts.init(document.getElementById('main'));
// 显示加载动画,提升用户体验
myChart.showLoading();
// 使用 jQuery AJAX 获取折线图数据
$.ajax({
url: '/api/chart-data/line',
type: 'GET',
dataType: 'json',
success: function (response) {
// 隐藏加载动画
myChart.hideLoading();
// 构造 ECharts 配置项
var option = {
title: {
text: '月度销售额趋势',
left: 'center'
},
tooltip: {
trigger: 'axis'
},
legend: {
data: ['销售额'],
bottom: 0
},
grid: {
left: '3%',
right: '4%',
bottom: '10%',
containLabel: true
},
xAxis: {
type: 'category',
boundaryGap: false,
// 使用接口返回的 categories 作为 x 轴数据
data: response.categories
},
yAxis: {
type: 'value',
name: '销售额(万元)'
},
series: [{
name: '销售额',
type: 'line',
// 使用接口返回的 values 作为 series 数据
data: response.values,
smooth: true,
areaStyle: {
opacity: 0.2
}
}]
};
// 渲染图表
myChart.setOption(option);
},
error: function (xhr, status, error) {
myChart.hideLoading();
console.error('获取折线图数据失败:', status, error);
document.getElementById('main').innerHTML =
'<p style="text-align:center; padding-top: 200px; color: #c00;">数据加载失败,请检查接口是否正常。</p>';
}
});
// 窗口大小变化时重绘图表
$(window).resize(function () {
myChart.resize();
});
});
</script>
</body>
</html>折线图页面运行效果如下:
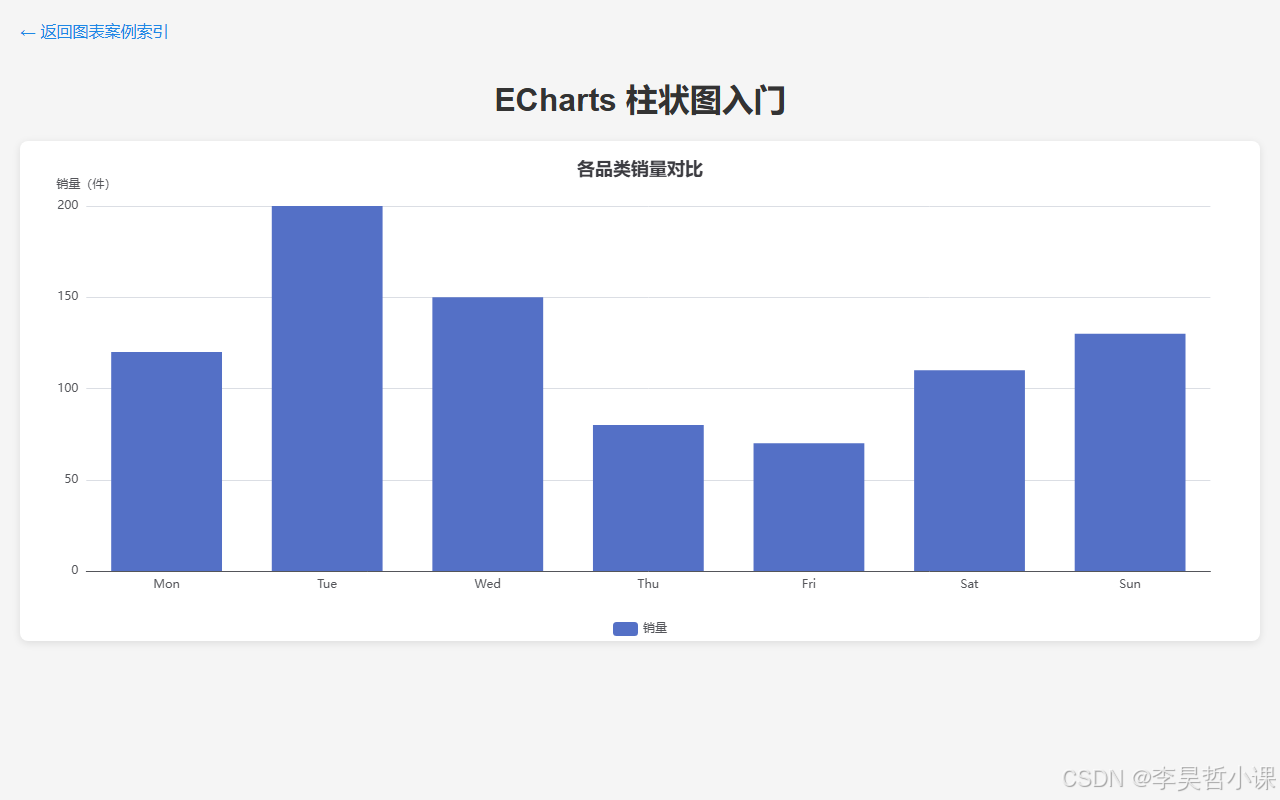
柱状图 static/charts/bar.html
- 访问 URL :
http://127.0.0.1:8000/static/charts/bar.html - 数据接口 :
/api/chart-data/bar - 特点简述:柱状图使用矩形柱子的高度表示数值大小,适合对比不同类别之间的数据差异。本案例展示了周一至周日各天的销售额对比。
完整代码如下:
html
<!DOCTYPE html>
<html lang="zh-CN">
<head>
<meta charset="UTF-8">
<meta name="viewport" content="width=device-width, initial-scale=1.0">
<title>ECharts 柱状图入门</title>
<!-- 引入本地 ECharts -->
<script src="/static/js/echarts.min.js"></script>
<!-- 引入本地 jQuery,用于 AJAX 请求 -->
<script src="/static/js/jquery-4.0.0.min.js"></script>
<style>
body {
font-family: Arial, "Microsoft YaHei", sans-serif;
margin: 0;
padding: 20px;
background-color: #f5f5f5;
}
h1 {
text-align: center;
color: #333;
}
/* 返回链接样式 */
.back-link {
display: inline-block;
margin-bottom: 15px;
color: #1e88e5;
text-decoration: none;
}
.back-link:hover {
text-decoration: underline;
}
/* 图表容器,需要明确宽高 */
#main {
width: 100%;
height: 500px;
background-color: #fff;
border-radius: 8px;
box-shadow: 0 2px 8px rgba(0, 0, 0, 0.1);
}
</style>
</head>
<body>
<!-- 返回图表索引页 -->
<a href="/static/charts/index.html" class="back-link">← 返回图表案例索引</a>
<h1>ECharts 柱状图入门</h1>
<!-- 图表渲染容器 -->
<div id="main"></div>
<script>
$(document).ready(function () {
// 初始化 ECharts 实例
var myChart = echarts.init(document.getElementById('main'));
// 显示加载动画
myChart.showLoading();
// 使用 jQuery AJAX 获取柱状图数据
$.ajax({
url: '/api/chart-data/bar',
type: 'GET',
dataType: 'json',
success: function (response) {
// 隐藏加载动画
myChart.hideLoading();
// 构造 ECharts 配置项
var option = {
title: {
text: '各品类销量对比',
left: 'center'
},
tooltip: {
trigger: 'axis',
axisPointer: {
type: 'shadow'
}
},
legend: {
data: ['销量'],
bottom: 0
},
grid: {
left: '3%',
right: '4%',
bottom: '10%',
containLabel: true
},
xAxis: {
type: 'category',
// 使用接口返回的 categories 作为 x 轴数据
data: response.categories
},
yAxis: {
type: 'value',
name: '销量(件)'
},
series: [{
name: '销量',
type: 'bar',
// 使用接口返回的 values 作为 series 数据
data: response.values,
itemStyle: {
color: '#5470c6'
}
}]
};
// 渲染图表
myChart.setOption(option);
},
error: function (xhr, status, error) {
myChart.hideLoading();
console.error('获取柱状图数据失败:', status, error);
document.getElementById('main').innerHTML =
'<p style="text-align:center; padding-top: 200px; color: #c00;">数据加载失败,请检查接口是否正常。</p>';
}
});
// 窗口大小变化时重绘图表
$(window).resize(function () {
myChart.resize();
});
});
</script>
</body>
</html>柱状图页面运行效果如下:
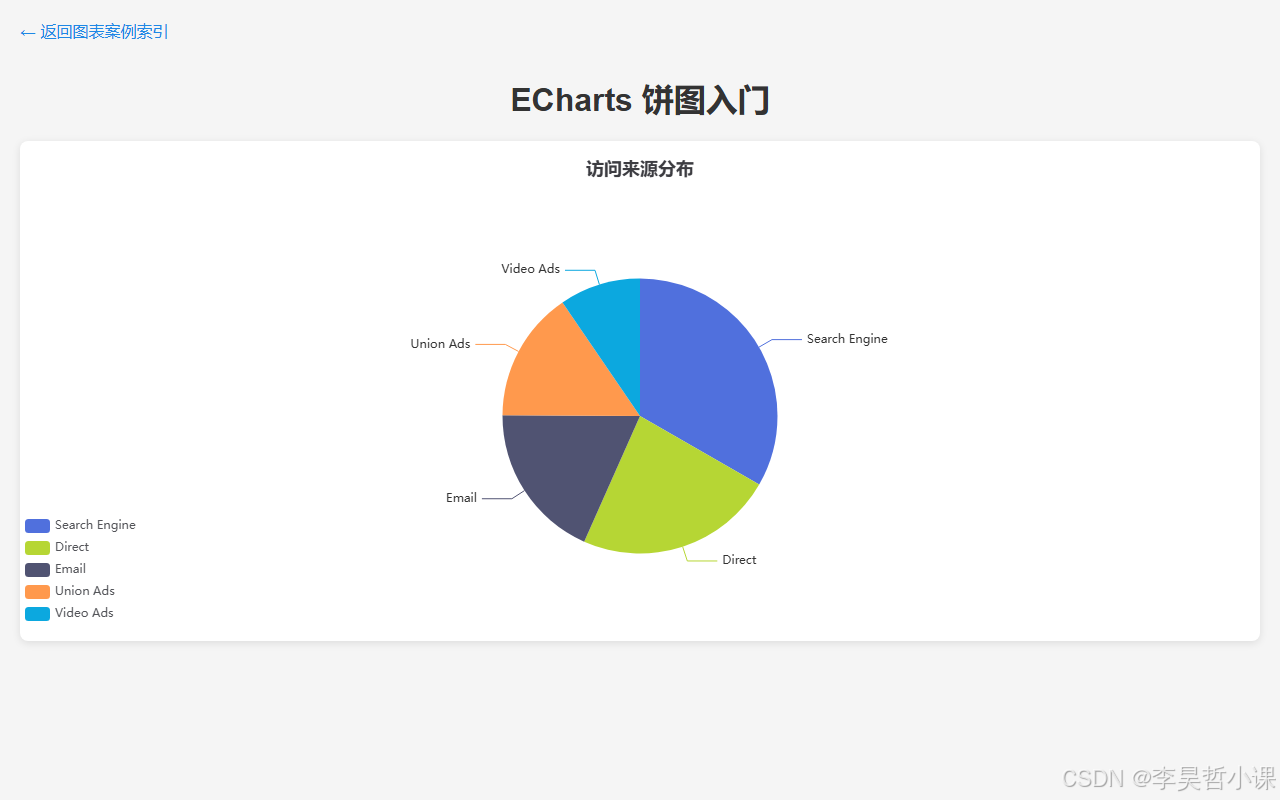
饼图 static/charts/pie.html
- 访问 URL :
http://127.0.0.1:8000/static/charts/pie.html - 数据接口 :
/api/chart-data/pie - 特点简述:饼图将整体划分为多个扇形区域,各区域面积表示该类别占总体的比例,适合展示构成关系。本案例展示了不同营销渠道带来的流量占比。
完整代码如下:
html
<!DOCTYPE html>
<html lang="zh-CN">
<head>
<meta charset="UTF-8">
<meta name="viewport" content="width=device-width, initial-scale=1.0">
<title>ECharts 饼图入门</title>
<!-- 引入本地 ECharts -->
<script src="/static/js/echarts.min.js"></script>
<!-- 引入本地 jQuery,用于 AJAX 请求 -->
<script src="/static/js/jquery-4.0.0.min.js"></script>
<style>
body {
font-family: Arial, "Microsoft YaHei", sans-serif;
margin: 0;
padding: 20px;
background-color: #f5f5f5;
}
h1 {
text-align: center;
color: #333;
}
/* 返回链接样式 */
.back-link {
display: inline-block;
margin-bottom: 15px;
color: #1e88e5;
text-decoration: none;
}
.back-link:hover {
text-decoration: underline;
}
/* 图表容器,需要明确宽高 */
#main {
width: 100%;
height: 500px;
background-color: #fff;
border-radius: 8px;
box-shadow: 0 2px 8px rgba(0, 0, 0, 0.1);
}
</style>
</head>
<body>
<!-- 返回图表索引页 -->
<a href="/static/charts/index.html" class="back-link">← 返回图表案例索引</a>
<h1>ECharts 饼图入门</h1>
<!-- 图表渲染容器 -->
<div id="main"></div>
<script>
$(document).ready(function () {
// 初始化 ECharts 实例
var myChart = echarts.init(document.getElementById('main'));
// 显示加载动画
myChart.showLoading();
// 使用 jQuery AJAX 获取饼图数据
$.ajax({
url: '/api/chart-data/pie',
type: 'GET',
dataType: 'json',
success: function (response) {
// 隐藏加载动画
myChart.hideLoading();
// 构造 ECharts 配置项
var option = {
title: {
text: '访问来源分布',
left: 'center'
},
tooltip: {
trigger: 'item',
formatter: '{a} <br/>{b}: {c} ({d}%)'
},
legend: {
orient: 'vertical',
left: 'left'
},
series: [{
name: '访问来源',
type: 'pie',
radius: '55%',
center: ['50%', '55%'],
// 使用接口返回的 data 数组作为 series 数据
data: response.data,
emphasis: {
itemStyle: {
shadowBlur: 10,
shadowOffsetX: 0,
shadowColor: 'rgba(0, 0, 0, 0.5)'
}
}
}]
};
// 渲染图表
myChart.setOption(option);
},
error: function (xhr, status, error) {
myChart.hideLoading();
console.error('获取饼图数据失败:', status, error);
document.getElementById('main').innerHTML =
'<p style="text-align:center; padding-top: 200px; color: #c00;">数据加载失败,请检查接口是否正常。</p>';
}
});
// 窗口大小变化时重绘图表
$(window).resize(function () {
myChart.resize();
});
});
</script>
</body>
</html>饼图页面运行效果如下:
散点图 static/charts/scatter.html
- 访问 URL :
http://127.0.0.1:8000/static/charts/scatter.html - 数据接口 :
/api/chart-data/scatter - 特点简述:散点图使用二维坐标系中的点表示两个变量的取值,适合观察变量之间的分布和相关性。本案例展示了一组样本数据的分布情况。
完整代码如下:
html
<!DOCTYPE html>
<html lang="zh-CN">
<head>
<meta charset="UTF-8">
<meta name="viewport" content="width=device-width, initial-scale=1.0">
<title>ECharts 散点图入门</title>
<!-- 引入本地 ECharts -->
<script src="/static/js/echarts.min.js"></script>
<!-- 引入本地 jQuery,用于 AJAX 请求 -->
<script src="/static/js/jquery-4.0.0.min.js"></script>
<style>
body {
font-family: Arial, "Microsoft YaHei", sans-serif;
margin: 0;
padding: 20px;
background-color: #f5f5f5;
}
h1 {
text-align: center;
color: #333;
}
/* 返回链接样式 */
.back-link {
display: inline-block;
margin-bottom: 15px;
color: #1e88e5;
text-decoration: none;
}
.back-link:hover {
text-decoration: underline;
}
/* 图表容器,需要明确宽高 */
#main {
width: 100%;
height: 500px;
background-color: #fff;
border-radius: 8px;
box-shadow: 0 2px 8px rgba(0, 0, 0, 0.1);
}
</style>
</head>
<body>
<!-- 返回图表索引页 -->
<a href="/static/charts/index.html" class="back-link">← 返回图表案例索引</a>
<h1>ECharts 散点图入门</h1>
<!-- 图表渲染容器 -->
<div id="main"></div>
<script>
$(document).ready(function () {
// 初始化 ECharts 实例
var myChart = echarts.init(document.getElementById('main'));
// 显示加载动画
myChart.showLoading();
// 使用 jQuery AJAX 获取散点图数据
$.ajax({
url: '/api/chart-data/scatter',
type: 'GET',
dataType: 'json',
success: function (response) {
// 隐藏加载动画
myChart.hideLoading();
// 构造 ECharts 配置项
var option = {
title: {
text: '身高体重分布',
left: 'center'
},
tooltip: {
trigger: 'item',
formatter: function (params) {
return '身高:' + params.data[0] + 'cm<br/>体重:' + params.data[1] + 'kg';
}
},
legend: {
data: ['人群分布'],
bottom: 0
},
grid: {
left: '7%',
right: '7%',
bottom: '10%',
top: '15%'
},
xAxis: {
type: 'value',
name: '身高(cm)',
scale: true
},
yAxis: {
type: 'value',
name: '体重(kg)',
scale: true
},
series: [{
name: '人群分布',
type: 'scatter',
symbolSize: 16,
// 使用接口返回的 data 二维数组作为 series 数据
data: response.data,
itemStyle: {
color: '#91cc75'
}
}]
};
// 渲染图表
myChart.setOption(option);
},
error: function (xhr, status, error) {
myChart.hideLoading();
console.error('获取散点图数据失败:', status, error);
document.getElementById('main').innerHTML =
'<p style="text-align:center; padding-top: 200px; color: #c00;">数据加载失败,请检查接口是否正常。</p>';
}
});
// 窗口大小变化时重绘图表
$(window).resize(function () {
myChart.resize();
});
});
</script>
</body>
</html>散点图页面运行效果如下:
运行效果
启动服务后,打开浏览器访问以下地址,即可看到对应的页面效果:
首页 http://127.0.0.1:8000/ 的效果:
图表索引页 http://127.0.0.1:8000/static/charts/index.html 的效果:
折线图页面 http://127.0.0.1:8000/static/charts/line.html 的效果:
柱状图页面 http://127.0.0.1:8000/static/charts/bar.html 的效果:
饼图页面 http://127.0.0.1:8000/static/charts/pie.html 的效果:
散点图页面 http://127.0.0.1:8000/static/charts/scatter.html 的效果: