大家好,我是Java1234_小锋老师,分享一套锋哥原创的基于Spark实时金融交易风险监控与预测系统(Java版本+可视化大屏+Kafka+SpringBoot+Vue3)
项目介绍
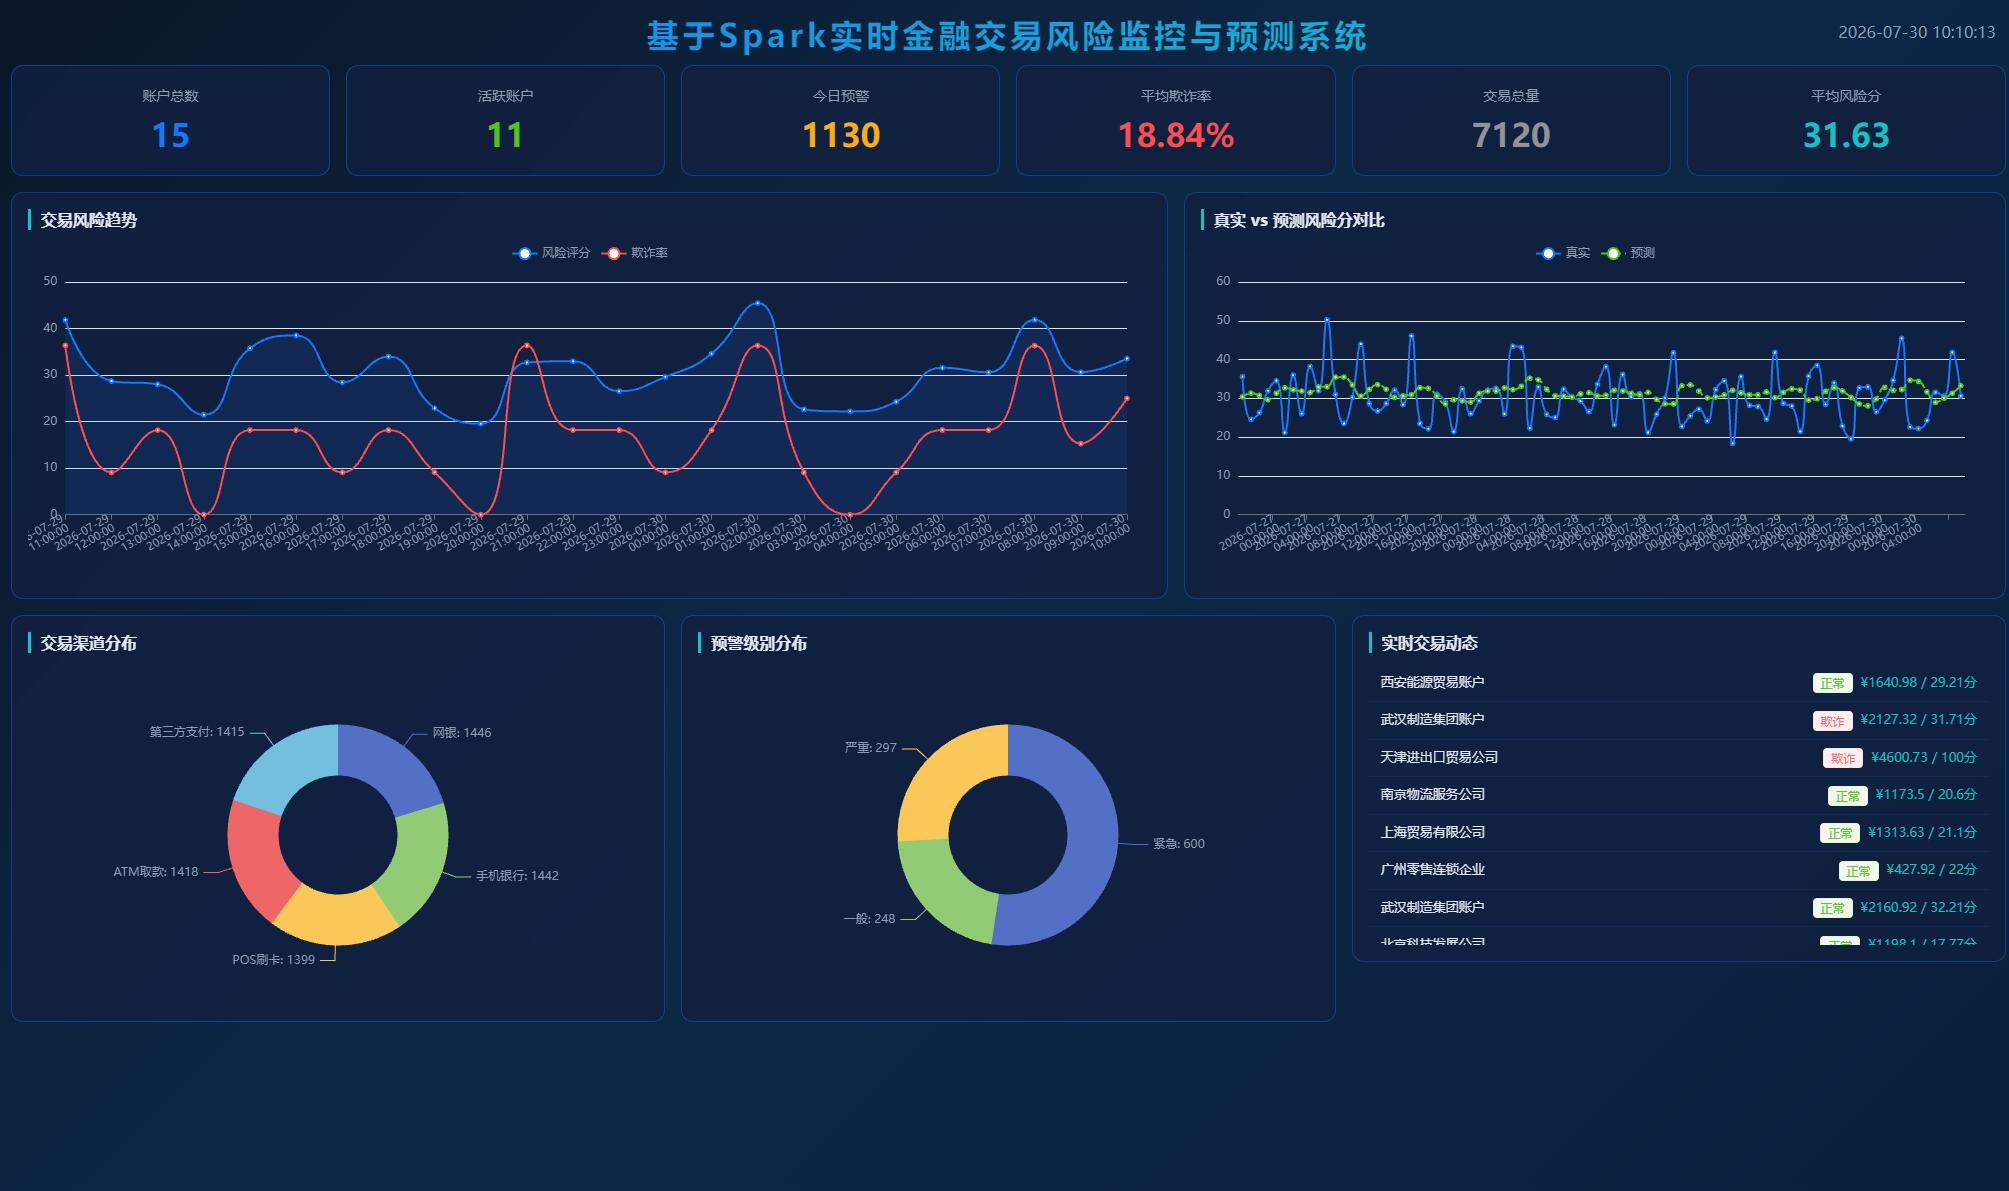
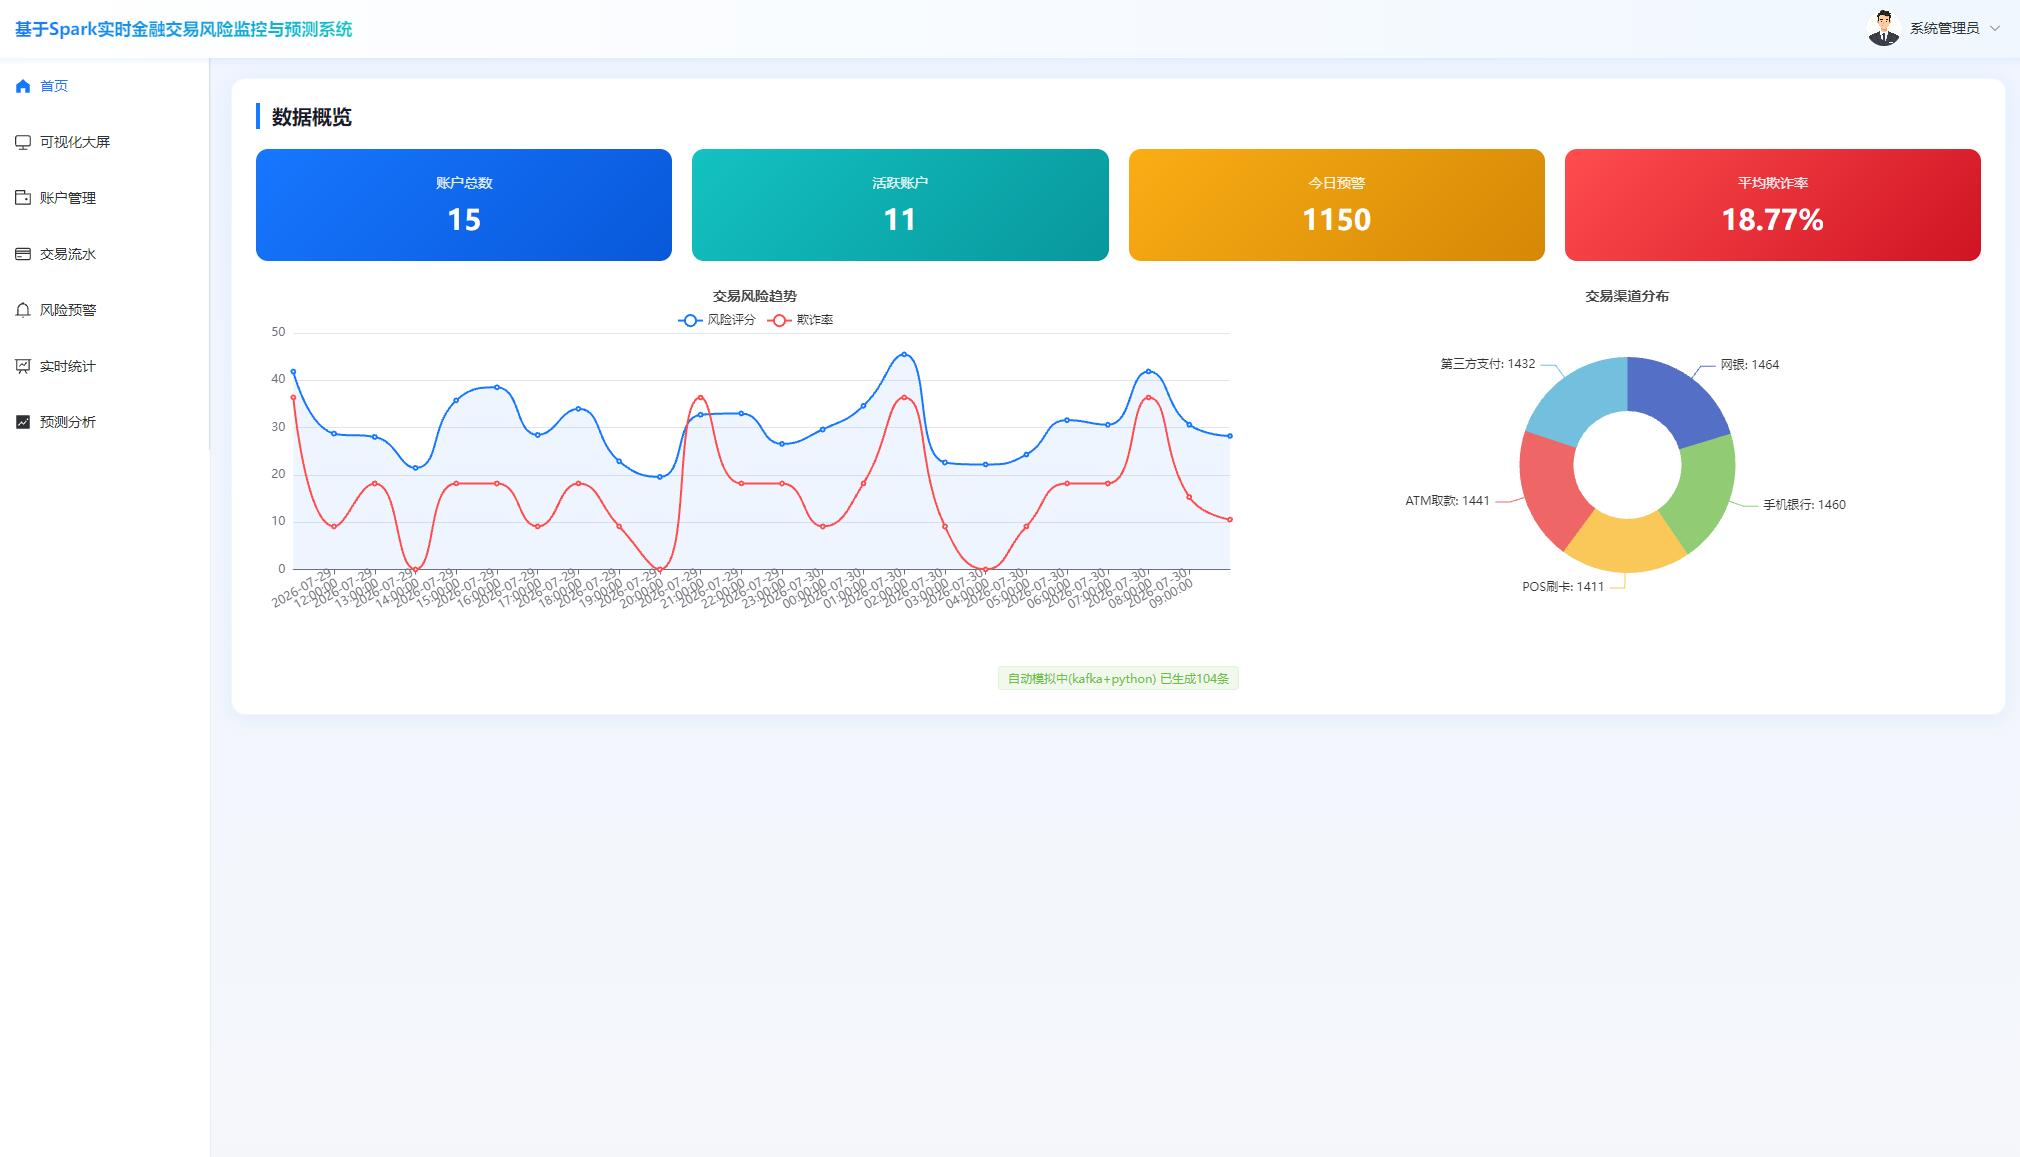
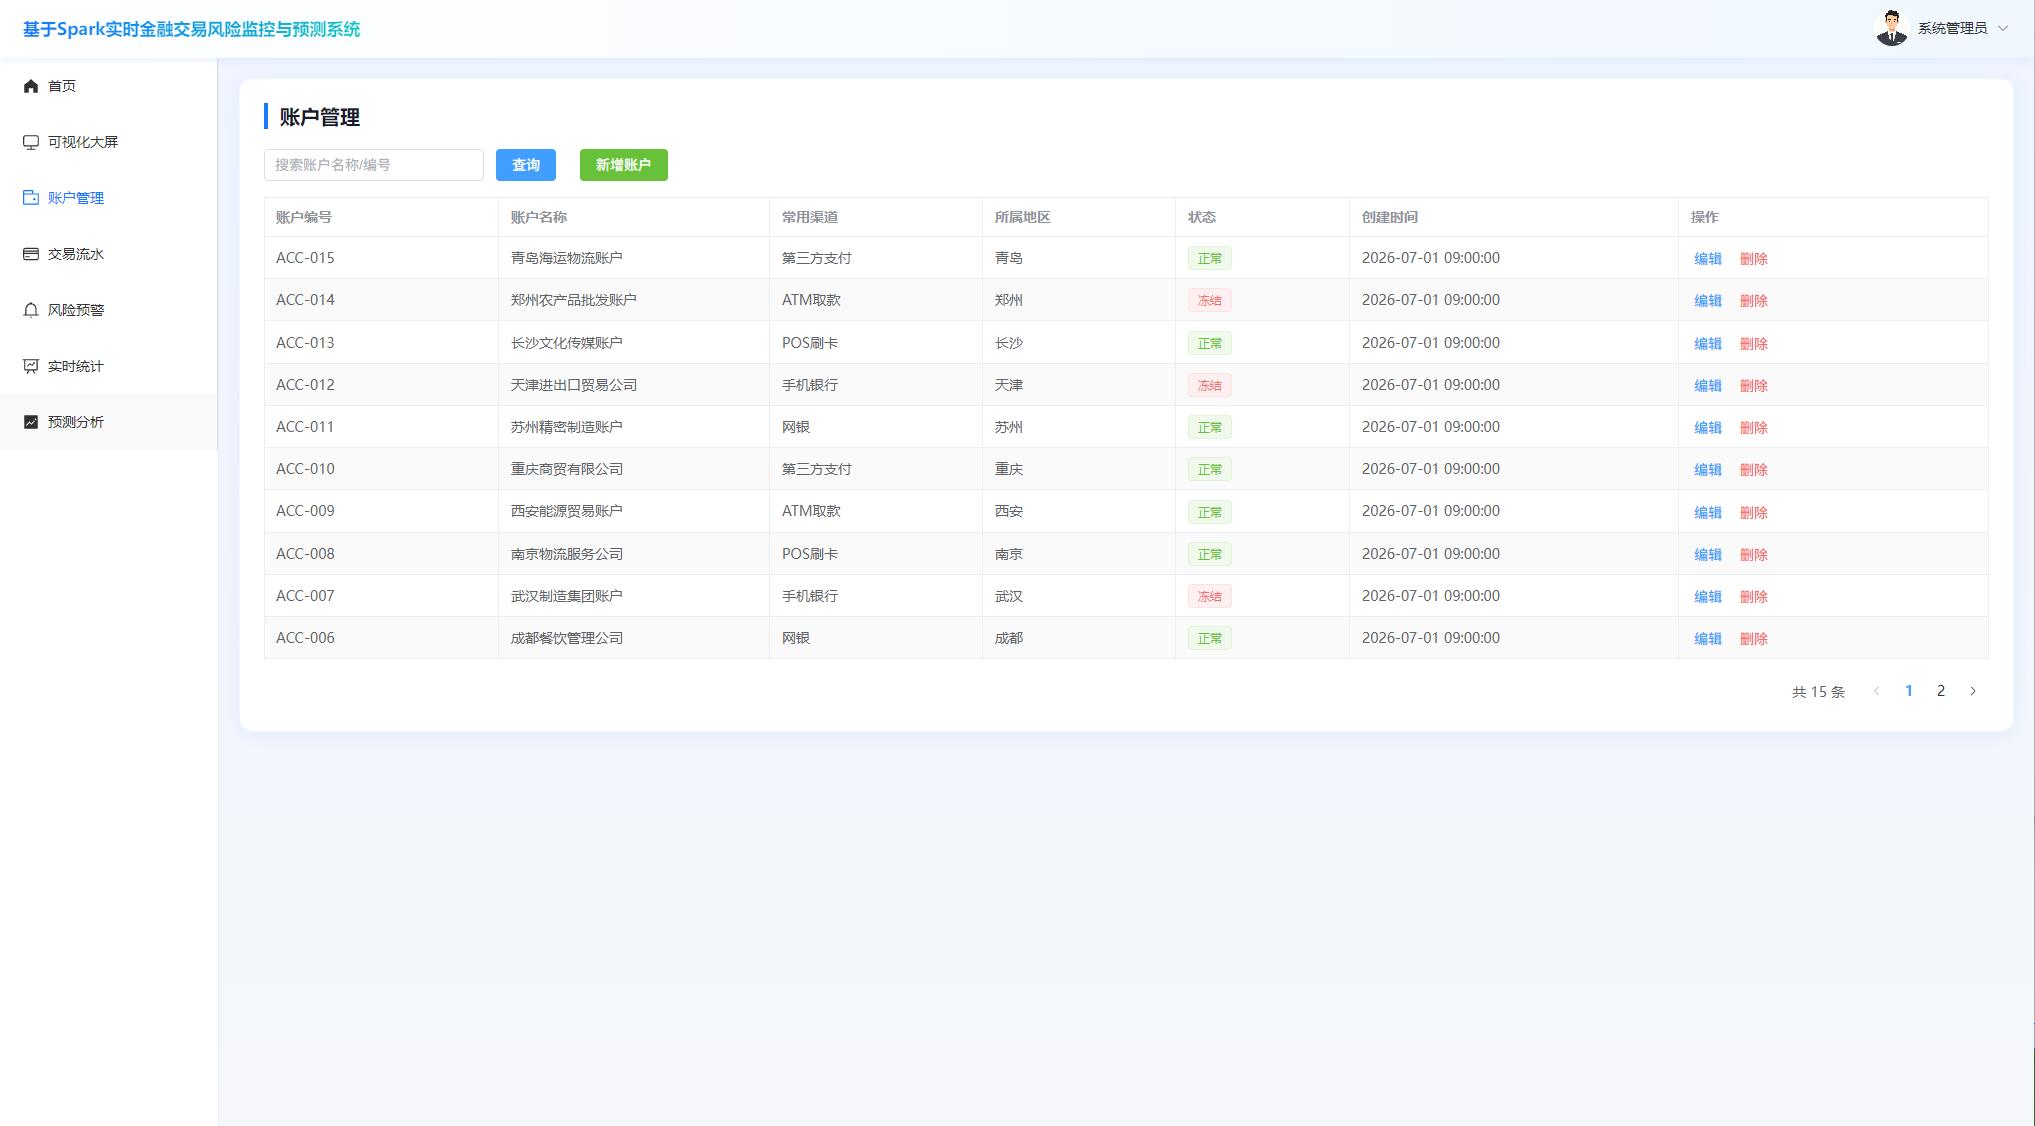
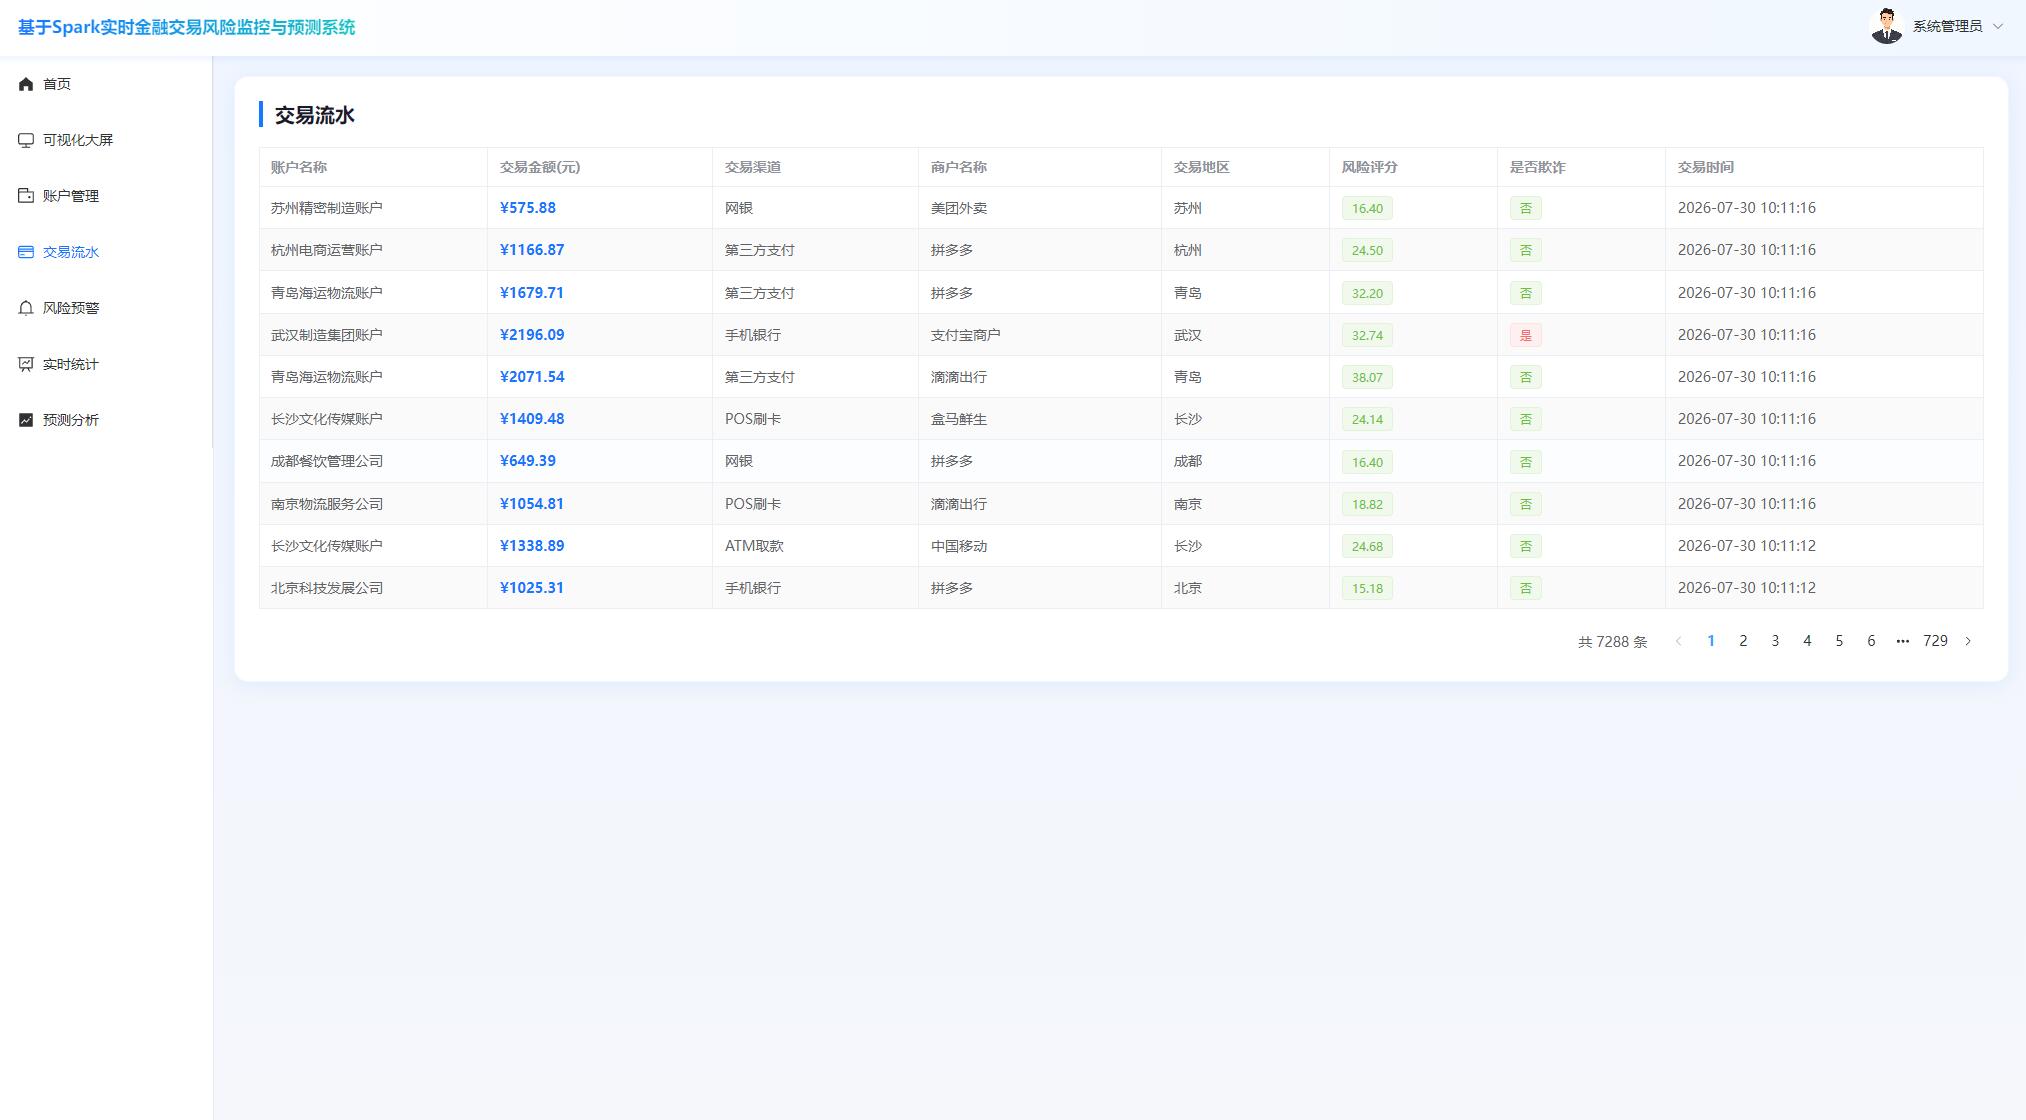
随着互联网金融与移动支付业务的快速发展,银行及第三方支付机构每天需要处理海量交易数据。交易规模扩大的同时,欺诈交易、异常转账、夜间大额消费等高风险行为也日益增多,传统依赖人工规则与离线批处理的风险识别方式难以满足实时性与准确性要求。因此,构建一套能够对金融交易进行实时监控、风险评分与趋势预测的系统,具有重要的工程实践价值与现实意义。本文设计并实现了基于Spark实时金融交易风险监控与预测系统。系统采用前后端分离架构:前端使用Vue3、Vite、Element Plus与ECharts构建管理端与可视化大屏;后端基于Java与Spring Boot提供RESTful接口,结合Spring Security与JWT完成身份认证与权限控制;数据层采用MySQL存储业务数据,并通过MyBatis-Plus完成对象关系映射。在实时处理链路中,系统引入Kafka作为交易事件消息中间件,采用Spark流式计算思想对交易流进行窗口聚合与风险分析;同时实现风险评分算法、预警生成机制以及基于多元线性回归的风险趋势预测,并输出RMSE、MAE、MAPE等误差指标。系统功能覆盖管理员登录、个人中心、账户管理、交易流水查询、风险预警处理、实时统计展示、预测分析对比以及首页与大屏数据可视化。测试结果表明,系统能够持续接入交易事件并完成风险识别与展示,界面交互流畅,核心业务流程闭环完整,达到本科毕业设计的预期目标。
源码下载
链接: https://pan.baidu.com/s/196WJ1ZjC8w5JbD1XD5ekMw?pwd=1234
提取码: 1234
系统展示
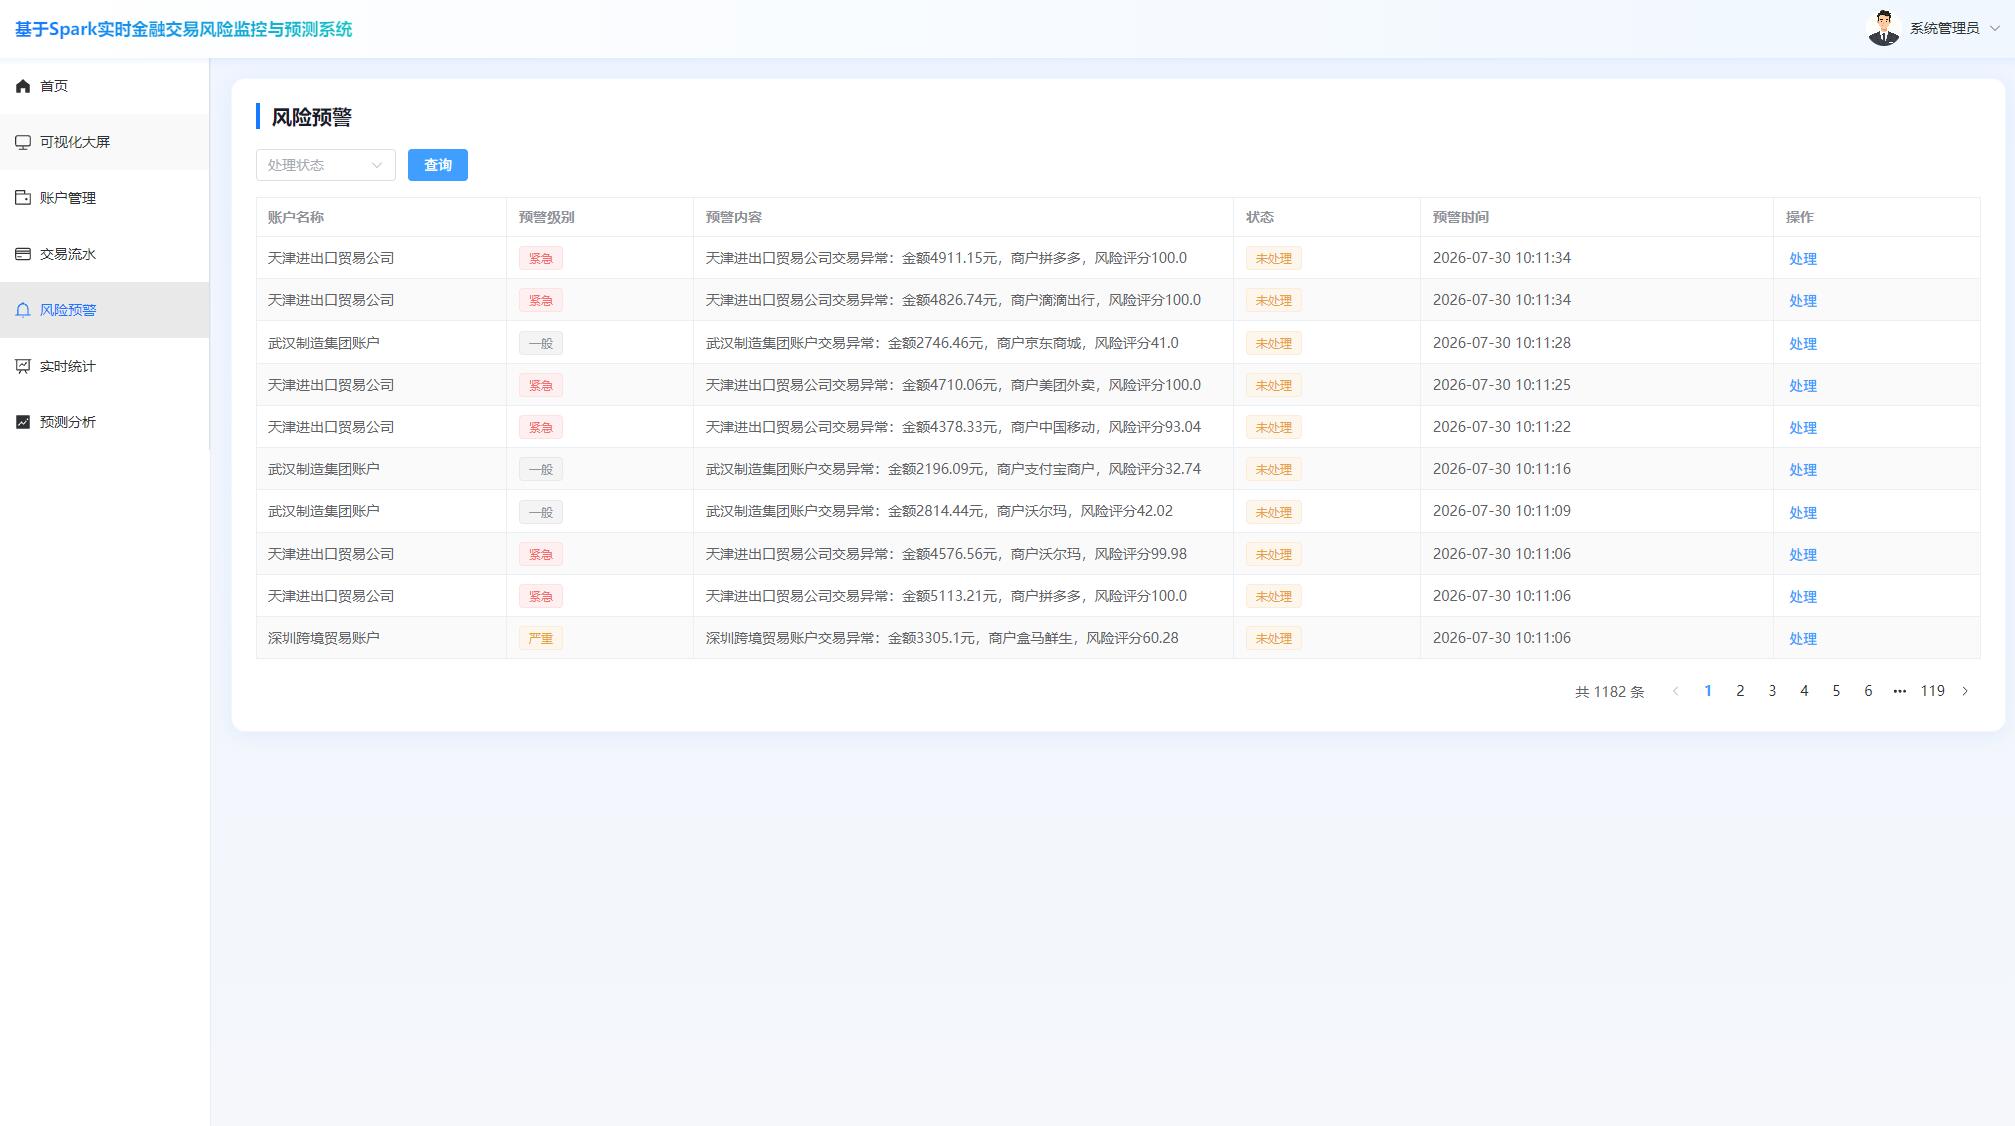
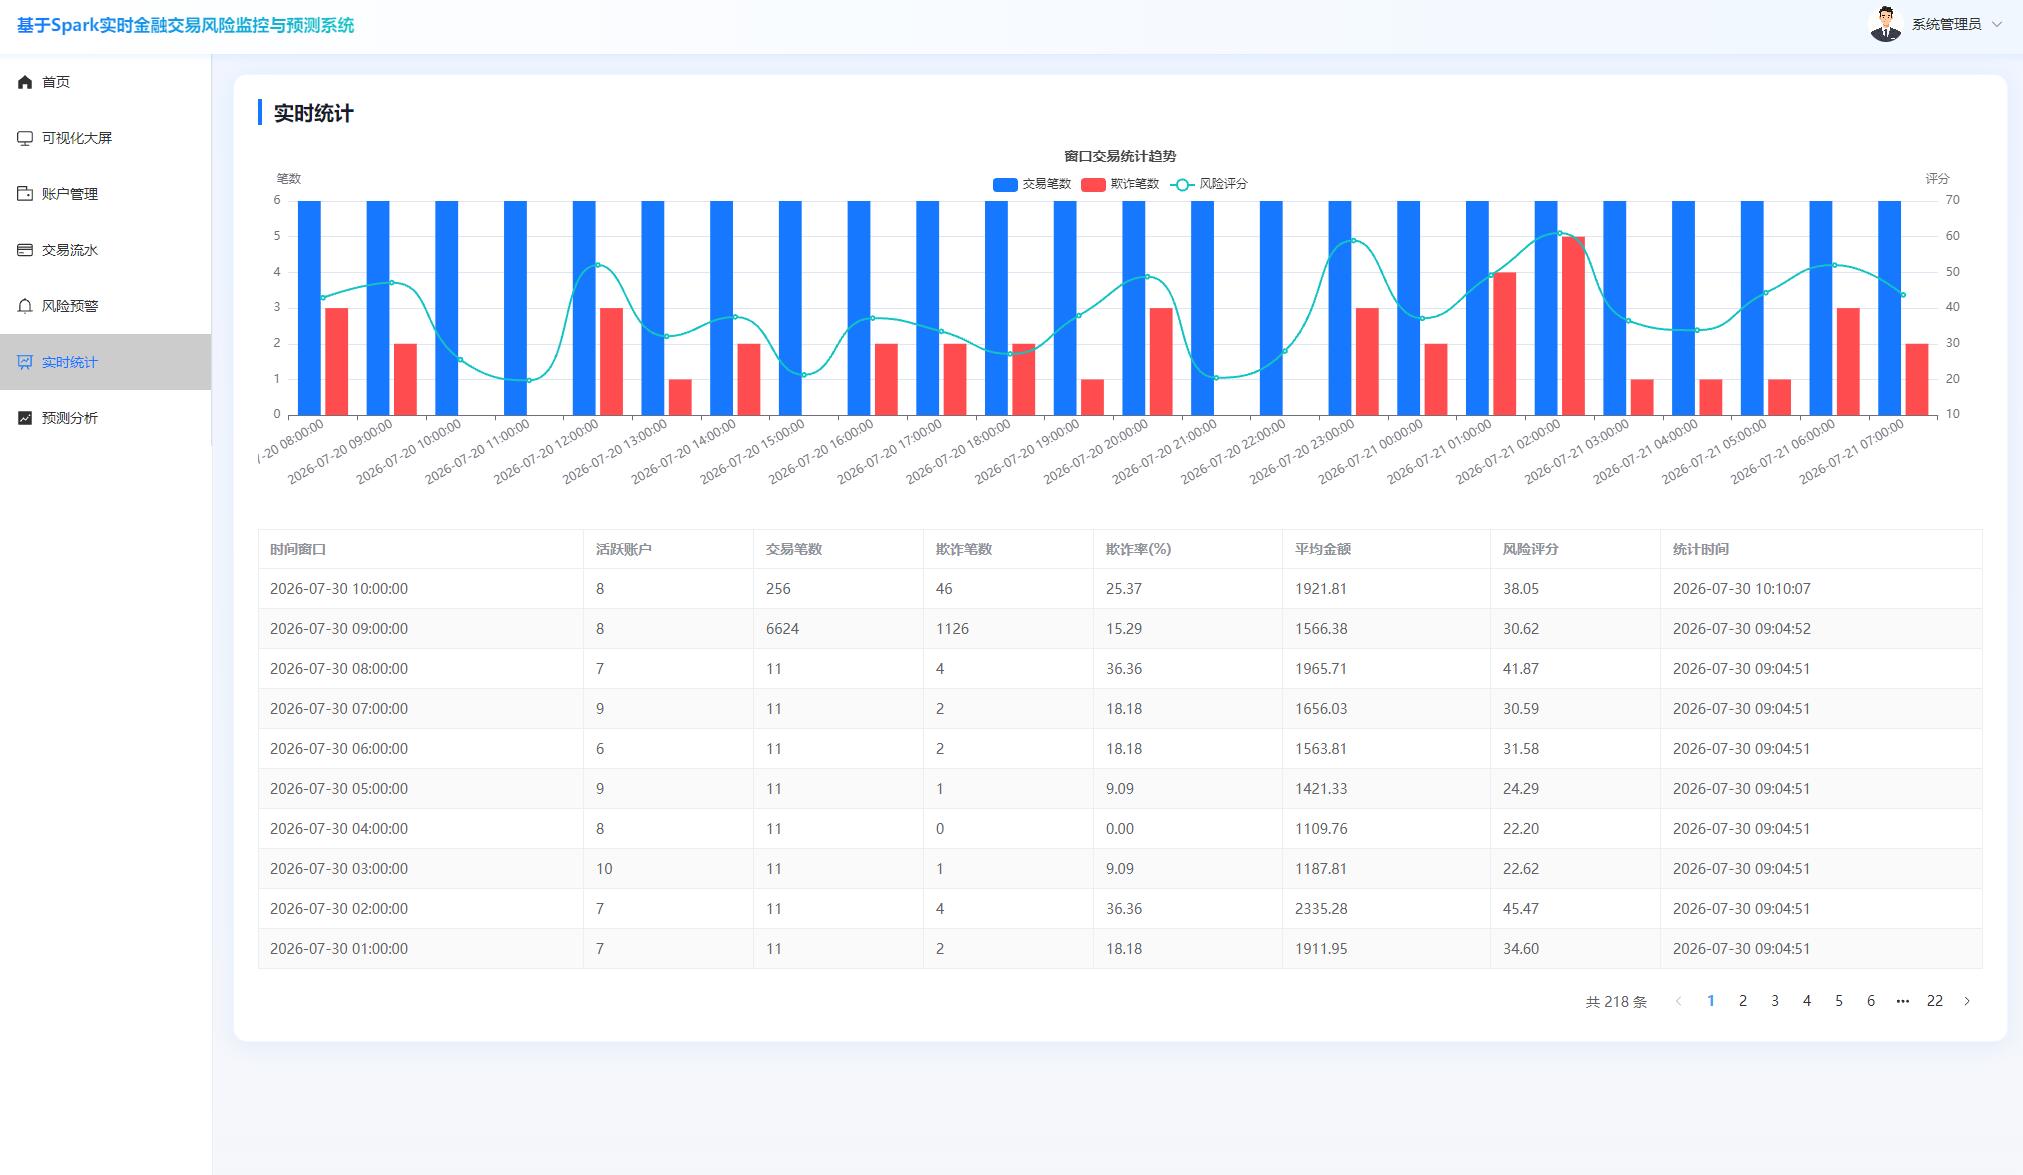
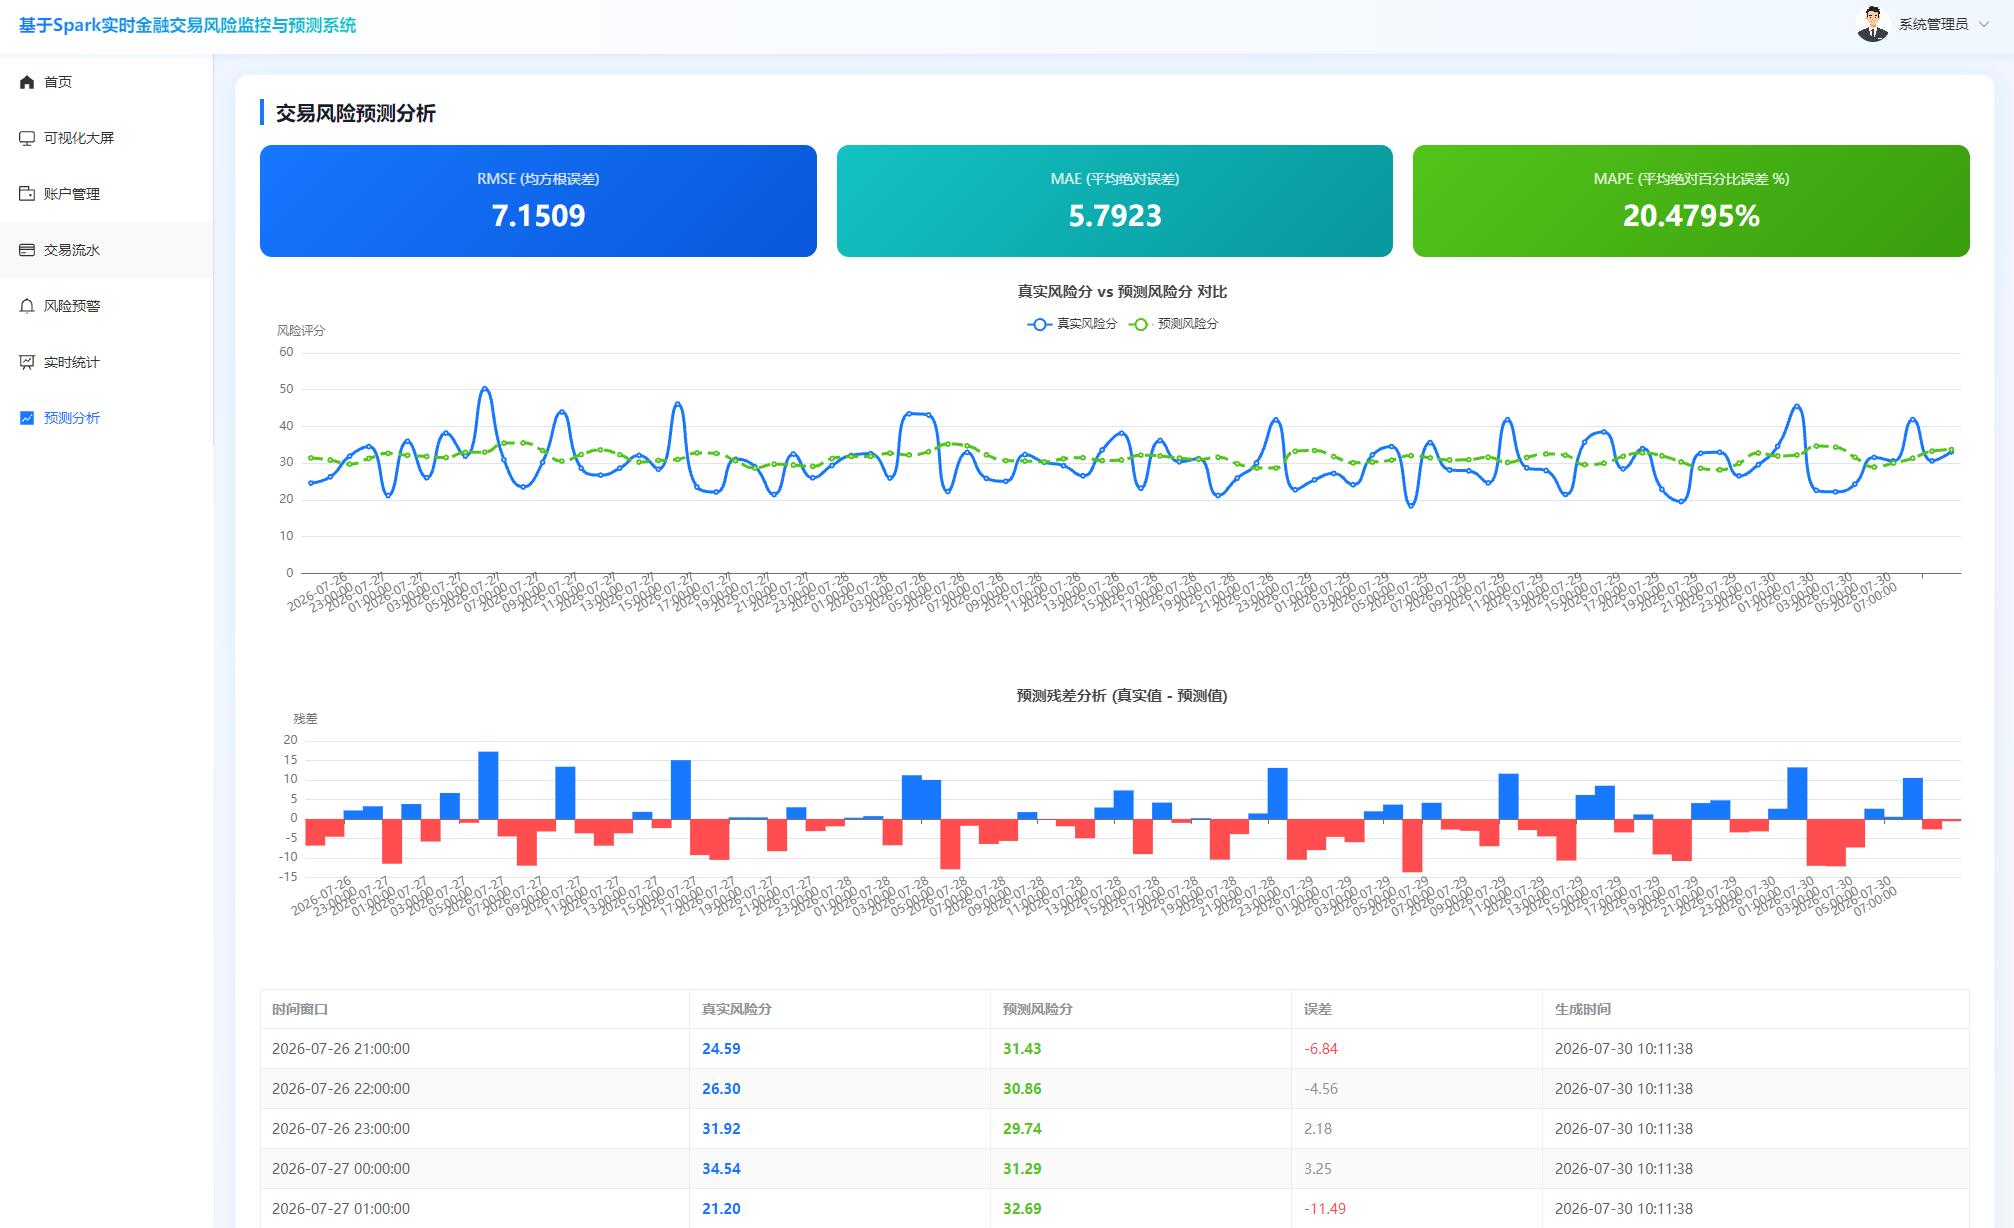


核心代码
java
package com.java1234.controller;

import com.java1234.common.Result;
import com.java1234.service.QueryService;
import org.springframework.web.bind.annotation.GetMapping;
import org.springframework.web.bind.annotation.RequestMapping;
import org.springframework.web.bind.annotation.RequestParam;
import org.springframework.web.bind.annotation.RestController;

/**
 * 预测分析控制器
 */
@RestController
@RequestMapping("/api/prediction")
public class PredictionController {

    private final QueryService queryService;

    public PredictionController(QueryService queryService) {
        this.queryService = queryService;
    }

    @GetMapping("/list")
    public Result<?> list(@RequestParam(defaultValue = "1") int page,
                          @RequestParam(defaultValue = "10") int size) {
        return Result.ok(queryService.listPredictions(page, size));
    }

    @GetMapping("/compare")
    public Result<?> compare() {
        return Result.ok(queryService.getPredictionCompare());
    }

    @GetMapping("/error")
    public Result<?> error() {
        return Result.ok(queryService.getLatestErrorMetric());
    }
}
html
<template>
  <div class="page-container">
    <div class="page-card">
      <div class="page-title">交易风险预测分析</div>
      <div class="error-cards">
        <div class="error-card"><div class="metric-label">RMSE (均方根误差)</div><div class="metric-value">{{ errorMetric.rmse }}</div></div>
        <div class="error-card"><div class="metric-label">MAE (平均绝对误差)</div><div class="metric-value">{{ errorMetric.mae }}</div></div>
        <div class="error-card"><div class="metric-label">MAPE (平均绝对百分比误差 %)</div><div class="metric-value">{{ errorMetric.mape }}%</div></div>
      </div>
      <div ref="compareRef" class="pred-chart"></div>
      <div ref="residualRef" class="pred-chart pred-residual"></div>
      <el-table :data="tableData" stripe border>
        <el-table-column prop="window_time" label="时间窗口" min-width="170">
          <template #default="{ row }">{{ formatWindowTime(row.window_time) }}</template>
        </el-table-column>
        <el-table-column prop="true_score" label="真实风险分" min-width="120">
          <template #default="{ row }"><span style="color:#1677ff;font-weight:600">{{ row.true_score }}</span></template>
        </el-table-column>
        <el-table-column prop="pred_score" label="预测风险分" min-width="120">
          <template #default="{ row }"><span style="color:#52c41a;font-weight:600">{{ row.pred_score }}</span></template>
        </el-table-column>
        <el-table-column label="误差" min-width="100">
          <template #default="{ row }">
            <span :style="{ color: Math.abs(row.true_score - row.pred_score) > 5 ? '#ff4d4f' : '#909399' }">
              {{ (row.true_score - row.pred_score).toFixed(2) }}
            </span>
          </template>
        </el-table-column>
        <el-table-column prop="create_time" label="生成时间" min-width="170">
          <template #default="{ row }">{{ formatDateTime(row.create_time) }}</template>
        </el-table-column>
      </el-table>
      <el-pagination style="margin-top:16px;justify-content:flex-end" v-model:current-page="page" v-model:page-size="size" :total="total" layout="total, prev, pager, next" @change="loadTable" />
    </div>
  </div>
</template>

<script setup>
/**
 * 预测分析页面:真实 vs 预测对比 + 误差分析
 */
import { ref, onMounted, onUnmounted } from 'vue'
import * as echarts from 'echarts'
import request from '@/utils/request'
import { formatDateTime, formatWindowTime } from '@/utils/format'

const errorMetric = ref({ rmse: 0, mae: 0, mape: 0 })
const tableData = ref([])
const page = ref(1)
const size = ref(10)
const total = ref(0)
const compareRef = ref(null)
const residualRef = ref(null)
let charts = []
let pollTimer = null

function axisLabel() {
  return { rotate: 30, interval: 'auto', formatter(val) { const t = formatWindowTime(val); return t.length >= 16 ? `${t.slice(0,10)}\n${t.slice(11)}` : t } }
}

function initCompareChart(data) {
  if (!compareRef.value) return
  const chart = echarts.init(compareRef.value)
  const labels = data.map(d => formatWindowTime(d.window_time))
  chart.setOption({
    title: { text: '真实风险分 vs 预测风险分 对比', left: 'center', textStyle: { fontSize: 15 } },
    tooltip: { trigger: 'axis' },
    legend: { data: ['真实风险分', '预测风险分'], top: 32 },
    grid: { left: 20, right: 24, bottom: 28, top: 72, containLabel: true },
    xAxis: { type: 'category', data: labels, axisLabel: axisLabel() },
    yAxis: { type: 'value', name: '风险评分' },
    series: [
      { name: '真实风险分', type: 'line', smooth: true, data: data.map(d => Number(d.true_score)), itemStyle: { color: '#1677ff' }, lineStyle: { width: 3 } },
      { name: '预测风险分', type: 'line', smooth: true, data: data.map(d => Number(d.pred_score)), itemStyle: { color: '#52c41a' }, lineStyle: { width: 3, type: 'dashed' } },
    ],
  })
  charts.push(chart)
}

function initResidualChart(data) {
  if (!residualRef.value) return
  const chart = echarts.init(residualRef.value)
  const labels = data.map(d => formatWindowTime(d.window_time))
  const residuals = data.map(d => Number((Number(d.true_score) - Number(d.pred_score)).toFixed(2)))
  chart.setOption({
    title: { text: '预测残差分析 (真实值 - 预测值)', left: 'center', textStyle: { fontSize: 15 } },
    tooltip: { trigger: 'axis' },
    grid: { left: 20, right: 24, bottom: 28, top: 56, containLabel: true },
    xAxis: { type: 'category', data: labels, axisLabel: axisLabel() },
    yAxis: { type: 'value', name: '残差' },
    series: [{ type: 'bar', data: residuals.map(v => ({ value: v, itemStyle: { color: v >= 0 ? '#1677ff' : '#ff4d4f' } })), barWidth: 20 }],
  })
  charts.push(chart)
}

async function loadData() {
  const [errorRes, compareRes] = await Promise.all([
    request.get('/prediction/error'),
    request.get('/prediction/compare'),
  ])
  errorMetric.value = errorRes.data || { rmse: 0, mae: 0, mape: 0 }
  const compareData = compareRes.data || []
  charts.forEach(c => c.dispose())
  charts = []
  initCompareChart(compareData)
  initResidualChart(compareData)
}

async function loadTable() {
  const res = await request.get('/prediction/list', { params: { page: page.value, size: size.value } })
  tableData.value = res.data.items
  total.value = res.data.total
}

onMounted(() => {
  loadData()
  loadTable()
  pollTimer = setInterval(loadData, 8000)
  window.addEventListener('resize', () => charts.forEach(c => c.resize()))
})

onUnmounted(() => {
  clearInterval(pollTimer)
  charts.forEach(c => c.dispose())
})
</script>