在完成项目后,需要跟踪项目里面的特定数据的使用情况以及服务器的运行情况进行监控,实时了解项目的运行情况,现在的监视数据图如下:
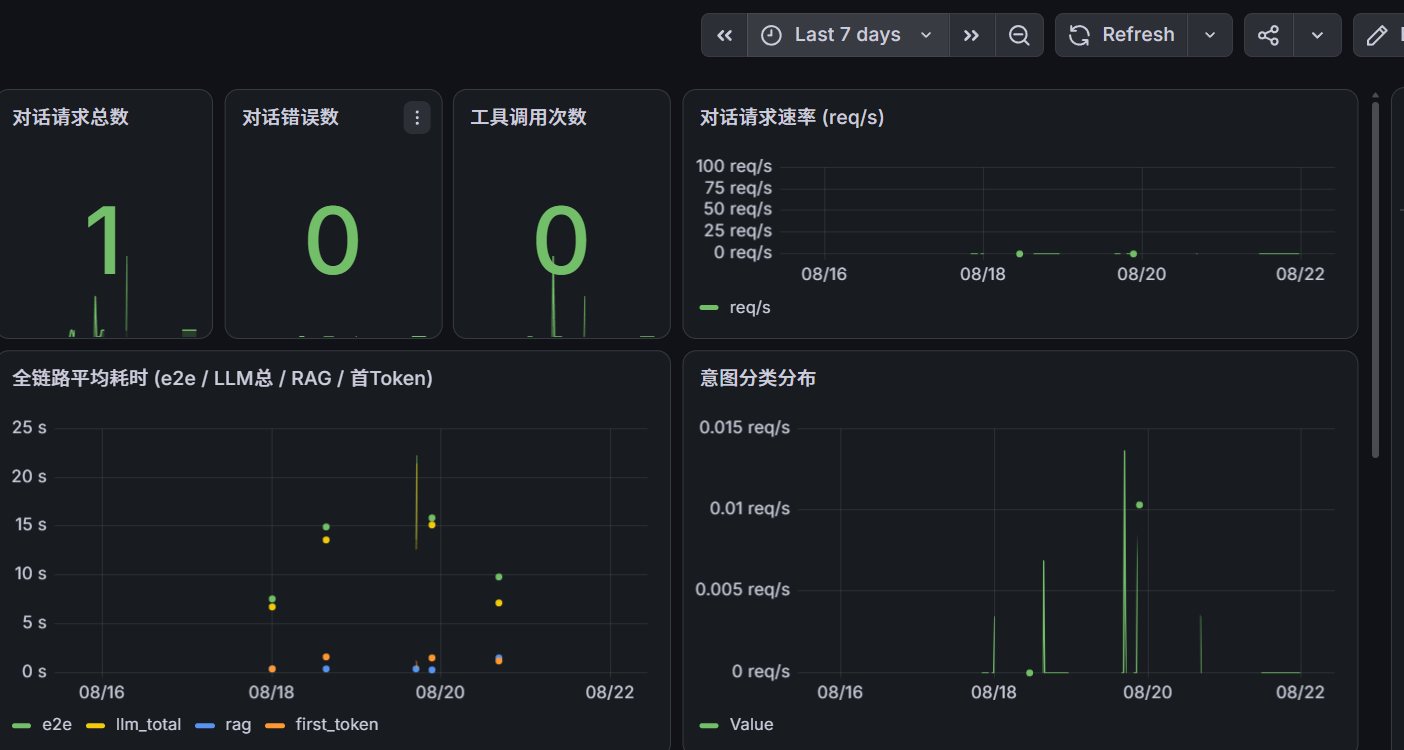
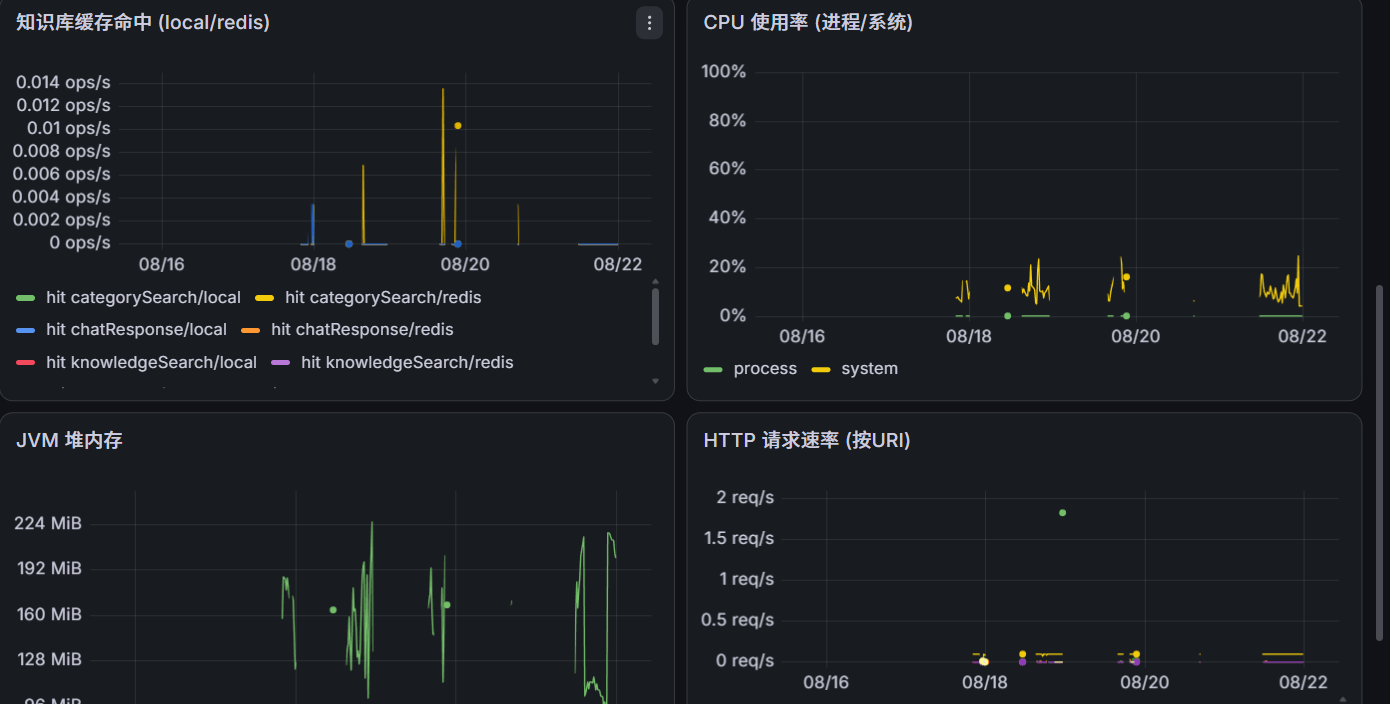
实现的监控json配置如下:
java
{
  "__inputs": [
    {
      "name": "DS_PROMETHEUS",
      "label": "Prometheus",
      "description": "",
      "type": "datasource",
      "pluginId": "prometheus",
      "pluginName": "Prometheus"
    }
  ],
  "id": null,
  "uid": "smartcs-overview",
  "title": "智能客服系统监控",
  "tags": ["smartcs"],
  "timezone": "browser",
  "schemaVersion": 39,
  "version": 0,
  "refresh": "15s",
  "time": { "from": "now-30m", "to": "now" },
  "panels": [
    {
      "id": 1,
      "type": "stat",
      "title": "对话请求总数",
      "datasource": { "type": "prometheus", "uid": "${DS_PROMETHEUS}" },
      "gridPos": { "h": 5, "w": 4, "x": 0, "y": 0 },
      "targets": [{ "expr": "sum(smartcs_chat_requests_total)", "refId": "A" }],
      "fieldConfig": { "defaults": { "unit": "short" }, "overrides": [] }
    },
    {
      "id": 2,
      "type": "stat",
      "title": "对话错误数",
      "datasource": { "type": "prometheus", "uid": "${DS_PROMETHEUS}" },
      "gridPos": { "h": 5, "w": 4, "x": 4, "y": 0 },
      "targets": [{ "expr": "sum(smartcs_chat_errors_total)", "refId": "A" }],
      "fieldConfig": { "defaults": { "unit": "short", "thresholds": { "mode": "absolute", "steps": [{ "color": "green", "value": null }, { "color": "red", "value": 1 }] } }, "overrides": [] }
    },
    {
      "id": 3,
      "type": "stat",
      "title": "工具调用次数",
      "datasource": { "type": "prometheus", "uid": "${DS_PROMETHEUS}" },
      "gridPos": { "h": 5, "w": 4, "x": 8, "y": 0 },
      "targets": [{ "expr": "sum(smartcs_chat_tool_calls_total)", "refId": "A" }],
      "fieldConfig": { "defaults": { "unit": "short" }, "overrides": [] }
    },
    {
      "id": 4,
      "type": "timeseries",
      "title": "对话请求速率 (req/s)",
      "datasource": { "type": "prometheus", "uid": "${DS_PROMETHEUS}" },
      "gridPos": { "h": 5, "w": 12, "x": 12, "y": 0 },
      "targets": [{ "expr": "sum(rate(smartcs_chat_duration_seconds_count[1m]))", "legendFormat": "req/s", "refId": "A" }],
      "fieldConfig": { "defaults": { "unit": "reqps" }, "overrides": [] }
    },
    {
      "id": 5,
      "type": "timeseries",
      "title": "全链路平均耗时 (e2e / LLM总 / RAG / 首Token)",
      "datasource": { "type": "prometheus", "uid": "${DS_PROMETHEUS}" },
      "gridPos": { "h": 8, "w": 12, "x": 0, "y": 5 },
      "targets": [
        { "expr": "sum(rate(smartcs_chat_e2e_duration_seconds_sum[5m])) / sum(rate(smartcs_chat_e2e_duration_seconds_count[5m]))", "legendFormat": "e2e", "refId": "A" },
        { "expr": "sum(rate(smartcs_chat_llm_total_duration_seconds_sum[5m])) / sum(rate(smartcs_chat_llm_total_duration_seconds_count[5m]))", "legendFormat": "llm_total", "refId": "B" },
        { "expr": "sum(rate(smartcs_chat_rag_duration_seconds_sum[5m])) / sum(rate(smartcs_chat_rag_duration_seconds_count[5m]))", "legendFormat": "rag", "refId": "C" },
        { "expr": "sum(rate(smartcs_chat_firsttoken_duration_seconds_sum[5m])) / sum(rate(smartcs_chat_firsttoken_duration_seconds_count[5m]))", "legendFormat": "first_token", "refId": "D" }
      ],
      "fieldConfig": { "defaults": { "unit": "s" }, "overrides": [] }
    },
    {
      "id": 6,
      "type": "timeseries",
      "title": "意图分类分布",
      "datasource": { "type": "prometheus", "uid": "${DS_PROMETHEUS}" },
      "gridPos": { "h": 8, "w": 12, "x": 12, "y": 5 },
      "targets": [{ "expr": "sum by (intent) (rate(smartcs_chat_intent_total[5m]))", "legendFormat": "{{intent}}", "refId": "A" }],
      "fieldConfig": { "defaults": { "unit": "reqps" }, "overrides": [] }
    },
    {
      "id": 7,
      "type": "timeseries",
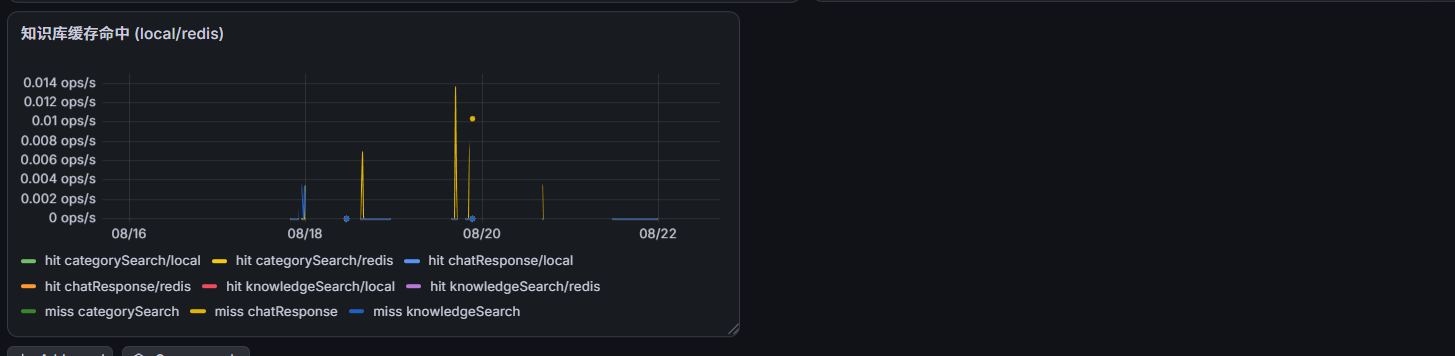
      "title": "知识库缓存命中 (local/redis)",
      "datasource": { "type": "prometheus", "uid": "${DS_PROMETHEUS}" },
      "gridPos": { "h": 8, "w": 12, "x": 0, "y": 13 },
      "targets": [
        { "expr": "sum by (cache, level) (rate(smartcs_cache_hits_total[5m]))", "legendFormat": "hit {{cache}}/{{level}}", "refId": "A" },
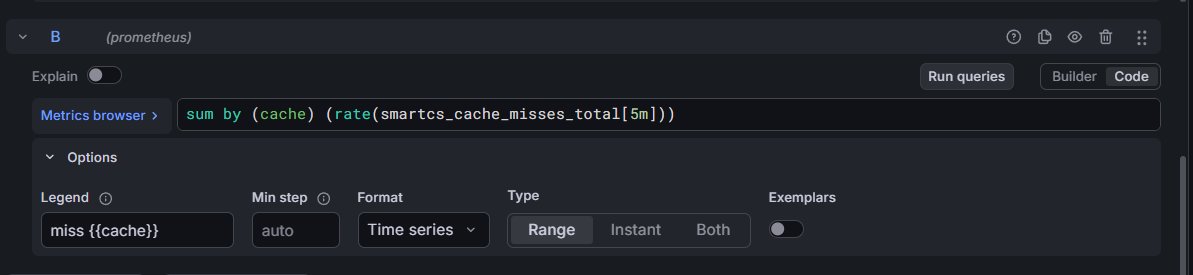
        { "expr": "sum by (cache) (rate(smartcs_cache_misses_total[5m]))", "legendFormat": "miss {{cache}}", "refId": "B" }
      ],
      "fieldConfig": { "defaults": { "unit": "ops" }, "overrides": [] }
    },
    {
      "id": 8,
      "type": "timeseries",
      "title": "CPU 使用率 (进程/系统)",
      "datasource": { "type": "prometheus", "uid": "${DS_PROMETHEUS}" },
      "gridPos": { "h": 8, "w": 12, "x": 12, "y": 13 },
      "targets": [
        { "expr": "process_cpu_usage", "legendFormat": "process", "refId": "A" },
        { "expr": "system_cpu_usage", "legendFormat": "system", "refId": "B" }
      ],
      "fieldConfig": { "defaults": { "unit": "percentunit", "max": 1 }, "overrides": [] }
    },
    {
      "id": 9,
      "type": "timeseries",
      "title": "JVM 堆内存",
      "datasource": { "type": "prometheus", "uid": "${DS_PROMETHEUS}" },
      "gridPos": { "h": 8, "w": 12, "x": 0, "y": 21 },
      "targets": [{ "expr": "sum(jvm_memory_used_bytes{area=\"heap\"})", "legendFormat": "heap used", "refId": "A" }],
      "fieldConfig": { "defaults": { "unit": "bytes" }, "overrides": [] }
    },
    {
      "id": 10,
      "type": "timeseries",
      "title": "HTTP 请求速率 (按URI)",
      "datasource": { "type": "prometheus", "uid": "${DS_PROMETHEUS}" },
      "gridPos": { "h": 8, "w": 12, "x": 12, "y": 21 },
      "targets": [{ "expr": "sum by (uri) (rate(http_server_requests_seconds_count[5m]))", "legendFormat": "{{uri}}", "refId": "A" }],
      "fieldConfig": { "defaults": { "unit": "reqps" }, "overrides": [] }
    }
  ]
}
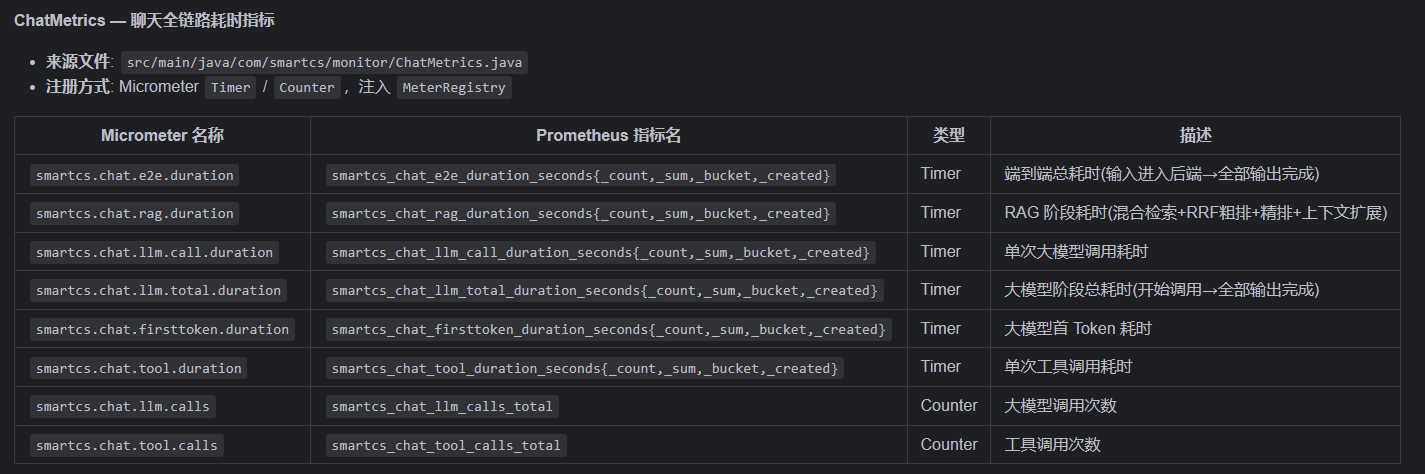
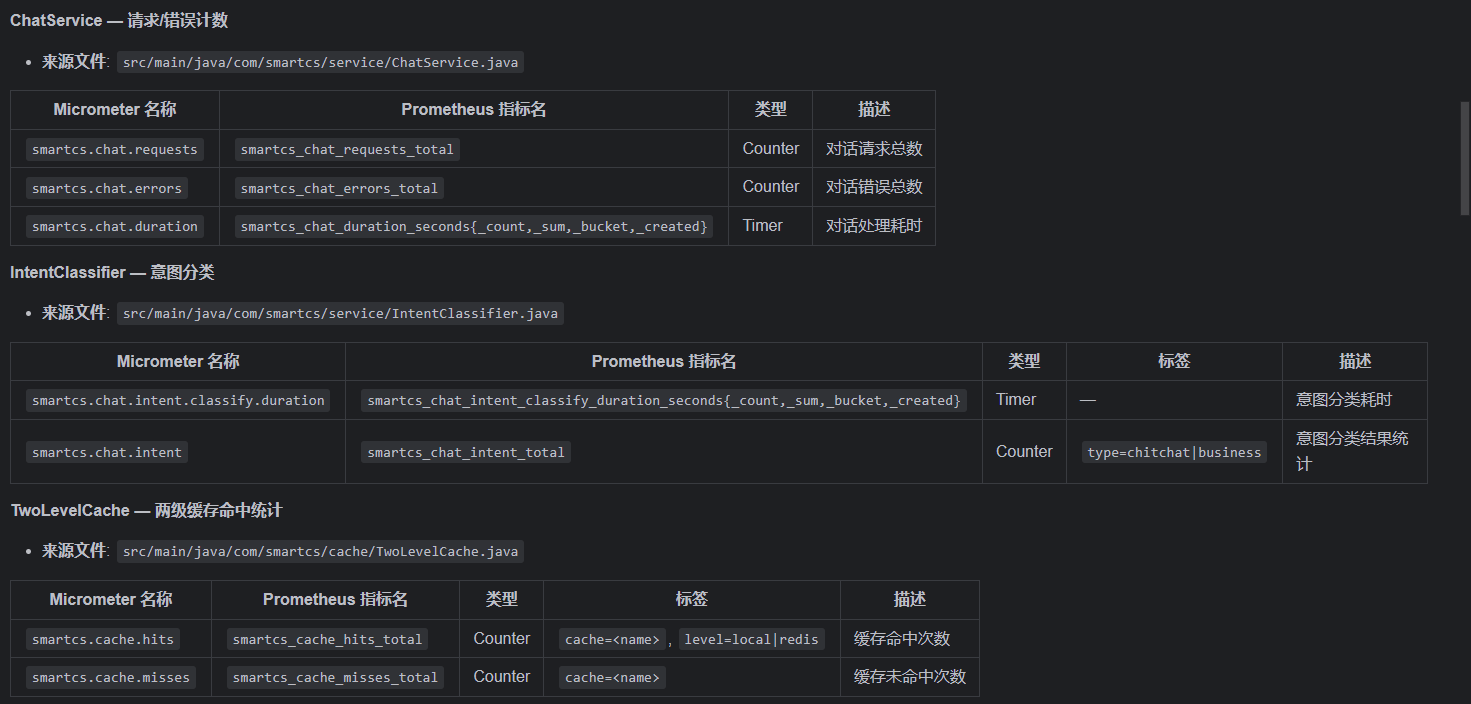
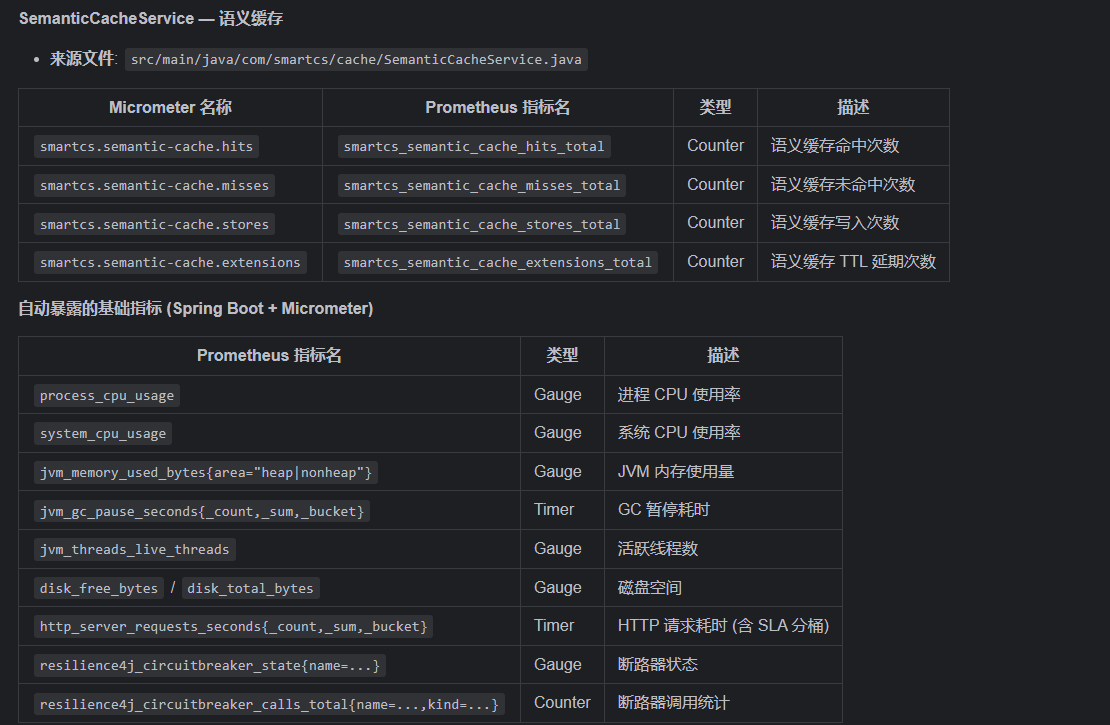
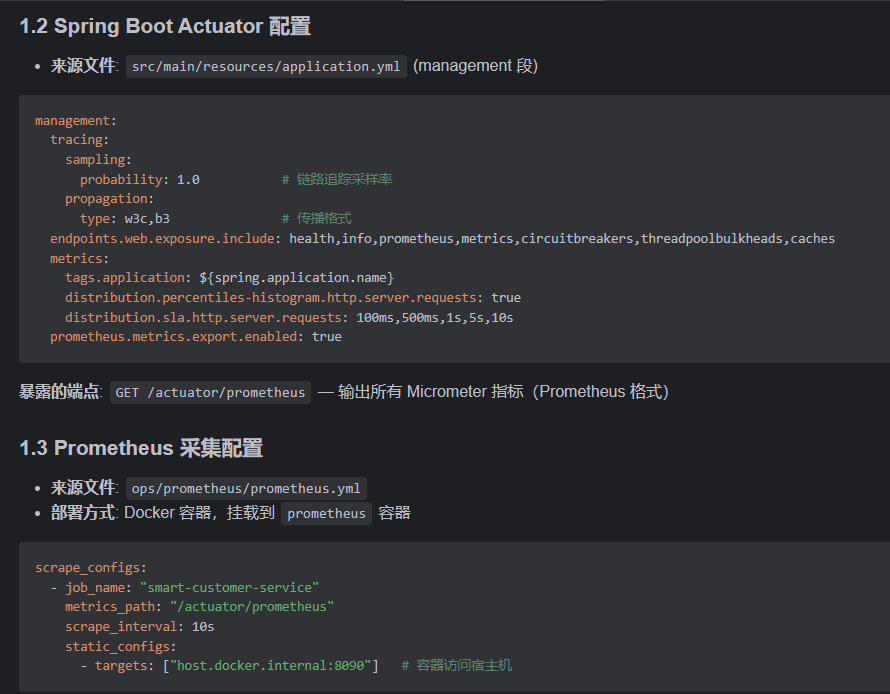
目前可以采集的数据有:
一、首先实现对话请求监控
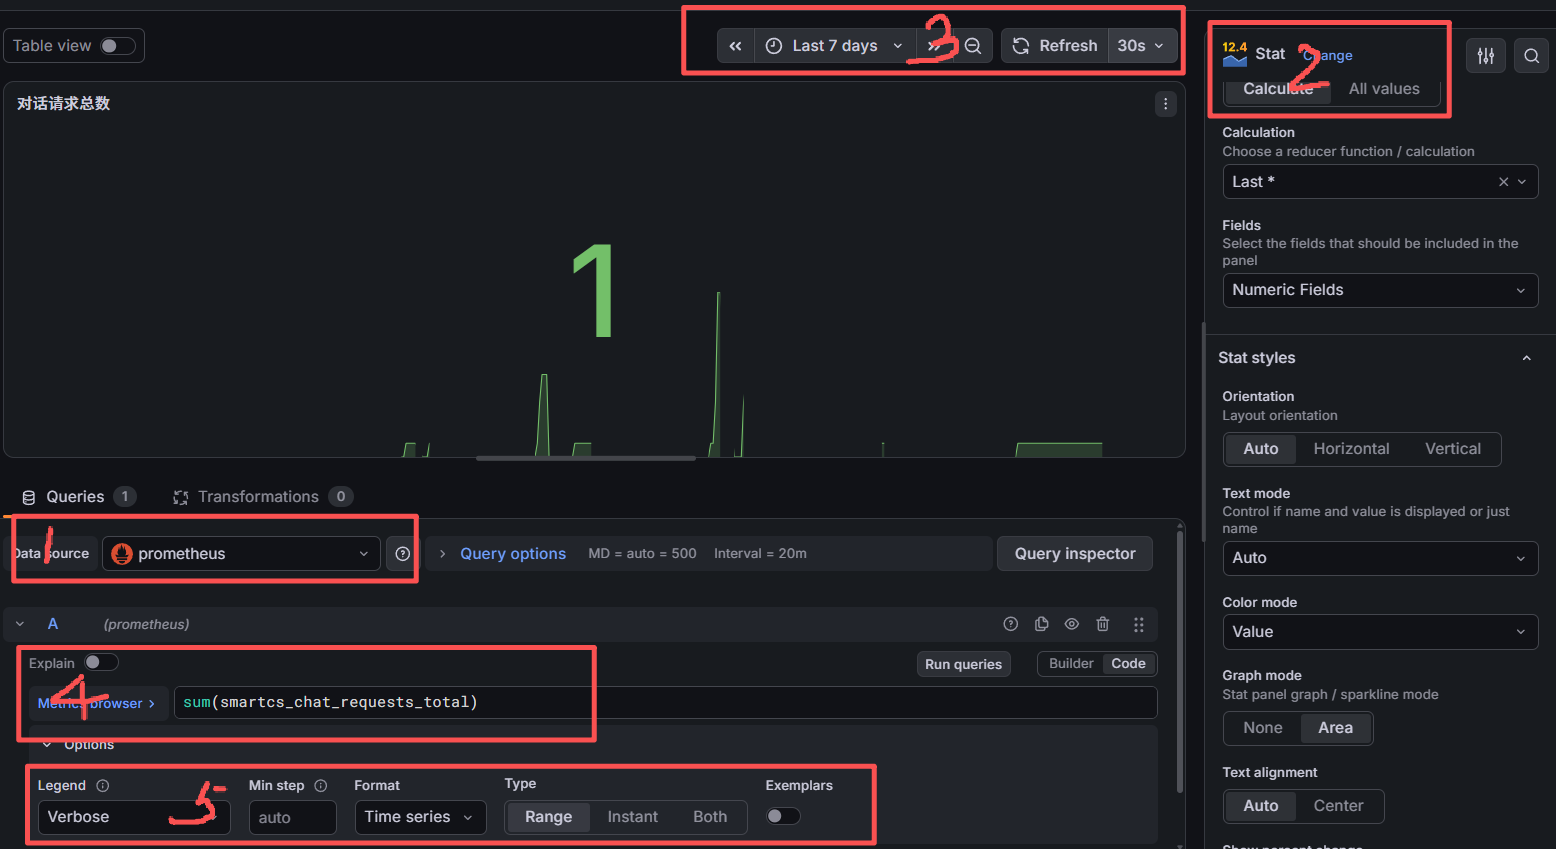
1.首先我们要确定数据来源是Prometheus,panel选择stat类型,将所有的请求数进行求和操作
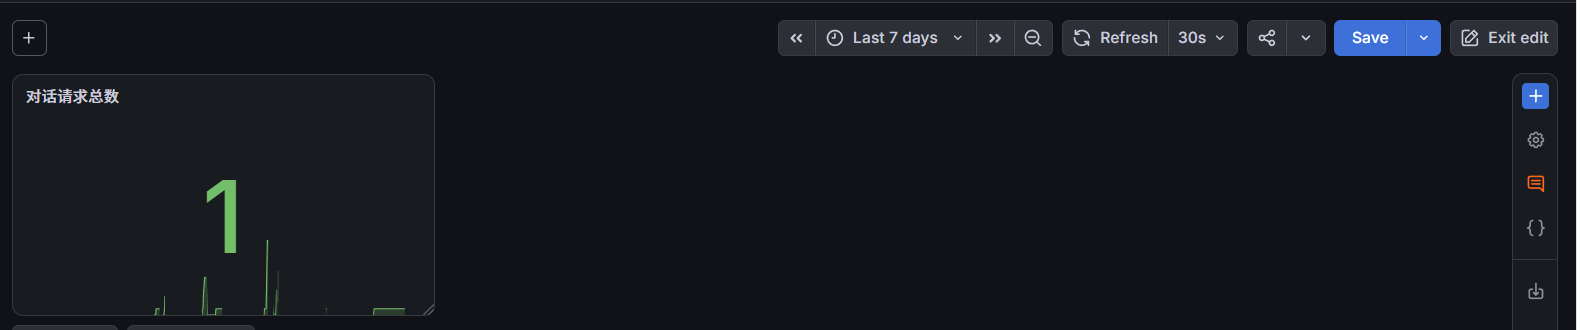
2.完成后的效果,panel的大小可以在页面根据实际需要拖动进行放大缩小
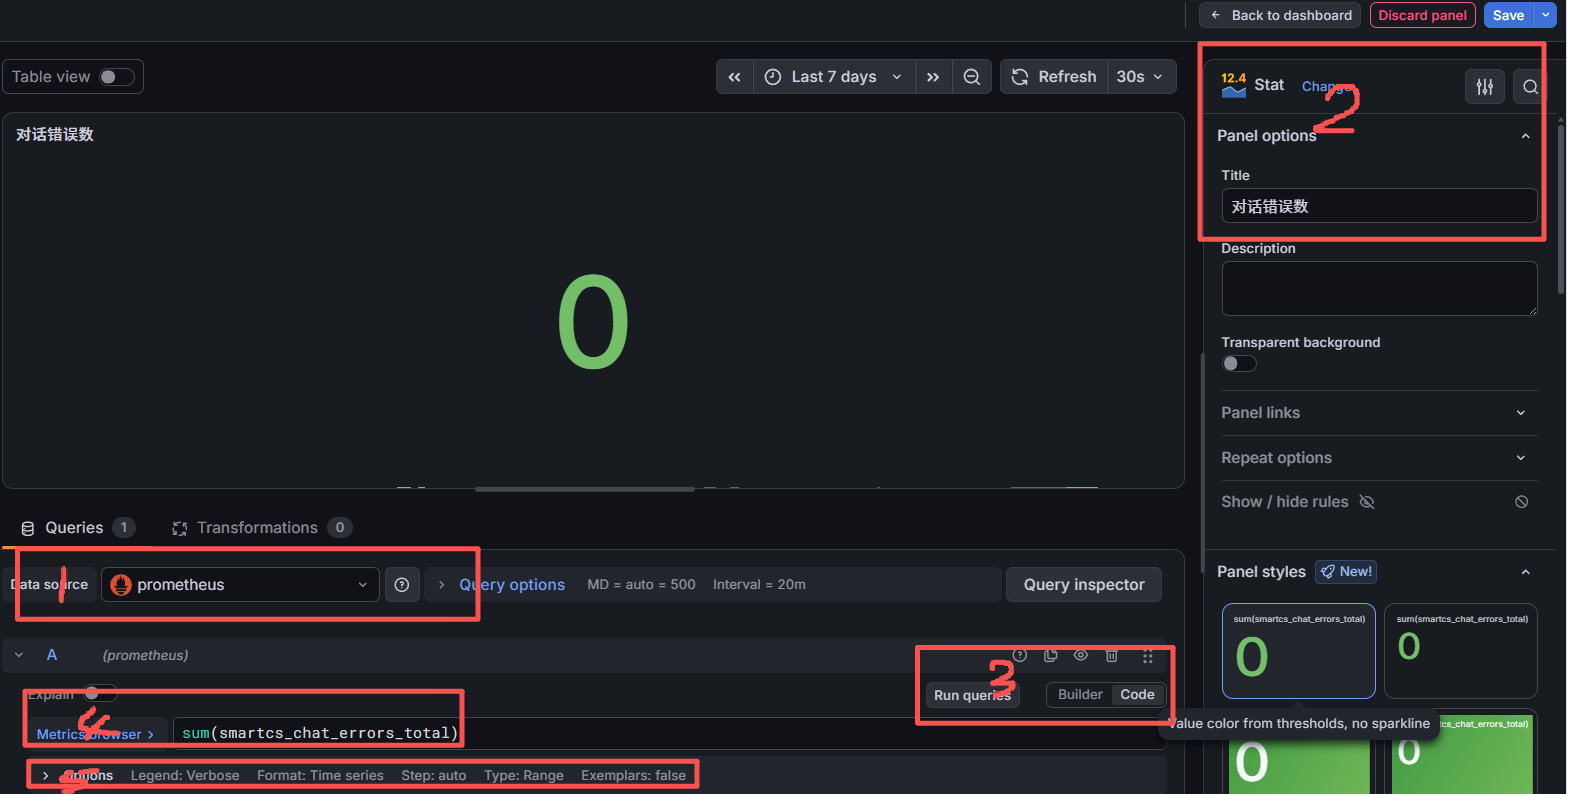
二、对话错误数监控
1.这里和对话请求配置一样,不同的地方就是求和的数量不一样
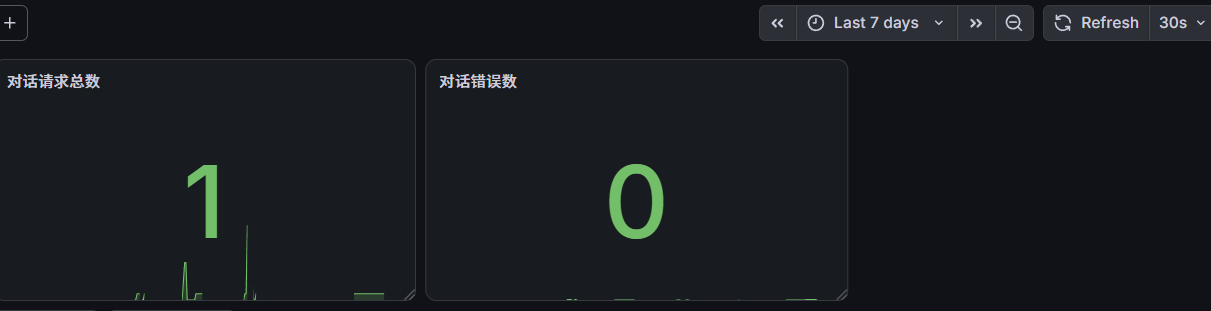
2.实现效果如下:
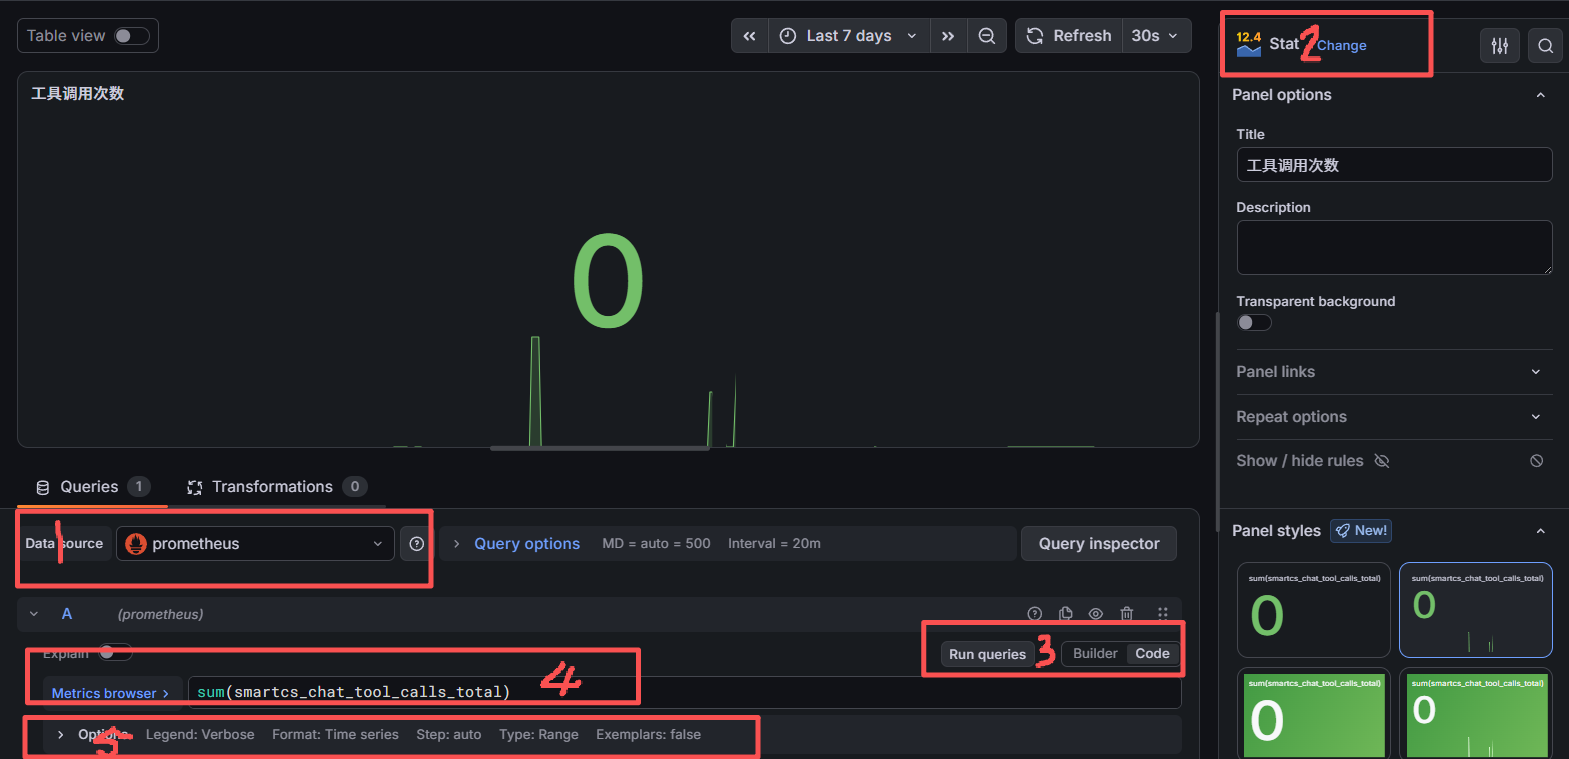
三、工具调用次数监控
1.这里和对话请求配置一样,不同的地方就是求和的数量不一样
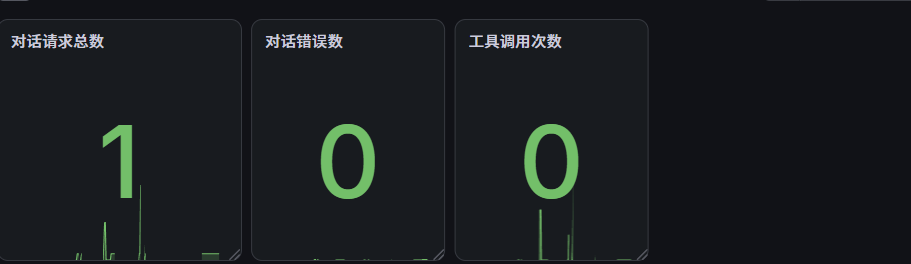
2.实现后的效果如下:
四、对话请求速率(req/s)监控
1.这里的区别注意在于panel的不同和unit单位选择以及参数的设计
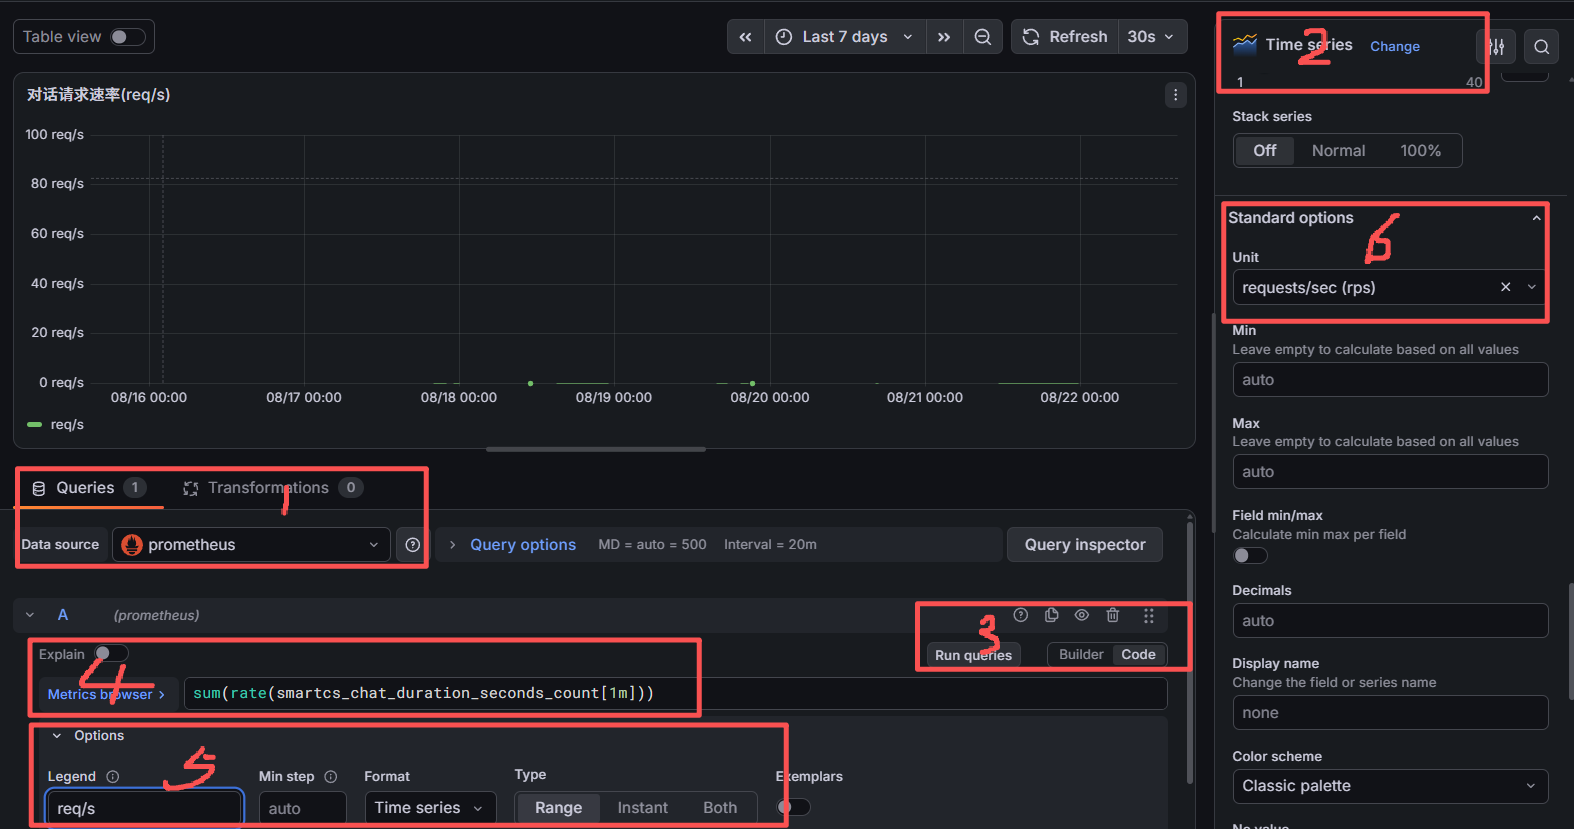
2.实现后的效果如下:
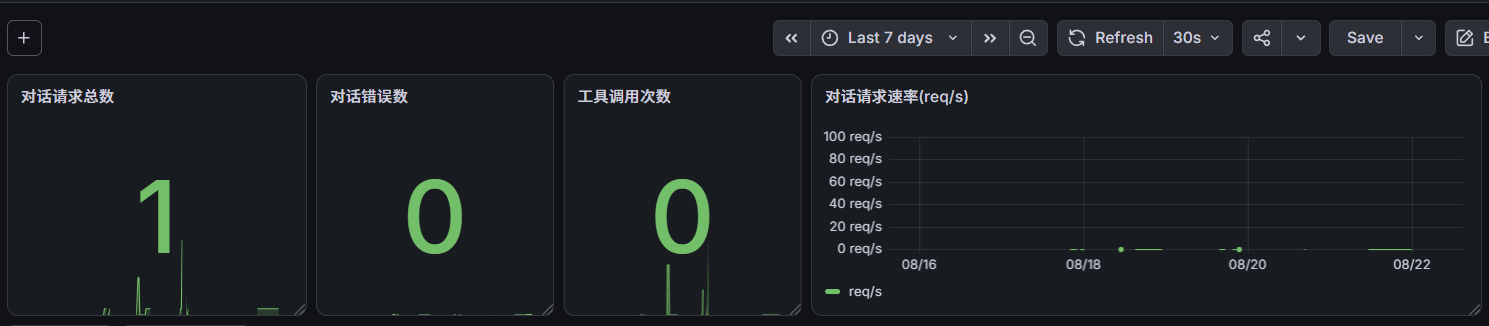
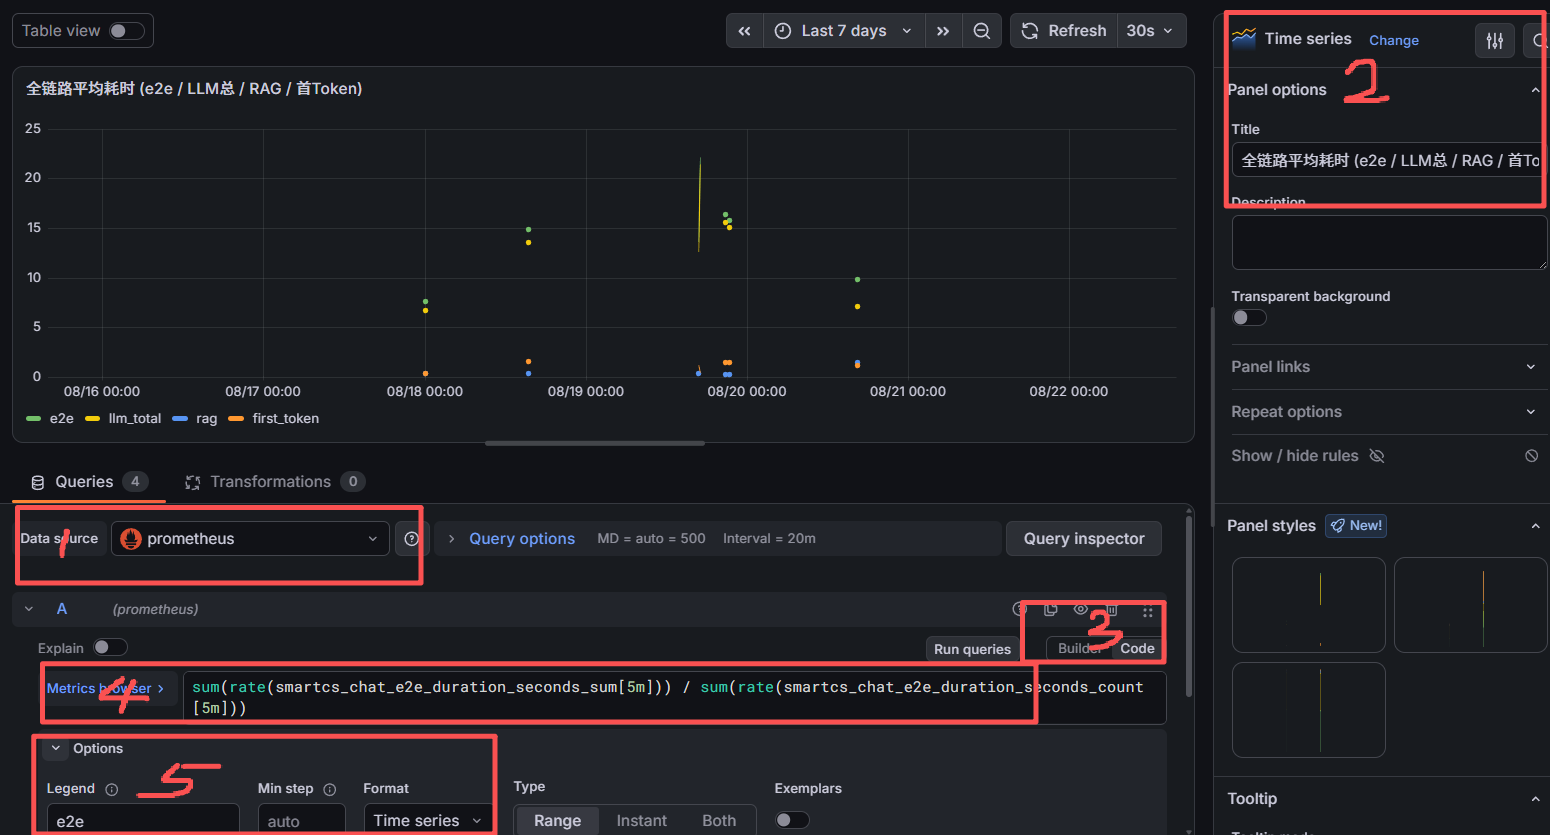
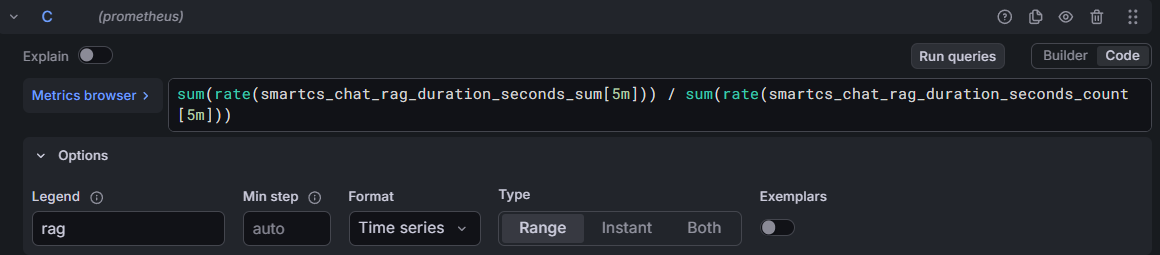
五、全链路平均耗时 (e2e / LLM总 / RAG / 首Token)监控
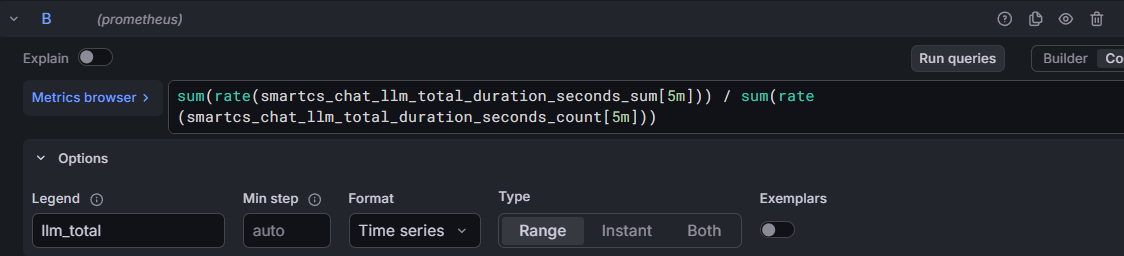
1.这里我们一共监控了4个数值,因此创建了4个query来实现

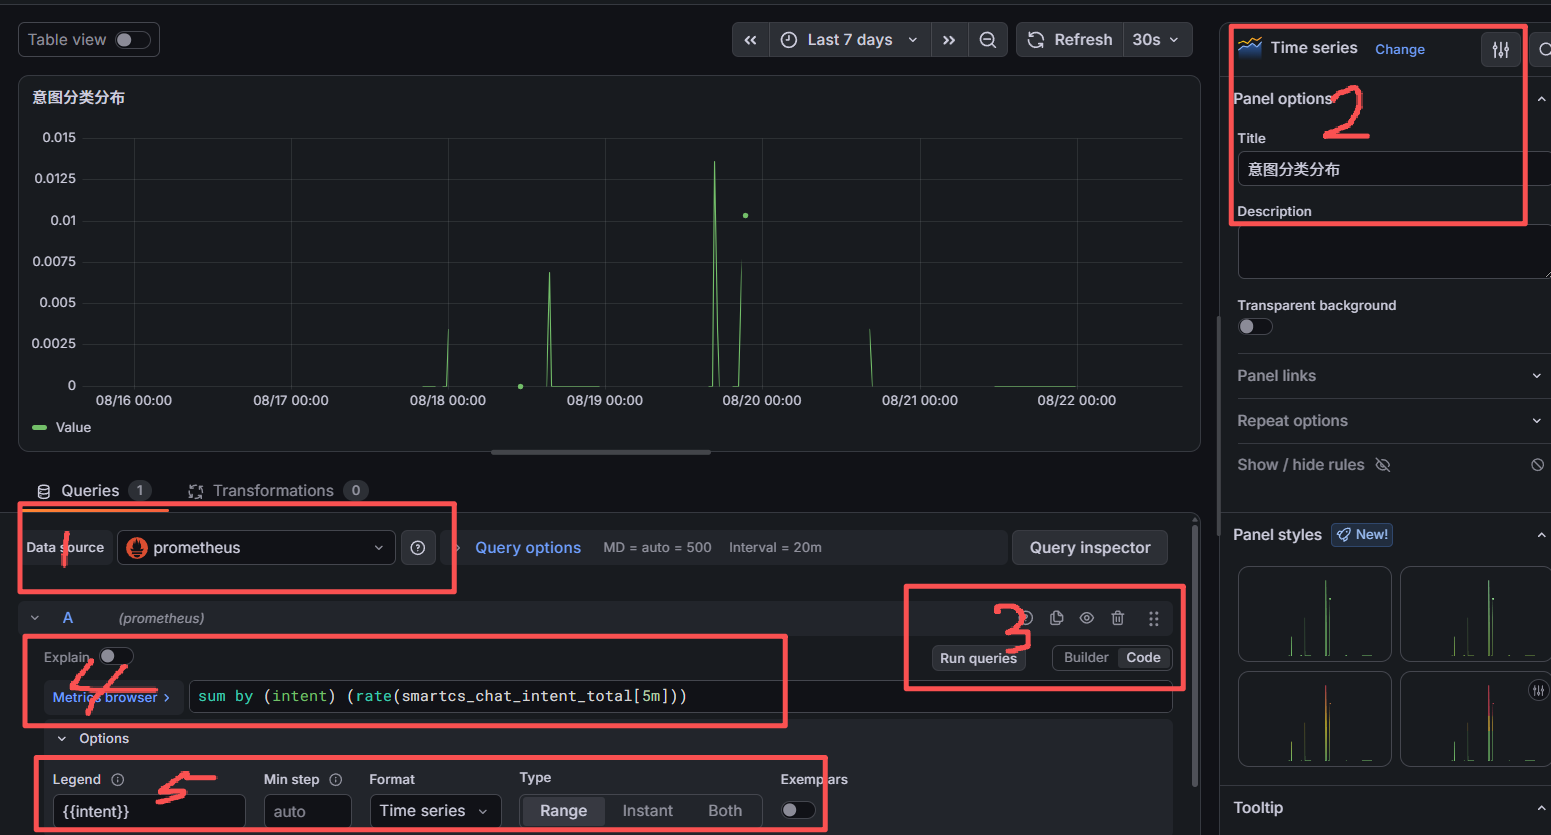
六、意图分类分布监控
1.这里主要变化在于查询参数的变化
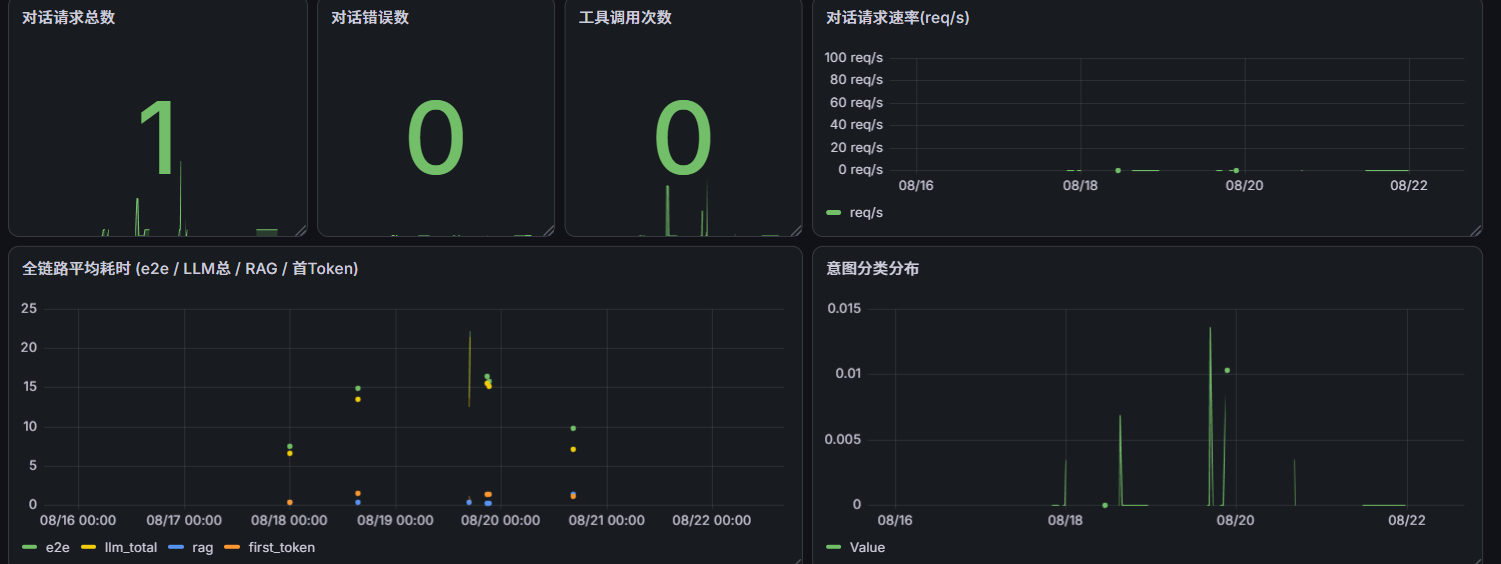
2.效果图如下:
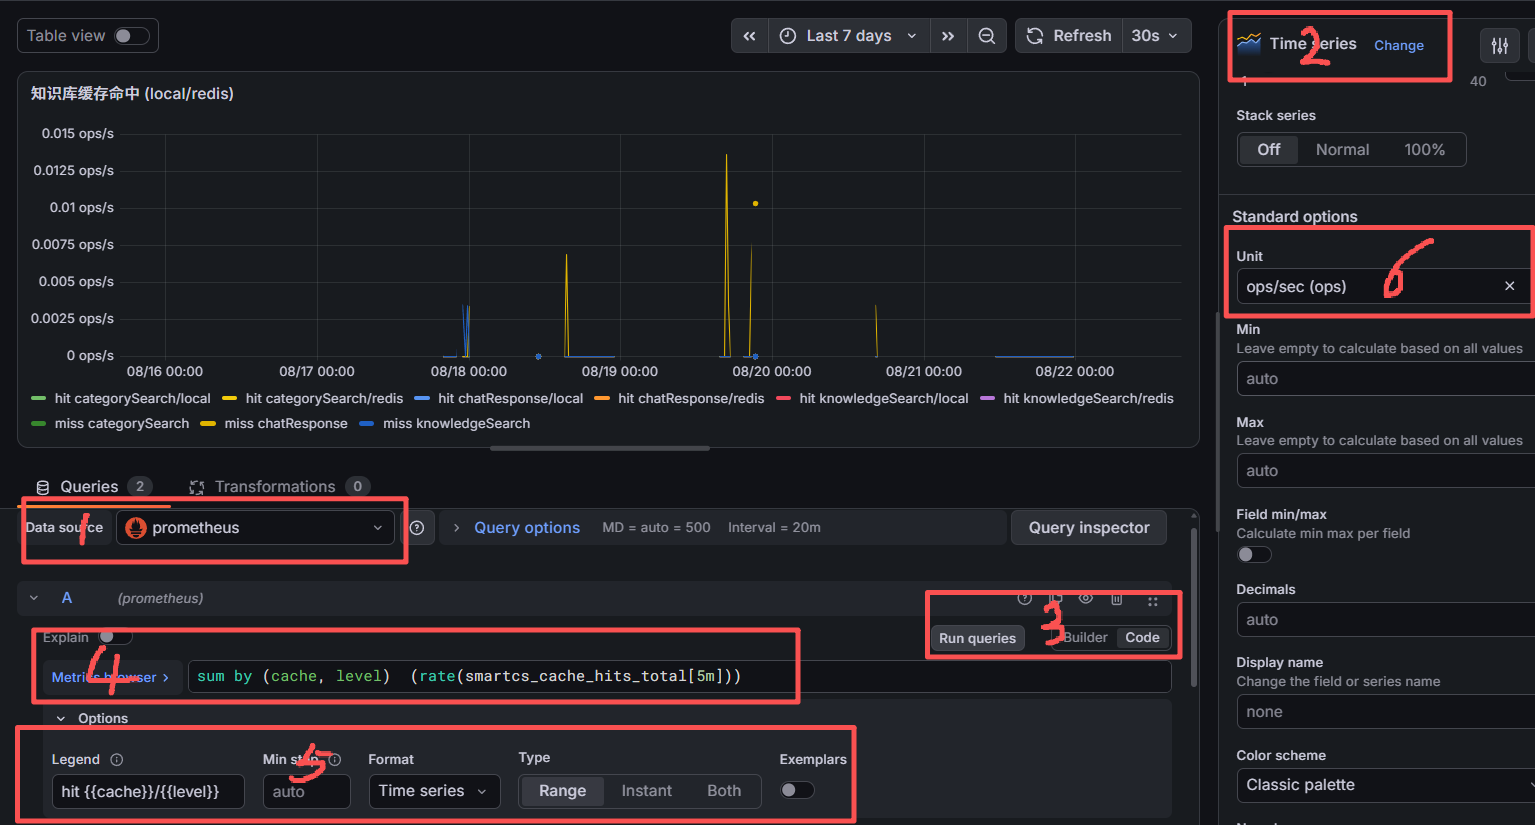
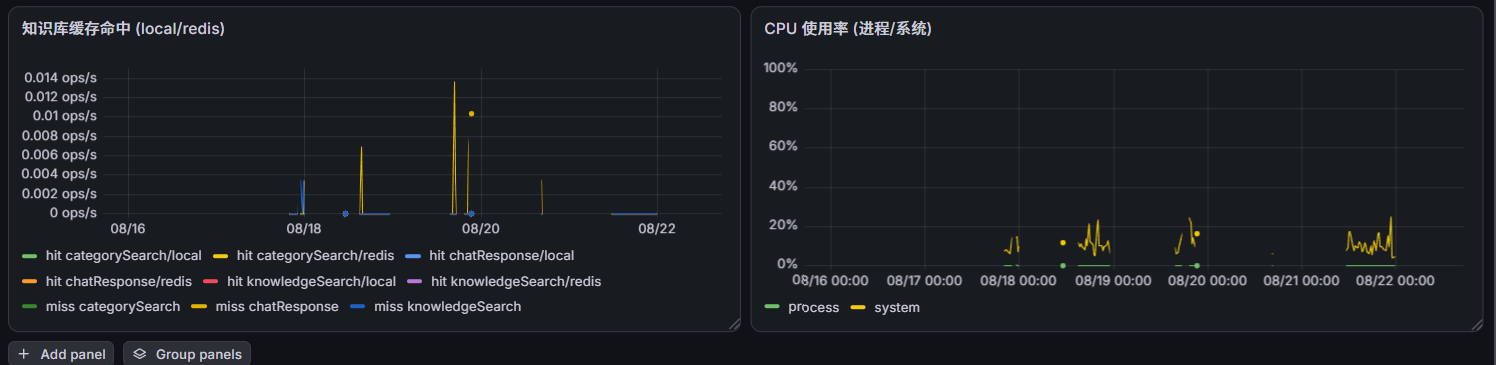
七、知识库缓存命中 (local/redis)
1.针对缓存命中,里面记录了多个不同的cache和level
3.实现的效果如下:
八、CPU 使用率 (进程/系统)监控
1.添加cpu监控
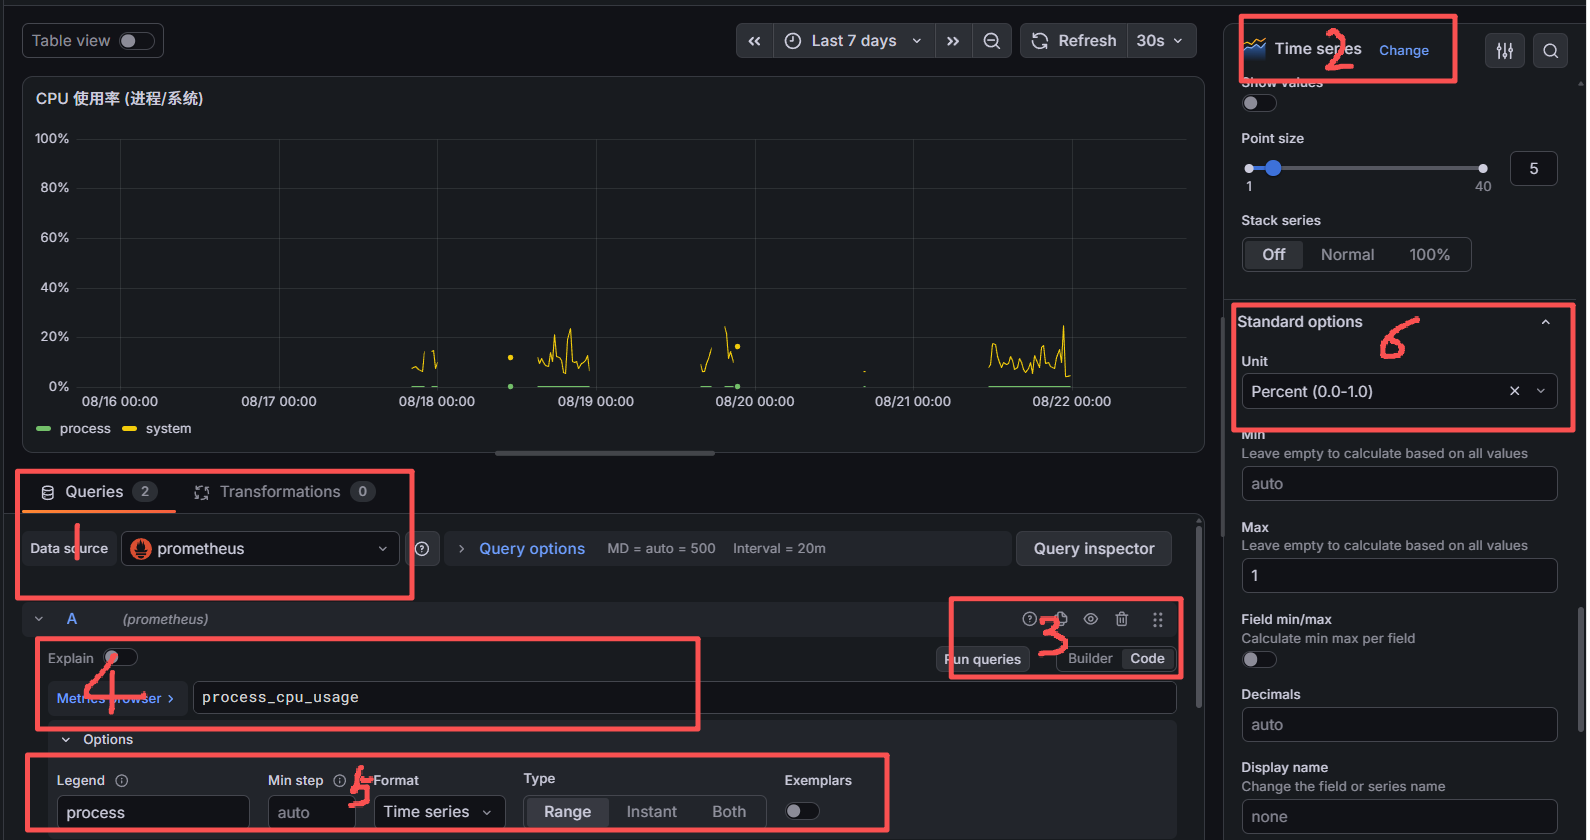
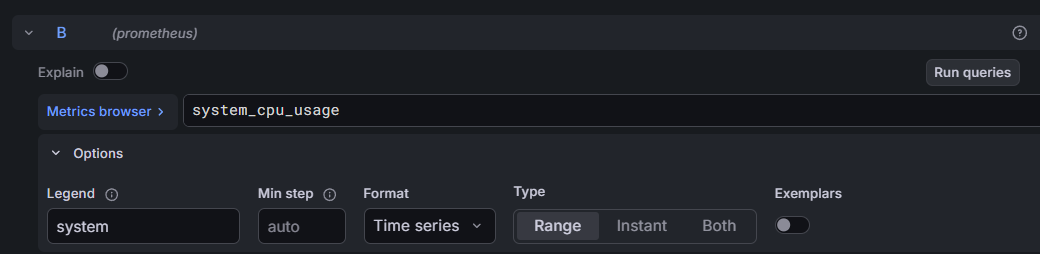
2.实现效果如下:
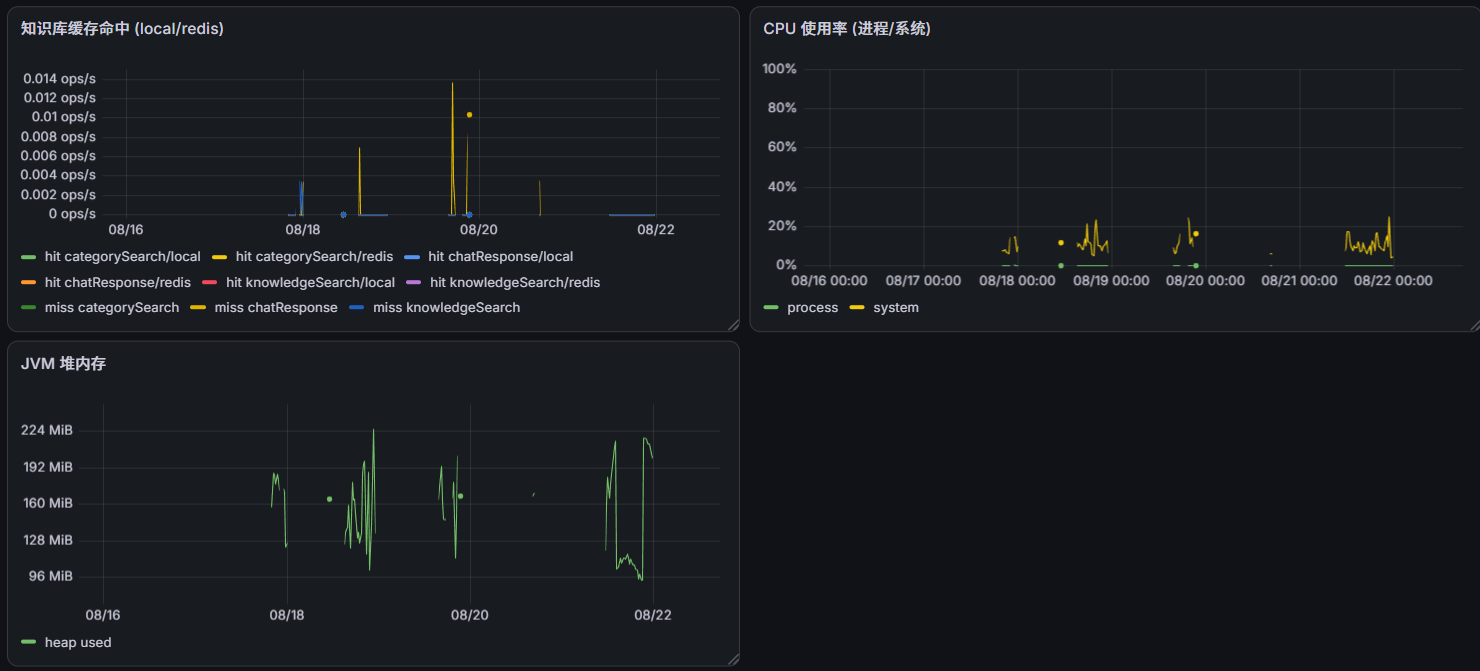
九、JVM 堆内存监控
1.直接进行jvm加载
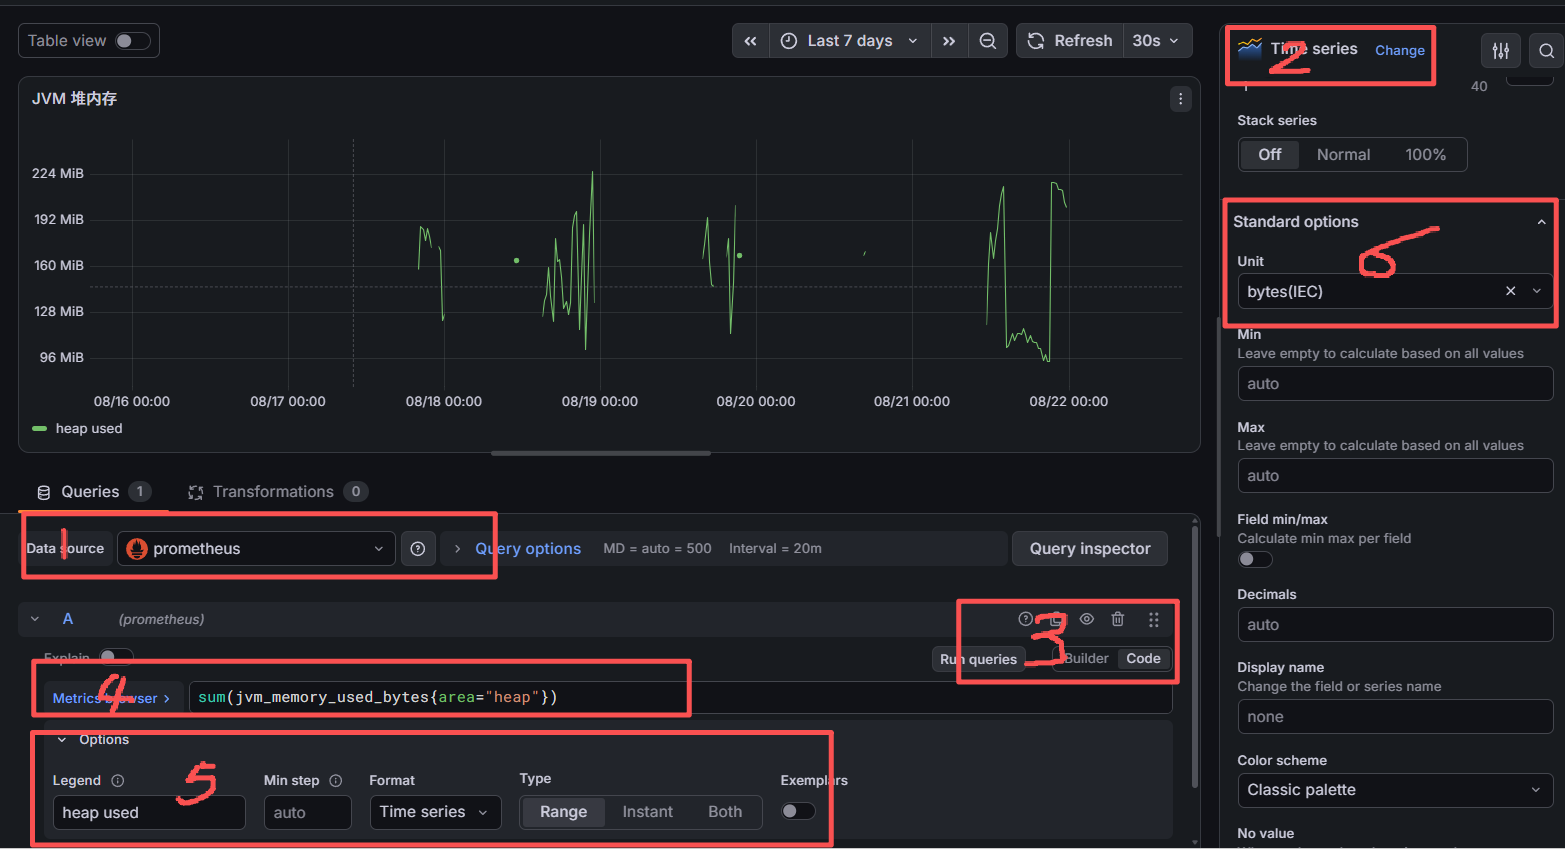
2.实现效果如下:
十、HTTP 请求速率 (按URI)监控
1.实现请求监控
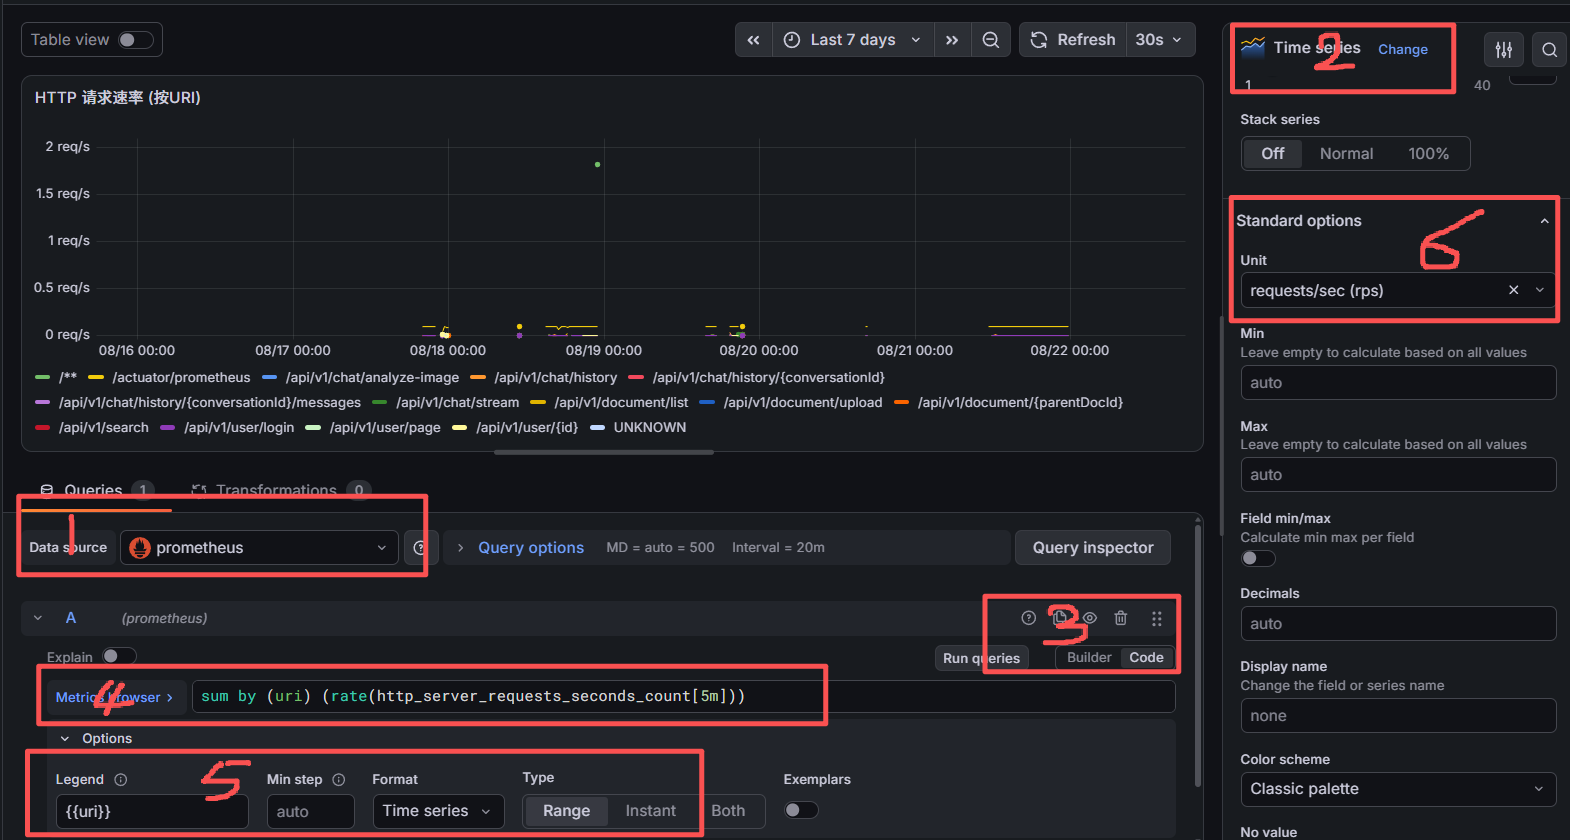
2.实现效果如下:
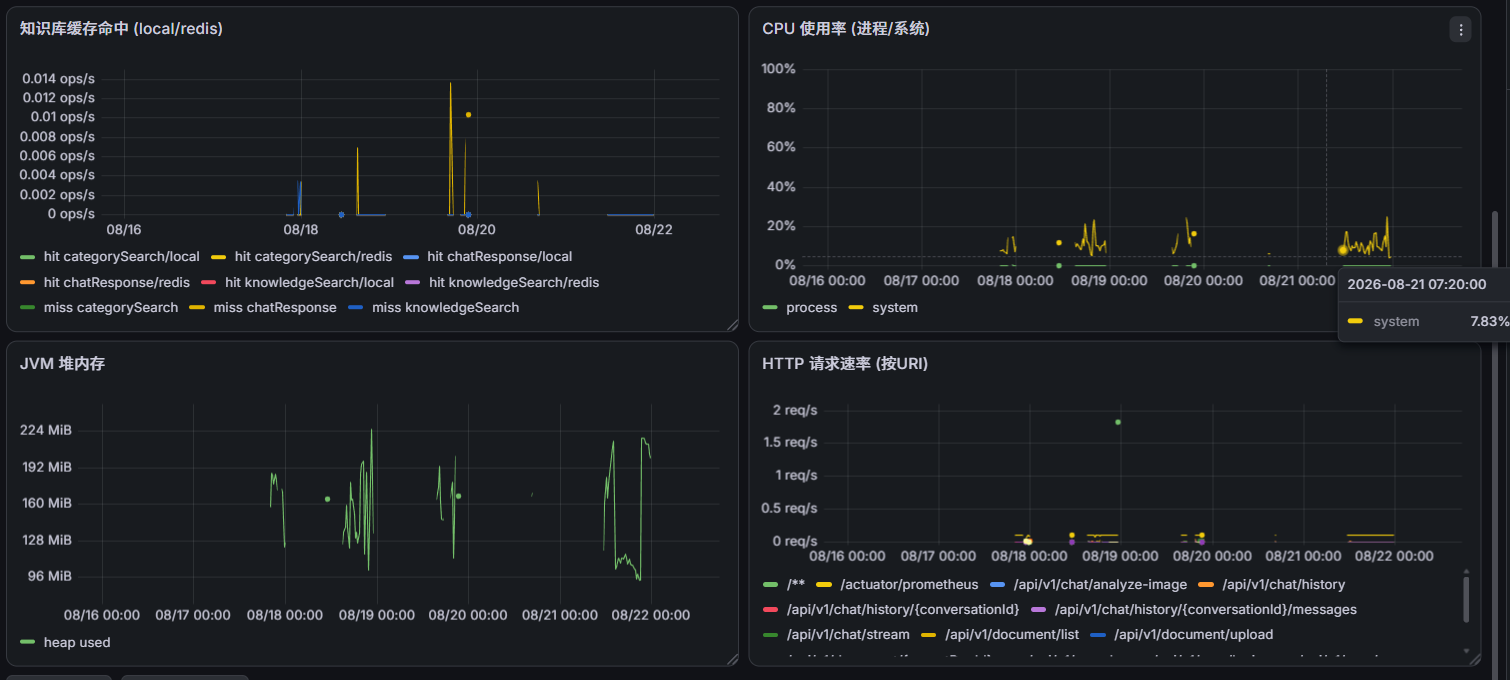
到此完成了总的监控,如果还需要实现其他的监控,可以参考实现以及对应的监控参数