第1部:Prometheus监控
摘要:本文从零开始搭建一套完整的 Prometheus 监控告警体系。首先介绍 Prometheus 的核心概念、组件与架构,随后详细演示在 Linux 上部署 Prometheus 服务端,并通过 node_exporter 实现对本地及远程主机的监控,最后接入 Grafana 完成数据的可视化展示,帮助读者快速掌握云原生监控的落地实践。
基础概念
1:Prometheus是什么
Prometheus 是开源的云原生监控告警系统,由 SoundCloud 开发,2016 年加入 CNCF,是 Kubernetes 生态标配监控组件。
2:Prometheus特征
1.多维数据模型:使用指标名称和键值对(标签)标识时间序列数据。
2.PromQL 查询语言:灵活的查询语言,可利用多维特性完成数据查询。
3.单机自治:不依赖分布式存储,单个服务器节点即可独立工作。
4.HTTP 拉取采集:通过 HTTP 拉取模式收集时序指标数据。
5.支持推送网关:借助 Pushgateway 中间网关接收时序数据,适配短生命周期作业。
6.多种目标发现方式:可通过服务发现或者静态配置发现监控目标。
7.可视化支持:提供多种图形和仪表盘展示模式,可对接 Grafana。
3:什么是指标
通俗来说,指标是数值型的测量结果。时间序列意味着随着时间的推移记录变化。
不同应用程序需要测量的内容各不相同:
- 网页服务器:请求响应时间
- 数据库:活动连接数、活动查询数
指标可以帮助理解应用程序运行状态。例如业务访问量大导致应用变慢,通过请求计数指标就可以定位问题,扩容服务器处理负载。
4:Prometheus组件
Prometheus 生态系统由多个组件组成,很多组件是可选的:
- Prometheus 主服务器:抓取并存储时间序列数据。
- 客户端库:用于对应用程序代码做埋点、采集指标。
- 推送网关(Pushgateway):用于支持短生命周期作业上报指标。
- 专用导出器 Exporter:采集 HAProxy、StatsD、Graphite 等各类服务的指标。
- 告警管理器 Alertmanager:专门处理告警。
- 各类支持工具。
补充:大部分 Prometheus 组件使用 Go 语言编写,便于编译,以静态二进制文件部署。
5:Prometheus架构
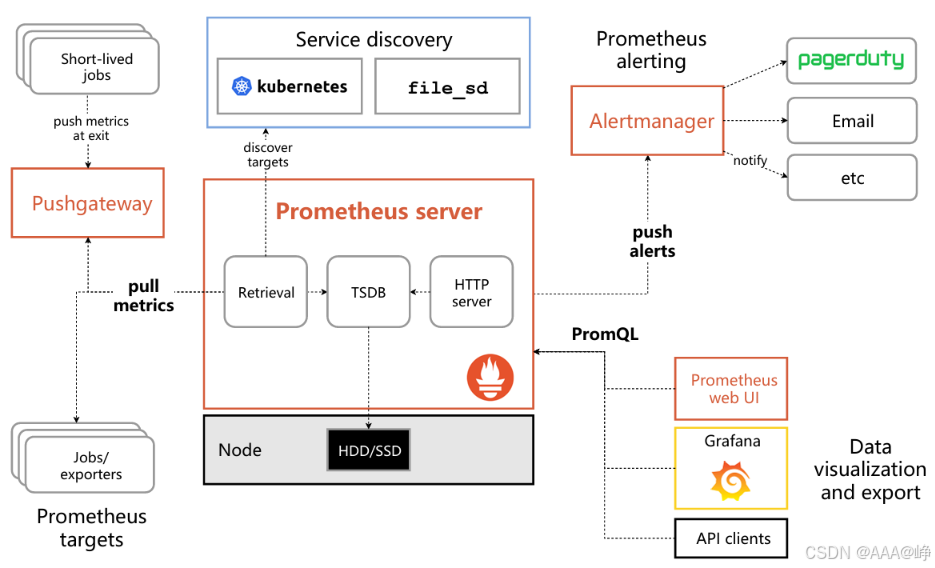
Prometheus 采用Pull 拉取模型,整体工作流程:采集指标→本地存储时序数据→规则处理→告警 / 可视化展示。
-
指标采集
Prometheus 直接从提供 HTTP 指标接口的监控目标抓取指标(CPU、内存、请求延迟、业务自定义指标)。
对于短暂生命周期作业、无法直接被抓取的目标,作业把指标推送到Pushgateway 推送网关,再由 Prometheus 从网关拉取指标。
支持服务发现、静态配置两种方式识别监控目标。
-
Prometheus Server 核心处理
- Retrieval 模块:负责抓取指标;
- TSDB 时序数据库:将采集到的指标本地磁盘存储,按照指标名 + 标签的组合组织时序数据;
- PromQL 查询引擎:提供 PromQL 查询语言,执行复杂查询、聚合运算;
- 规则引擎:定义规则,生成新指标、评估告警规则,将告警事件推送至 Alertmanager。
-
告警处理
告警事件发送到 Alertmanager,由它完成告警分组、去重、通知分发,输出邮件、PagerDuty 等告警通知。
-
可视化展示
Prometheus 自带简单 Web UI;一般对接Grafana,Grafana 调用 Prometheus API,实现丰富仪表盘、图表可视化。
总结:Prometheus 收集指标,本地存储,执行规则;告警交给 Alertmanager;可视化交给 Grafana。
6:Prometheus应用场景
Prometheus 非常适合记录任何纯数字的时间序列。
- 适用于机器为中心的监控,也适用于高度动态的面向服务架构、微服务架构监控,多维数据收集与查询是它的突出优势。
- 设计注重可靠性,故障期间可以快速诊断问题。
- 每个 Prometheus 服务器独立运行,不依赖网络存储或远程服务;基础设施其他部分故障时依然可用,部署不需要复杂基础设施。
7:Prometheus不适用场景
Prometheus 优先保障可靠性,故障下仍可查看系统统计。
不适合需要 100% 数据准确性的场景,例如按请求计费,采集的数据可能不够完整精确。
计费统计这类业务建议使用其他系统实现,Prometheus 只负责其余监控工作。
8:Prometheus官方网址
https://prometheus.io/docs/introduction/overview/
Prometheus部署
1:环境准备
| 序号 | 主机名 | IP地址 | 角色 |
|---|---|---|---|
| 1 | Prometheus-server | 192.168.100.128/24 | server |
| 2 | Prometheus-agent | 192.168.100.129/24 | agent |
2:源码包下载
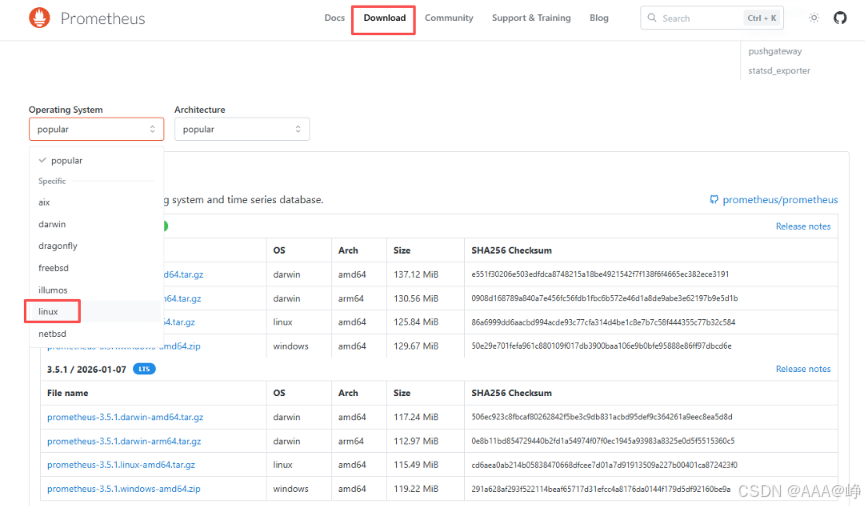
平台选择64位
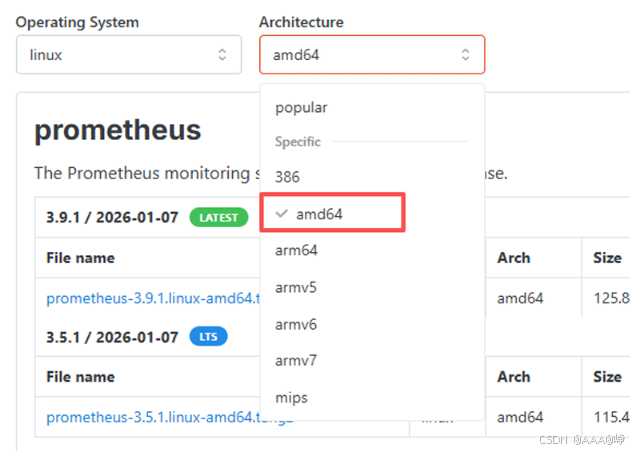
下载源码包
bash
[root@prometheus-server ~]# wget https://github.com/prometheus/prometheus/releases/download/v3.5.1/prometheus-3.5.1.linux-amd64.tar.gz3:安装Prometheus
bash
[root@prometheus-server ~]# tar zxvf prometheus-3.5.1.linux-amd64.tar.gz
prometheus-3.5.1.linux-amd64/
prometheus-3.5.1.linux-amd64/NOTICE
prometheus-3.5.1.linux-amd64/LICENSE
prometheus-3.5.1.linux-amd64/prometheus.yml
prometheus-3.5.1.linux-amd64/promtool
prometheus-3.5.1.linux-amd64/prometheus
[root@prometheus-server ~]# mv prometheus-3.5.1.linux-amd64 /usr/local/src/prometheus
[root@prometheus-server ~]#  cd /usr/local/src/prometheus/
[root@prometheus-server prometheus]# ls
LICENSE  NOTICE  prometheus  prometheus.yml  promtool
修改配置文件prometheus.yml
bash
[root@prometheus-server prometheus]# vim prometheus.yml
  - job_name: "prometheus-server"     #23行  监控本地节点名称

    # metrics_path defaults to '/metrics'
    # scheme defaults to 'http'.

    static_configs:
      - targets: ["192.168.100.128:9090"]      #29行  设置本地节点IP
启动服务
bash
[root@prometheus-server prometheus]# nohup ./prometheus --config.file=prometheus.yml &
[1] 1922
[root@prometheus-server prometheus]# nohup: 忽略输入并把输出追加到"nohup.out"
查看端口
bash
[root@prometheus-server prometheus]# ps -ef | grep "prometheus"
root       1922   1735  0 20:33 pts/0    00:00:00 ./prometheus --config.file=prometheus.yml
4:使用systemd管理服务
先结束当前运行的进程
bash
[root@prometheus-server prometheus]# ps -ef | grep "prometheus"
root       1922   1735  0 20:33 pts/0    00:00:00 ./prometheus --config.file=prometheus.yml
root       2012   1735  0 20:35 pts/0    00:00:00 grep --color=auto prometheus
bash
[root@prometheus-server prometheus]# kill -9 1922
bash
[root@prometheus-server prometheus]# ps -ef | grep "prometheus"
root       2131   1735  0 20:37 pts/0    00:00:00 grep --color=auto prometheus
[1]+  已杀死               nohup ./prometheus --config.file=prometheus.yml
添加service文件
bash
[root@prometheus-server prometheus]# vim /usr/lib/systemd/system/prometheus.service
[Service]
ExecStart=/usr/local/src/prometheus/prometheus --config.file=/usr/local/src/prometheus/prometheus.yml

[Install]
WantedBy=multi-user.target

[Unit]
Description=prometheus
After=network.target
启动服务
bash
[root@prometheus-server prometheus]# systemctl daemon-reload
[root@prometheus-server prometheus]# systemctl enable prometheus.service --now
Created symlink from /etc/systemd/system/multi-user.target.wants/prometheus.service to /usr/lib/systemd/system/prometheus.service.
[root@prometheus-server prometheus]# systemctl status prometheus.service
● prometheus.service - prometheus
   Loaded: loaded (/usr/lib/systemd/system/prometheus.service; enabled; vendor preset: disabled)
   Active: active (running) since 一 2026-08-31 20:38:31 CST; 5s ago
 Main PID: 2215 (prometheus)
    Tasks: 7
   Memory: 18.8M
   CGroup: /system.slice/prometheus.service
           └─2215 /usr/local/src/prometheus/prometheus --config.file=/usr/local/src/prometheus/prometheus.yml

8月 31 20:38:31 prometheus-server prometheus[2215]: time=2026-08-31T20:38:31.788+08:00 level=INFO source=head.go:744...2.126µs
8月 31 20:38:31 prometheus-server prometheus[2215]: time=2026-08-31T20:38:31.788+08:00 level=INFO source=head.go:752...=tsdb
8月 31 20:38:31 prometheus-server prometheus[2215]: time=2026-08-31T20:38:31.788+08:00 level=INFO source=head.go:825...5.967µs
8月 31 20:38:31 prometheus-server prometheus[2215]: time=2026-08-31T20:38:31.788+08:00 level=INFO source=head.go:862 msg=...µs
8月 31 20:38:31 prometheus-server prometheus[2215]: time=2026-08-31T20:38:31.791+08:00 level=INFO source=main.go:130...MAGIC
8月 31 20:38:31 prometheus-server prometheus[2215]: time=2026-08-31T20:38:31.791+08:00 level=INFO source=main.go:131...rted"
8月 31 20:38:31 prometheus-server prometheus[2215]: time=2026-08-31T20:38:31.791+08:00 level=INFO source=main.go:149...s.yml
8月 31 20:38:31 prometheus-server prometheus[2215]: time=2026-08-31T20:38:31.812+08:00 level=INFO source=main.go:1537 msg...ms
8月 31 20:38:31 prometheus-server prometheus[2215]: time=2026-08-31T20:38:31.812+08:00 level=INFO source=main.go:127...sts."
8月 31 20:38:31 prometheus-server prometheus[2215]: time=2026-08-31T20:38:31.812+08:00 level=INFO source=manager.go:...ager"
Hint: Some lines were ellipsized, use -l to show in full.
关闭防火墙和selinux
bash
[root@prometheus-server prometheus]# systemctl disable firewalld.service --now
[root@prometheus-server prometheus]# setenforce 0
5:访问Prometheus网站
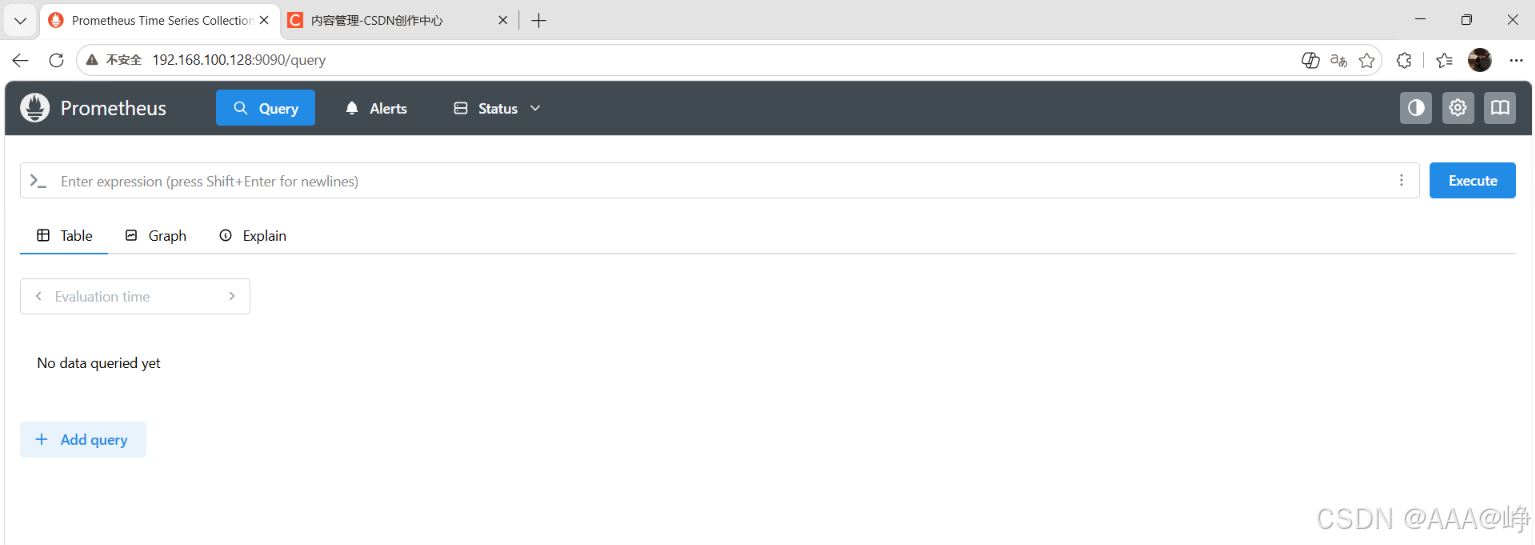
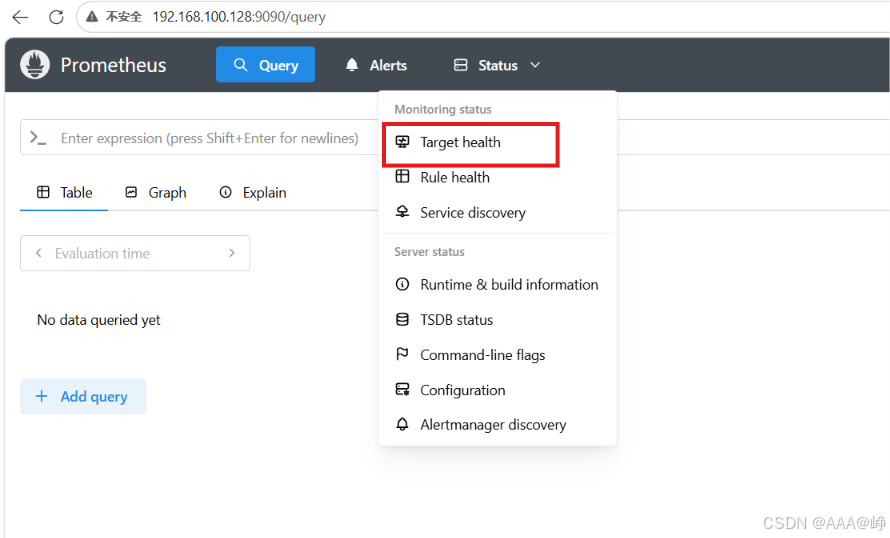
5:查看监控目标
查看到本节点被监控
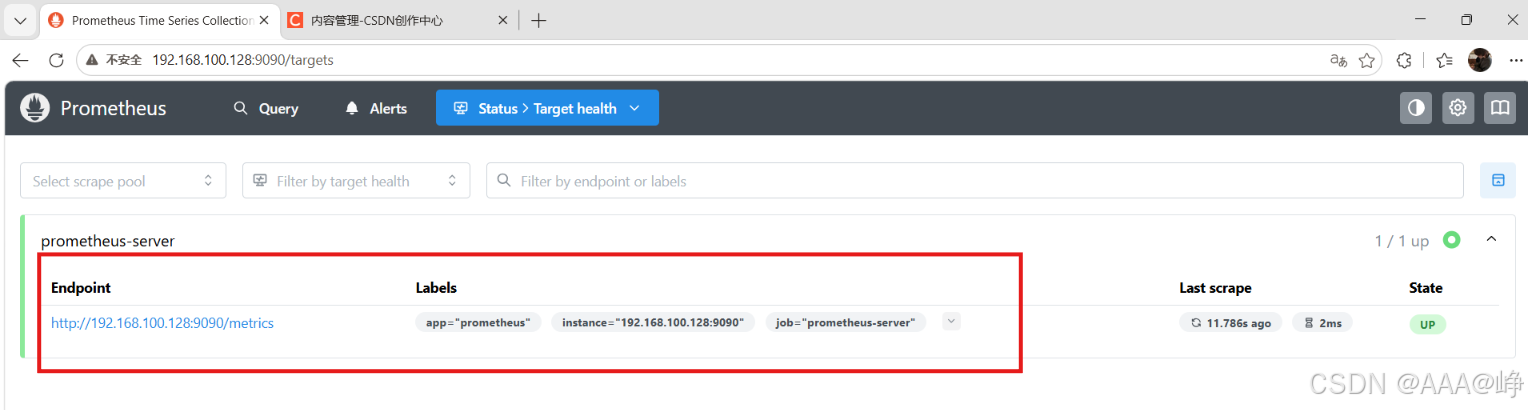
点击metrics查看指标数据
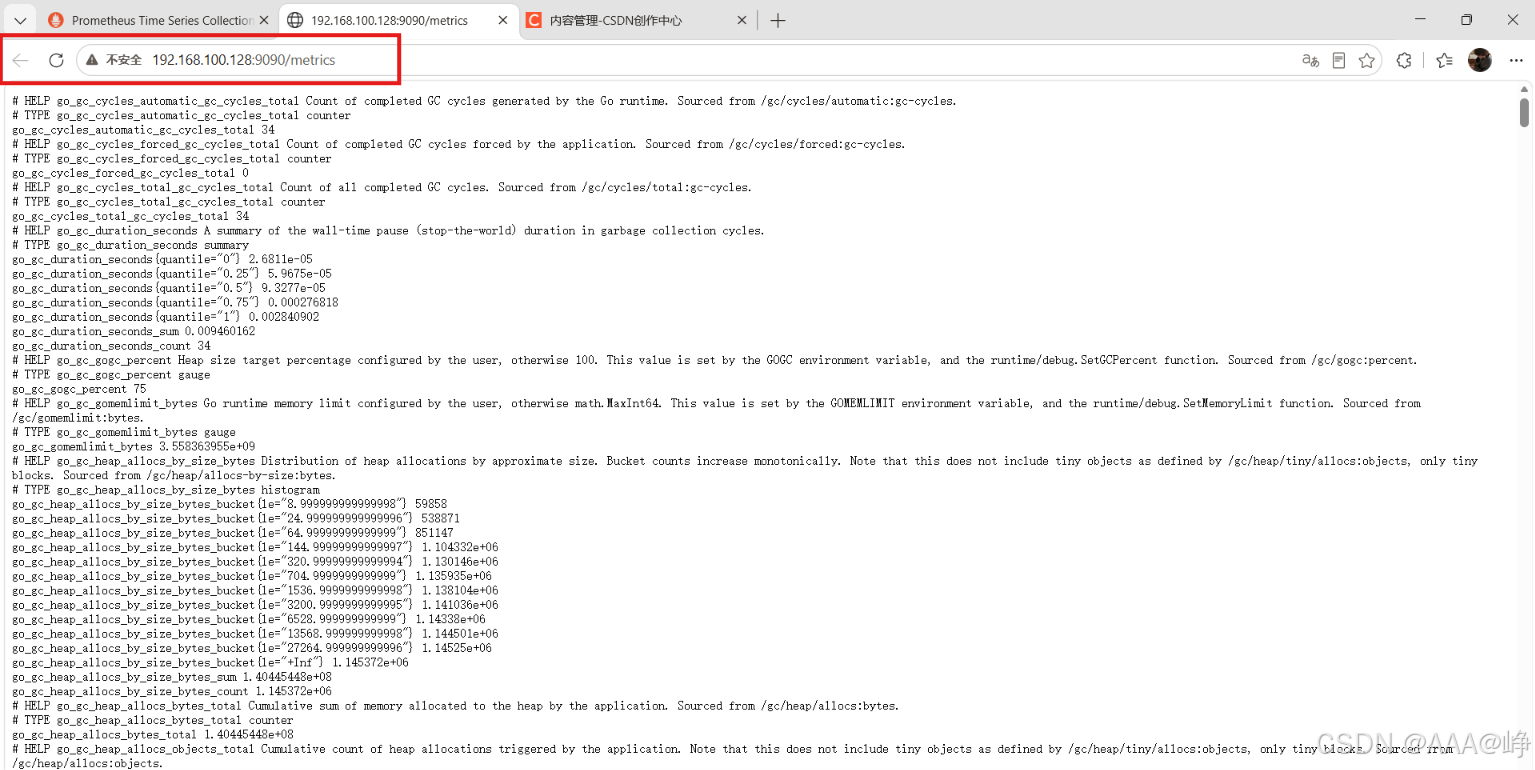
Prometheus监控主机
下载监控主机源码包
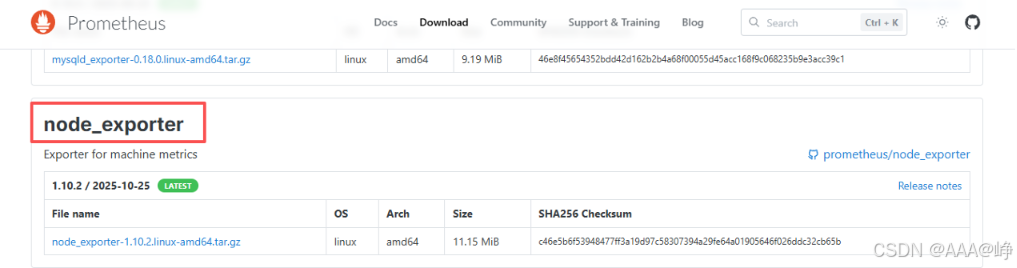
bash
[root@prometheus-server ~]# wget https://github.com/prometheus/node_exporter/releases/download/v1.10.2/node_exporter-1.10.2.linux-amd64.tar.gz1:使用exporter监控本地节点
bash
[root@prometheus-server ~]# tar zxvf node_exporter-1.10.2.linux-amd64.tar.gz
node_exporter-1.10.2.linux-amd64/
node_exporter-1.10.2.linux-amd64/node_exporter
node_exporter-1.10.2.linux-amd64/LICENSE
node_exporter-1.10.2.linux-amd64/NOTICE
[root@prometheus-server ~]# mv node_exporter-1.10.2.linux-amd64 /usr/local/src/node_exporter
[root@prometheus-server ~]# cd /usr/local/src/node_exporter/
[root@prometheus-server node_exporter]# ls
LICENSE  node_exporter  NOTICE
添加service文件
bash
[root@prometheus-server ~]# vim /usr/lib/systemd/system/node_exporter.service
[Service]
ExecStart=/usr/local/src/node_exporter/node_exporter

[Install]
WantedBy=multi-user.target

[Unit]
Description=node_exporter
After=network.target
启动服务
bash
[root@prometheus-server ~]# systemctl daemon-reload
[root@prometheus-server ~]# systemctl enable node_exporter.service --now
Created symlink from /etc/systemd/system/multi-user.target.wants/node_exporter.service to /usr/lib/systemd/system/node_exporter.service.
[root@prometheus-server ~]# systemctl status node_exporter.service
● node_exporter.service - node_exporter
   Loaded: loaded (/usr/lib/systemd/system/node_exporter.service; enabled; vendor preset: disabled)
   Active: active (running) since 一 2026-08-31 21:59:32 CST; 6s ago
 Main PID: 6739 (node_exporter)
    Tasks: 4
   Memory: 5.0M
   CGroup: /system.slice/node_exporter.service
           └─6739 /usr/local/src/node_exporter/node_exporter
修改Prometheus配置文件,增加监控配置项
bash
[root@prometheus-server ~]# vim /usr/local/src/prometheus/prometheus.yml
....末尾添加
 - job_name: "node_exporter_prometheus-server"   #名称

    # metrics_path defaults to '/metrics'
    # scheme defaults to 'http'.

    static_configs:
      - targets: ["192.168.100.128:9100"]  #端口9100
重启Prometheus服务
bash
[root@prometheus-server ~]# systemctl restart prometheus.service打开页面查看target监控到目标
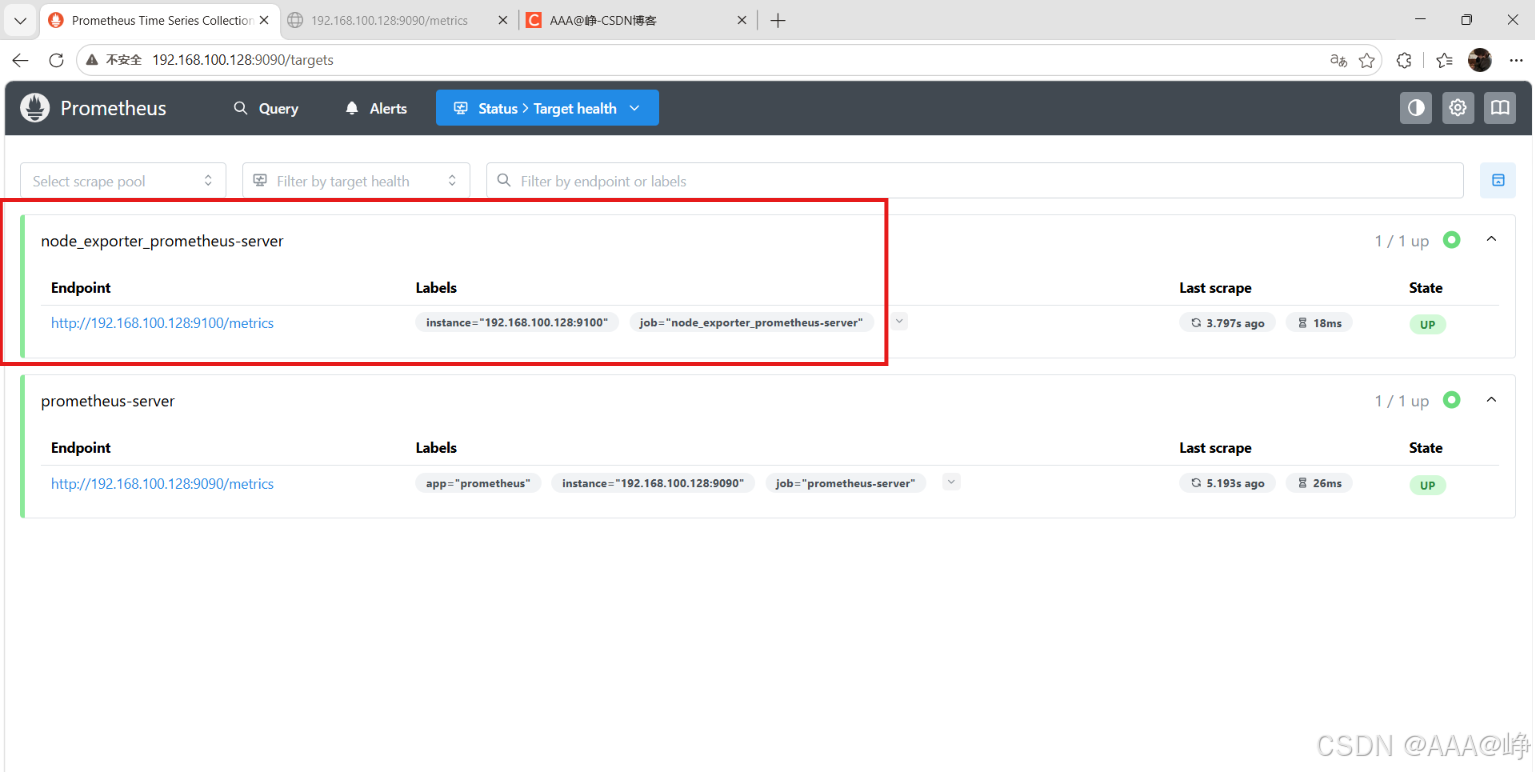
2:使用exporter监控其他节点
关闭防火墙及selinux
bash
[root@prometheus-agent ~]# systemctl disable firewalld.service --now
[root@prometheus-agent ~]# setenforce 0
解压软件包
bash
[root@prometheus-agent ~]# wget https://github.com/prometheus/node_exporter/releases/download/v1.10.2/node_exporter-1.10.2.linux-amd64.tar.gz
[root@prometheus-agent ~]# tar zxvf node_exporter-1.10.2.linux-amd64.tar.gz
node_exporter-1.10.2.linux-amd64/
node_exporter-1.10.2.linux-amd64/node_exporter
node_exporter-1.10.2.linux-amd64/LICENSE
node_exporter-1.10.2.linux-amd64/NOTICE
[root@prometheus-agent ~]# mv node_exporter-1.10.2.linux-amd64 /usr/local/src/node_exporter
添加service文件
bash
[root@localhost ~]# vim /usr/lib/systemd/system/node_exporter.service
[Service]
ExecStart=/usr/local/src/node_exporter/node_exporter

[Install]
WantedBy=multi-user.target

[Unit]
Description=node_exporter
After=network.target
重启服务
bash
[root@prometheus-agent ~]# systemctl daemon-reload
[root@prometheus-agent ~]# systemctl enable node_exporter.service --now
Created symlink from /etc/systemd/system/multi-user.target.wants/node_exporter.service to /usr/lib/systemd/system/node_exporter.service.
[root@prometheus-agent ~]# systemctl status node_exporter.service
● node_exporter.service - node_exporter
   Loaded: loaded (/usr/lib/systemd/system/node_exporter.service; enabled; vendor preset: disabled)
   Active: active (running) since 一 2026-08-31 23:23:09 CST; 5s ago
 Main PID: 30985 (node_exporter)
    Tasks: 4
   Memory: 4.9M
   CGroup: /system.slice/node_exporter.service
           └─30985 /usr/local/src/node_exporter/node_exporter
回到Prometheus-server服务上添加配置
bash
[root@prometheus-server ~]# vim /usr/local/src/prometheus/prometheus.yml
...末尾添加
  - job_name: "node_exporter_agent"

    # metrics_path defaults to '/metrics'
    # scheme defaults to 'http'.

    static_configs:
      - targets: ["192.168.100.129:9100"]
重启Prometheus服务
bash
[root@prometheus-server ~]# systemctl restart prometheus.service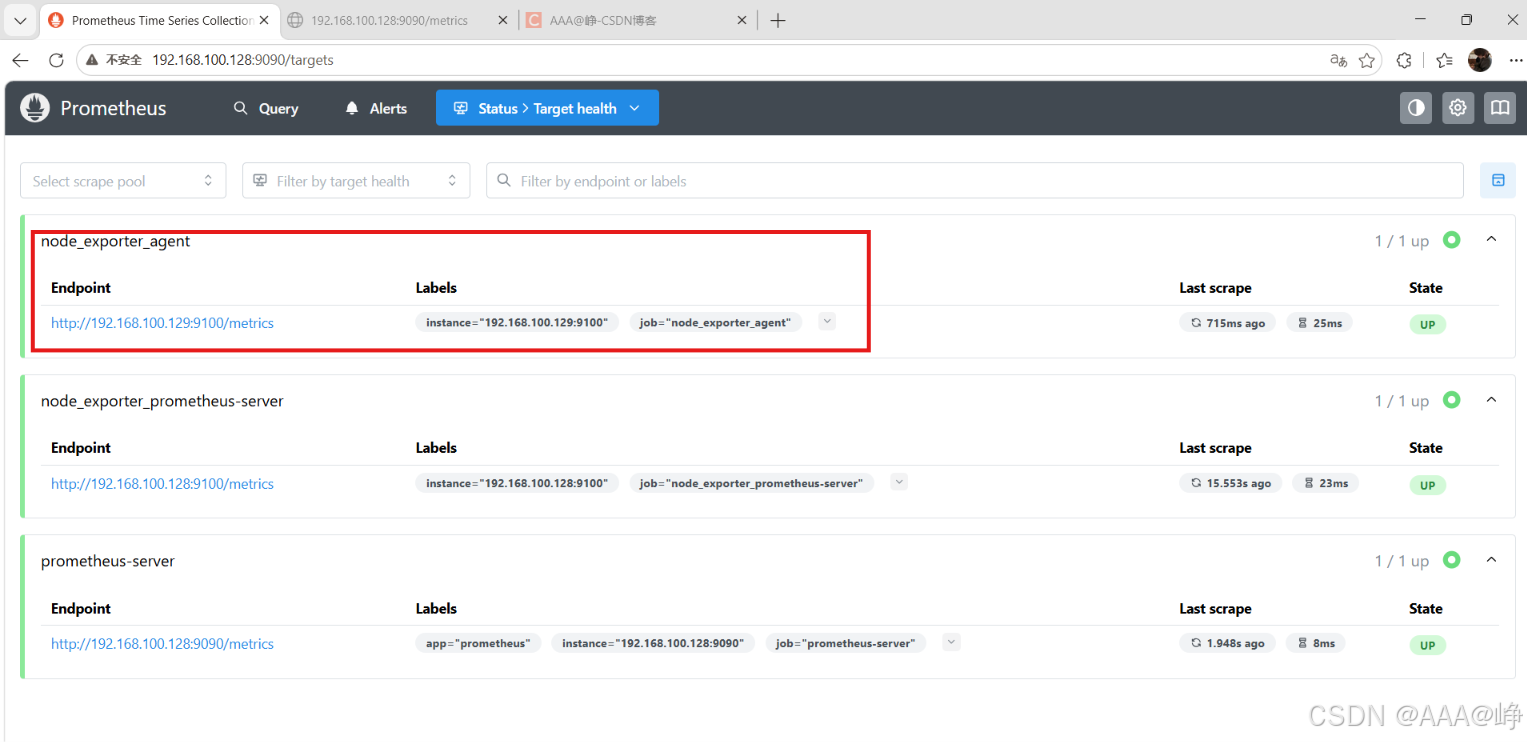
Grafana展现数据
grafana介绍
Grafana 是一个开源的可视化和监控工具,能把各种数据源(比如 Prometheus、InfluxDB、MySQL)的指标和日志,统一展示在酷炫的仪表盘上,特别适合监控系统状态和分析业务数据。
核心功能
- 数据统一 :不用把数据都导入一个地方,它能直接连上现有数据源,比如云服务、数据库甚至 Google Sheets,统一可视化。
- 灵活仪表盘 :支持多种图表类型(折线图、热力图等),还能自定义查询和告警,团队协作和分享也方便。
- 多数据源支持 :兼容 Prometheus、MySQL、Elasticsearch 等主流数据源。

软件包下载
选择downloads

点击开始使用Grafana,进入下载页面

选择开源下载进入页面后,选择最新版本,开源OSS,Linux系统
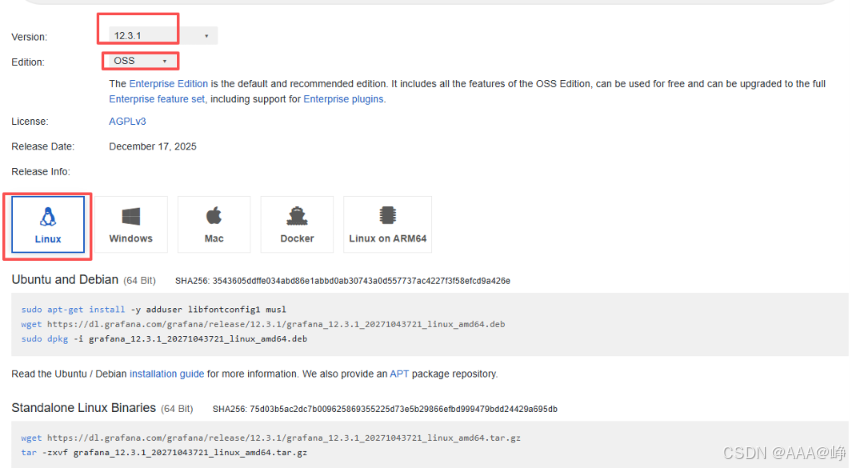
开启新节点进行部署,注意关闭防火墙
bash
[root@prometheus-agent ~]# tar zxvf grafana_12.3.1_20271043721_linux_amd64.tar.gz启动服务
bash
[root@prometheus-agent ~]# nohup /usr/local/src/grafana/bin/grafana-server --config=/usr/local/src/grafana/conf/defaults.ini--homepath=/usr/local/src/grafana &
[1] 35006
[root@prometheus-agent ~]# nohup: 忽略输入并把输出追加到"nohup.out"

[root@prometheus-agent ~]# ps -ef | grep grafana
root      35006  28741 99 23:47 pts/0    00:00:07 grafana server --config=/usr/local/src/grafana/conf/defaults.ini --homepath=/usr/local/src/grafana
root      35037  28741  0 23:47 pts/0    00:00:00 grep --color=auto grafana
查看3000端口
bash
[root@prometheus-agent ~]# ss -anput | grep "3000"
tcp    LISTEN     0      128    [::]:3000               [::]:*                   users:(("grafana",pid=35006,fd=15))
使用systemd启动
bash
[root@prometheus-agent ~]# vim /usr/lib/systemd/system/grafana.service
[Service]
ExecStart=/usr/local/src/grafana/bin/grafana-server --config=/usr/local/src/grafana/conf/defaults.ini --homepath=/usr/local/src/grafana

[Install]
WantedBy=multi-user.target

[Unit]
Description=grafana
After=network.target
bash
[root@prometheus-agent ~]# systemctl daemon-reload
[root@prometheus-agent ~]# systemctl enable grafana.service --now
Created symlink from /etc/systemd/system/multi-user.target.wants/grafana.service to /usr/lib/systemd/system/grafana.service.
[root@prometheus-agent ~]# systemctl status grafana.service
● grafana.service - grafana
   Loaded: loaded (/usr/lib/systemd/system/grafana.service; enabled; vendor preset: disabled)
   Active: active (running) since 一 2026-08-31 23:50:38 CST; 5s ago
 Main PID: 35627 (grafana)
    Tasks: 9
   Memory: 84.8M
   CGroup: /system.slice/grafana.service
└─35627 grafana server --config=/usr/local/src/grafana/conf/defaults.ini --homepath=/usr/local/src/grafana访问网站:http://192.168.100.129:3000
用户名:admin,密码:admin

跳过重置密码

进入首页
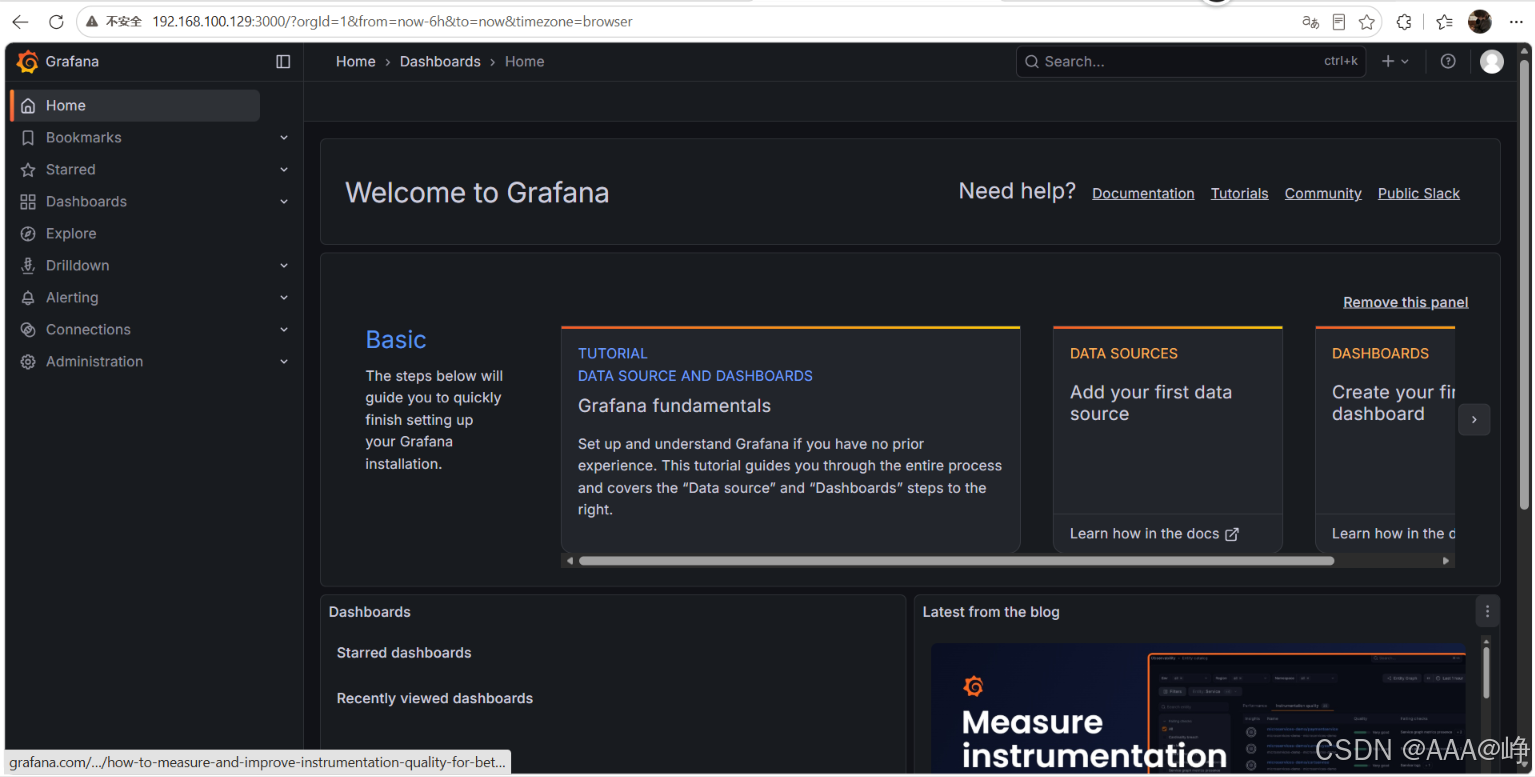
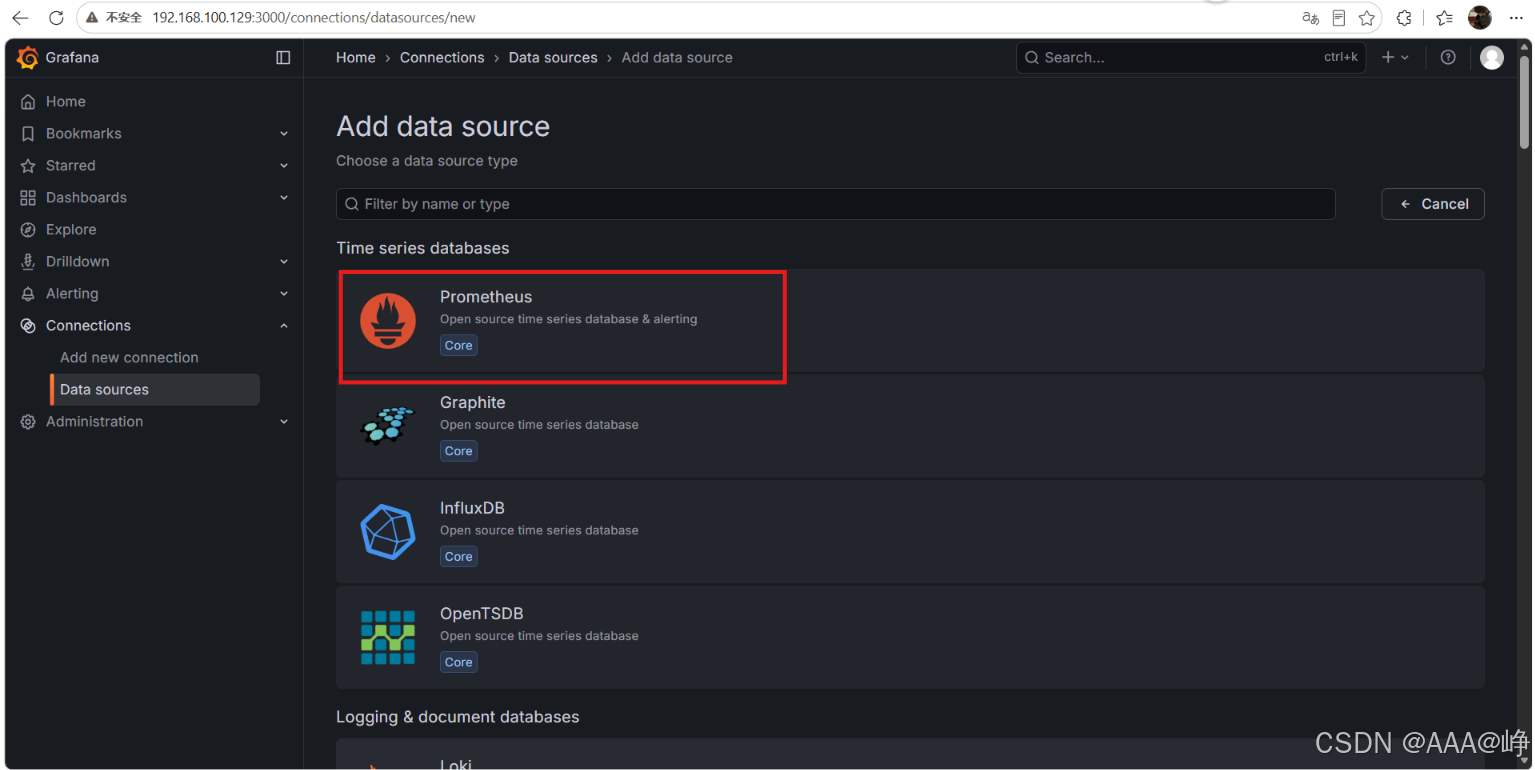
添加数据源
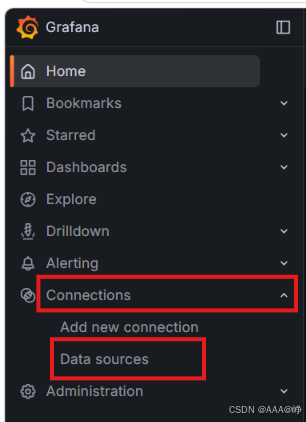
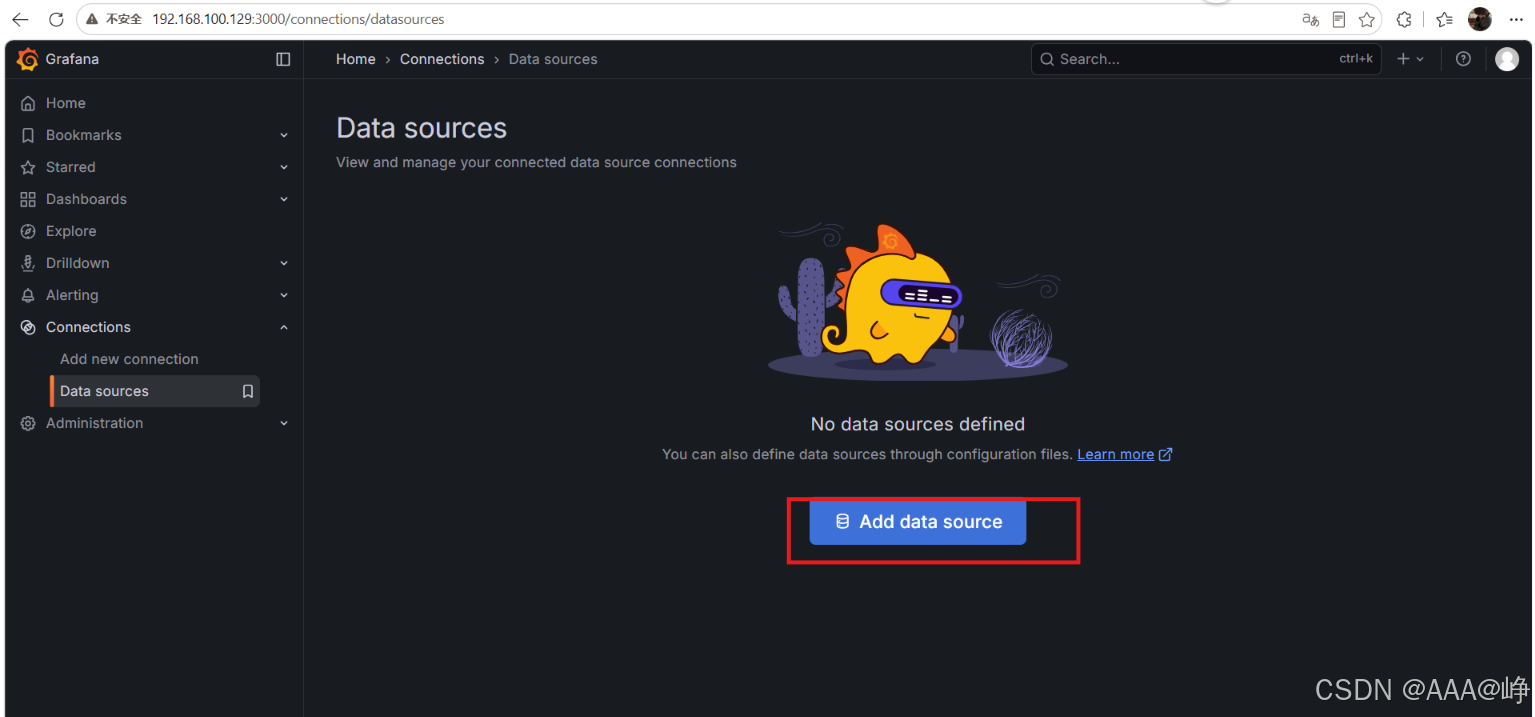
选择prometheus数据源
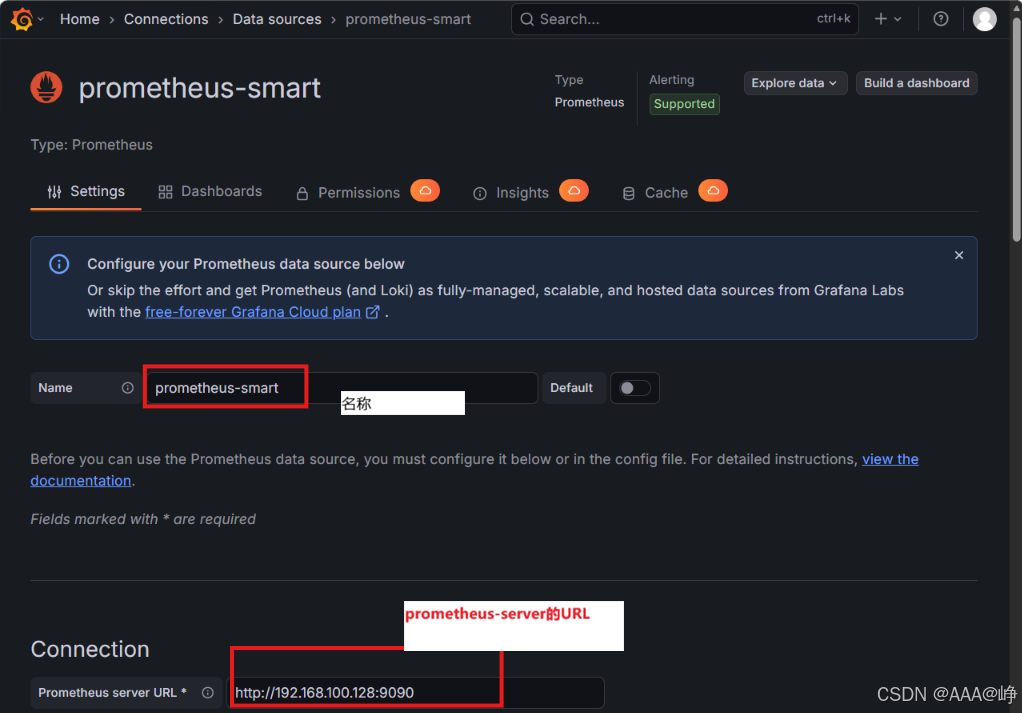
添加连接prometheus-server
点击测试,完成通过
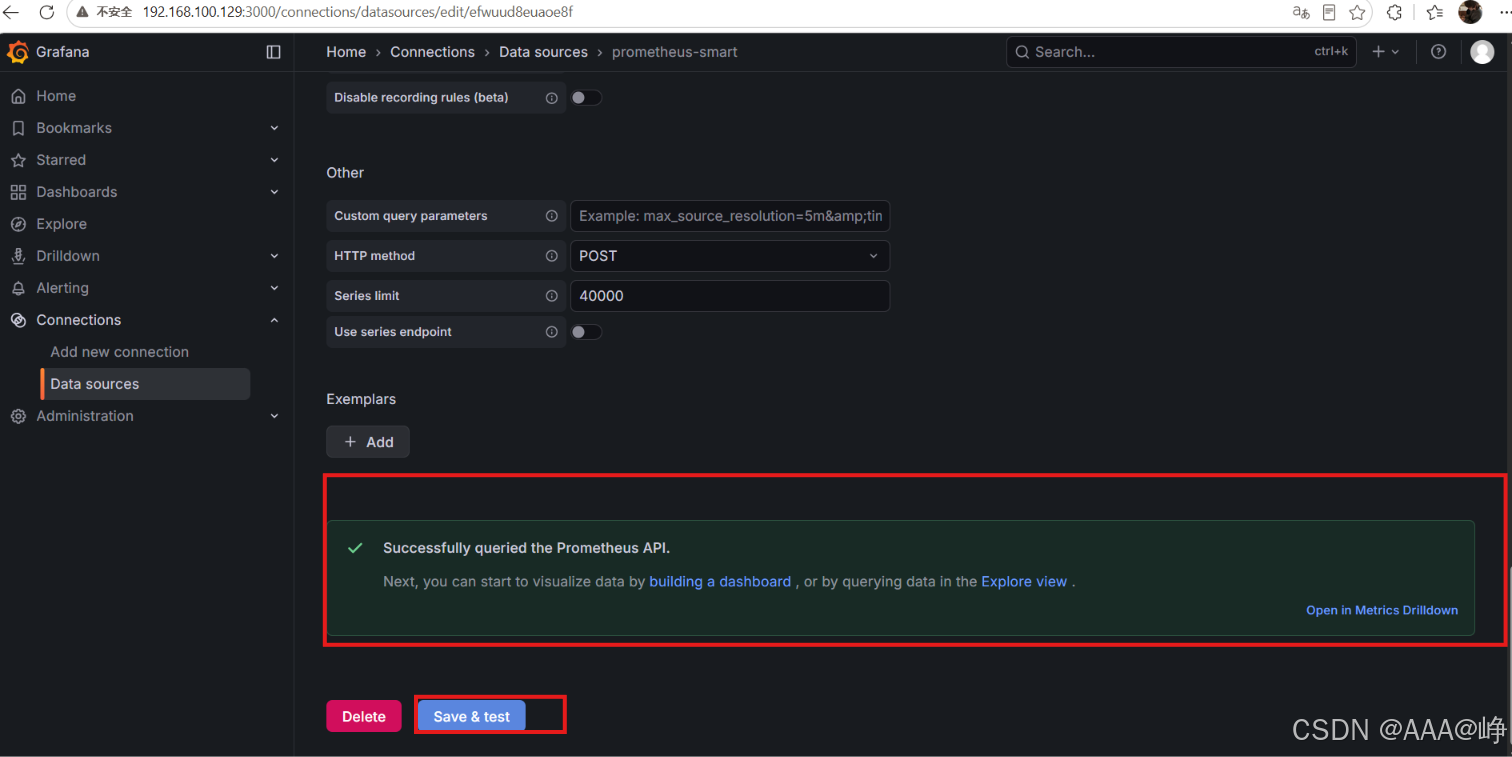
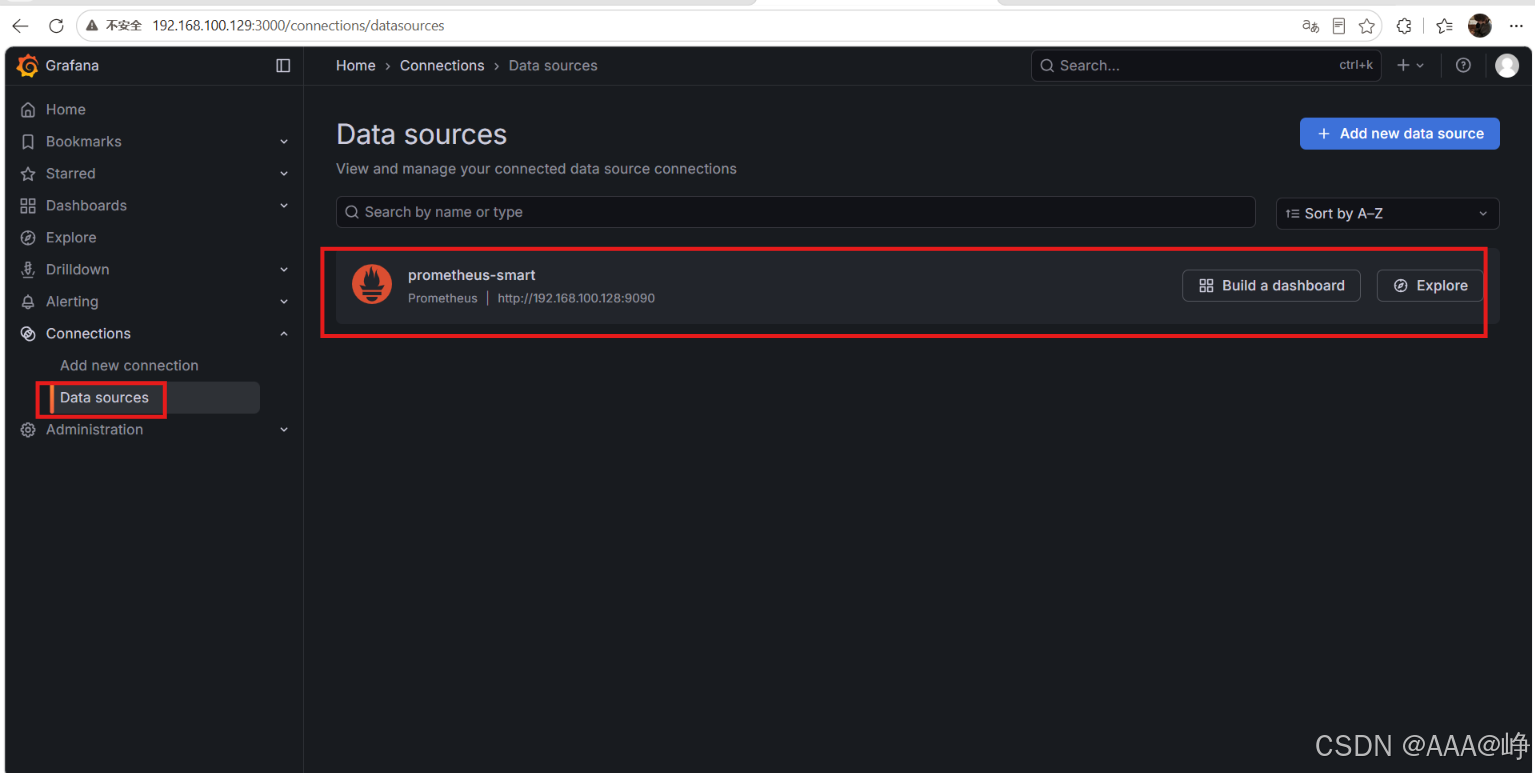
点击,save保存,然后再点击Data sources
添加仪表盘
官网地址:https://grafana.com/grafana/dashboards/
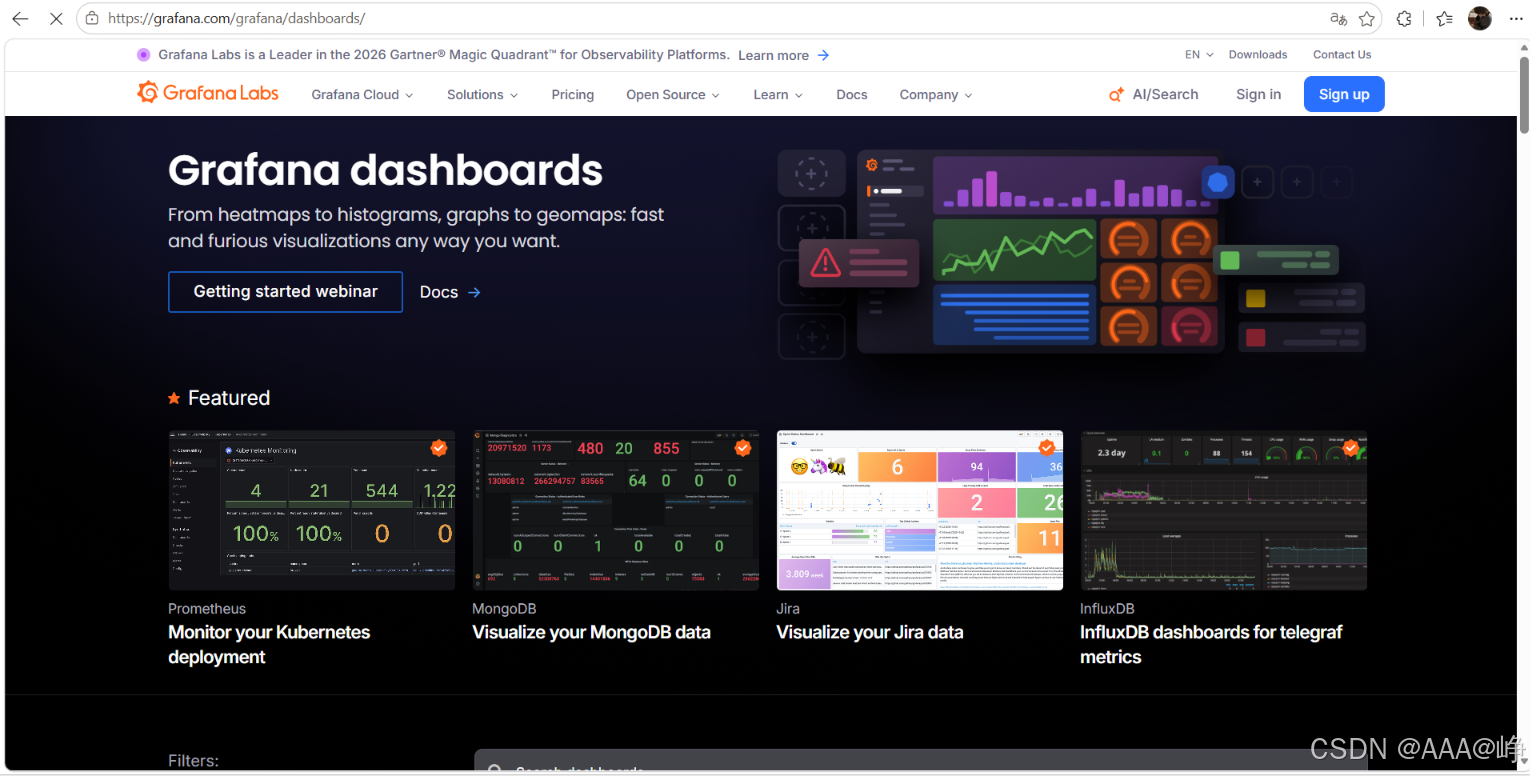
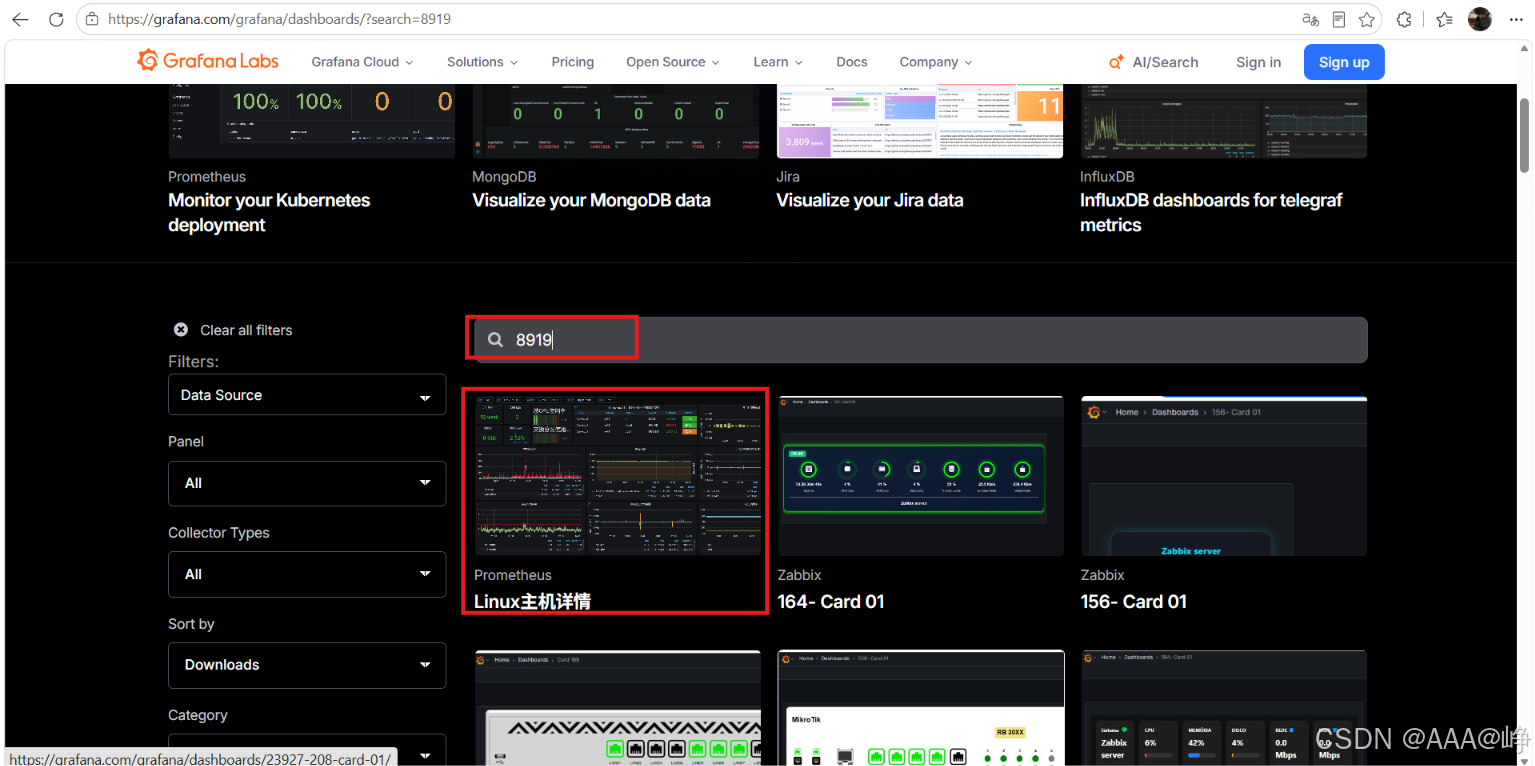
选择对主机进行监控的仪表盘,输入8919
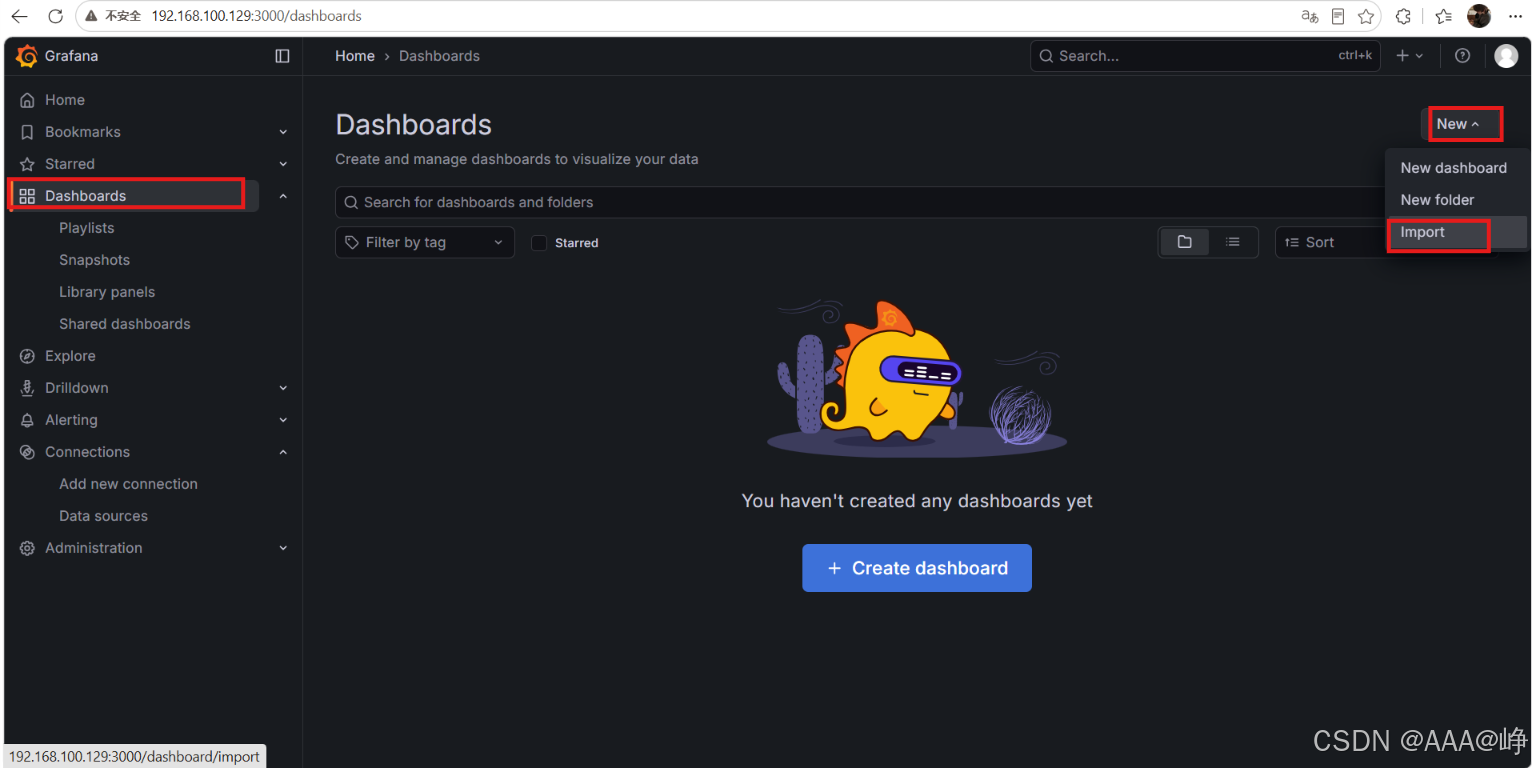
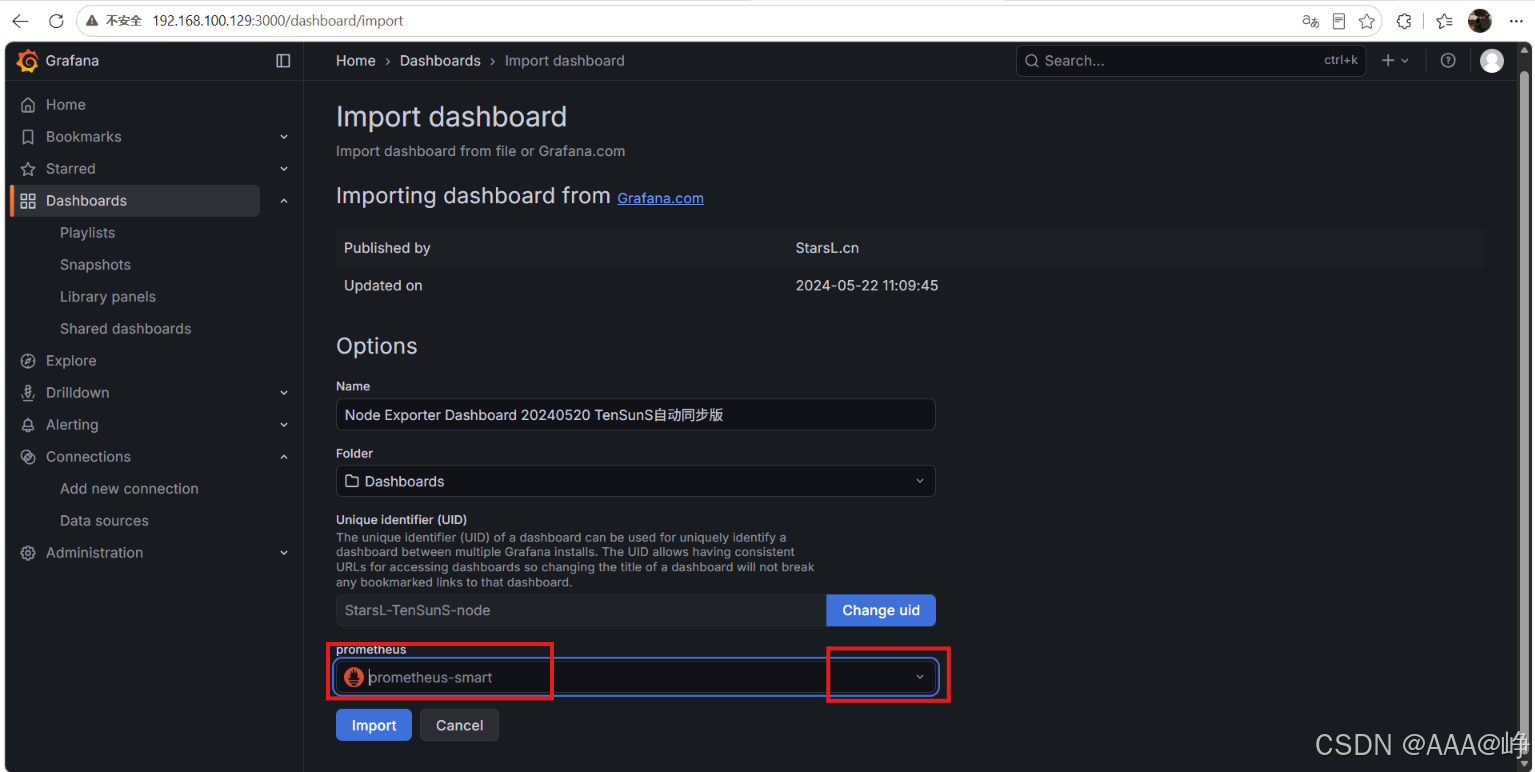
回到grafana网页界面,点击dashboards->new->import
输入8919,点击load加载
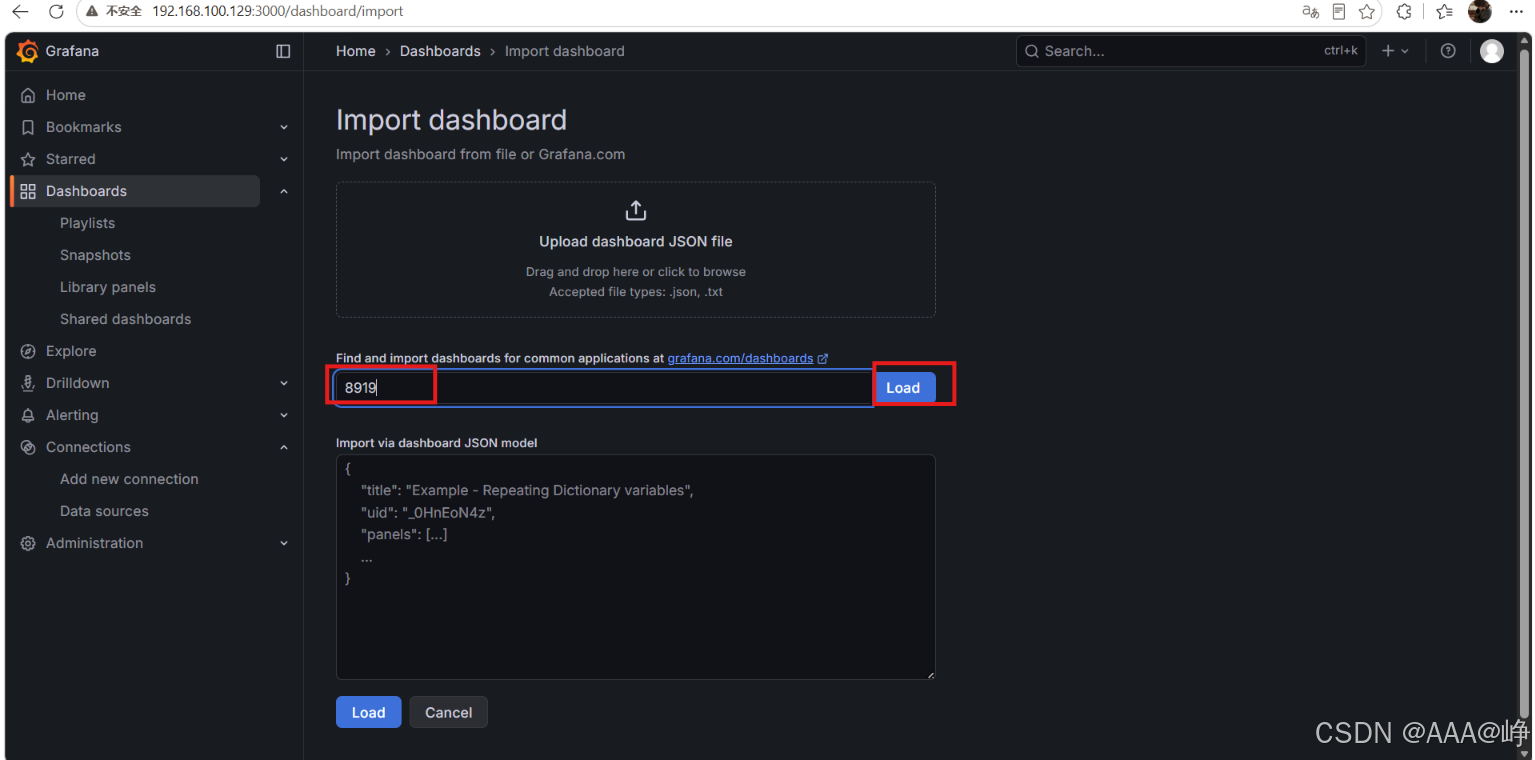
选择之前添加的prometheus数据源,点击import
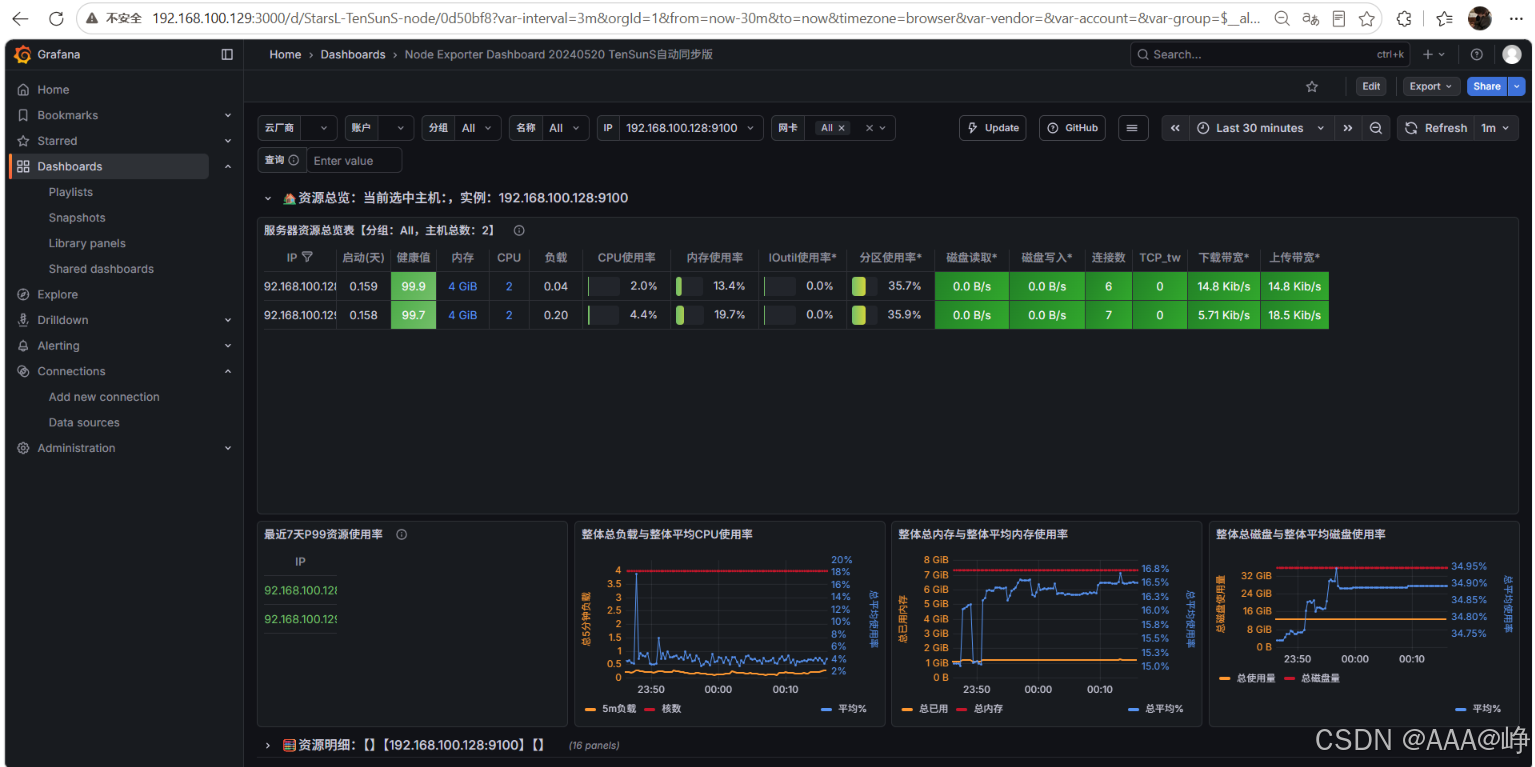
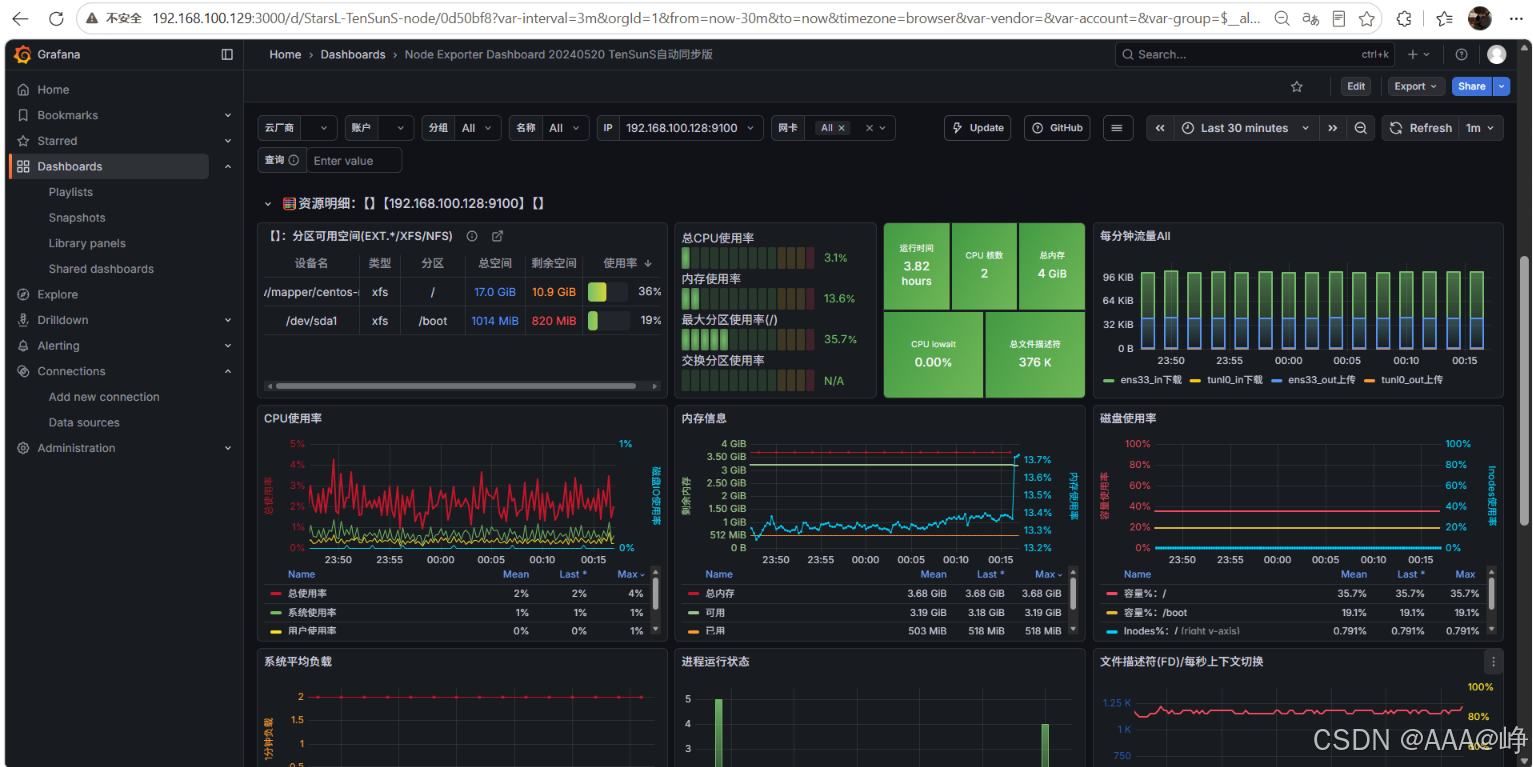
可以看到主机状态