echarts实现下图样式
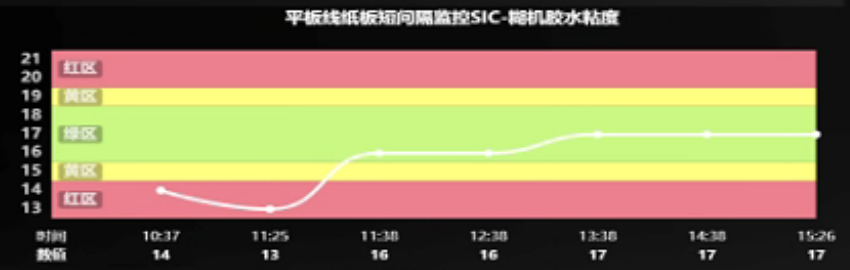
javascript
// 折线图公共配置:x 轴两行(下行数值、上行时间),y 轴按 axis 传入的口径分色块
    buildDieLineOption(title, seriesName, times, values, axis) {
      times = times || [];
      values = values || [];
      axis = axis || DIE_LINE_AXIS.huViscosity;
      const zones = axis.zones || [];
      // 分区边界值归上一档,绘制时色块整体左移半格、最高一档向上补满半格,
      // 否则整数刻度正好压在色块交界上,数字看不出归哪个分区
      const bands = zones.map(function(zone) {
        return {
          from: zone.from - 0.5,
          to: zone.to === axis.max ? zone.to + 0.5 : zone.to - 0.5,
          color: zone.color,
          label: zone.label
        };
      });
      // 色块内数值标注的刻度序列
      const pTicks = [];
      for (let v = axis.min; v <= axis.max + 1e-9; v += axis.valueInterval) {
        pTicks.push(Math.round(v * 1000) / 1000);
      }
      // 首格留白不画曲线,折线起点落在「红区/黄区」标题右侧
      const hasData = values.length > 0;
      const axisLead = hasData ? [''] : [];
      const lineValues = hasData ? [null].concat(values) : [];
      // 分区名画在色块左端、与左侧数值列对齐;放色块正中会被曲线压住
      const zoneMarks = times.length ? bands.map(function(band) {
        return [0, (band.from + band.to) / 2, band.label];
      }) : [];
      const tooltipFormatter = function(params) {
        // 折线数据比类目多一个前置占位格,tooltip 取值要退回一格
        var idx = params[0].dataIndex - 1;
        var val = params[0].value;
        return '时间:' + times[idx] + '<br/>数值:' + val;
      };
      return {
        backgroundColor: 'rgba(0,0,0,0)',
        title: {
          text: title,
          left: 'center',
          top: 0,
          textStyle: {
            color: '#ffffff',
            fontSize: 10,
            fontWeight: 'bold'
          }
        },
        tooltip: {
          trigger: 'axis',
          backgroundColor: 'rgba(0,0,0,0.8)',
          borderColor: '#fff',
          textStyle: { color: '#fff', fontSize: 12 },
          formatter: tooltipFormatter
        },
        grid: {
          // 左侧留出数值刻度的文字宽度,色块随之向左铺开
          left: 20,
          right: 40,
          top: 30,
          bottom: 8,
          containLabel: true
        },
        legend: { show: false },
        xAxis: [
          {
            // 第一行(下方,offset=12)------ 数值
            type: 'category',
            data: axisLead.concat(values),
            boundaryGap: false,
            position: 'bottom',
            offset: 12,
            axisLine: { show: false },
            axisTick: { show: false },
            axisLabel: {
              color: '#fff',
              fontSize: 8,
              fontWeight: 'bold',
              showMinLabel: true,
              showMaxLabel: true,
              // 首格占位后类目变窄,自动采样会把时间标签抽稀,固定每格都出
              interval: 0,
              formatter: function(v, idx) {
                return hasData && idx === 0 ? '数值' : v;
              }
            },
            splitLine: { show: false }
          },
          {
            // 第二行(上方,offset=0)------ 时间
            type: 'category',
            data: axisLead.concat(times),
            boundaryGap: false,
            position: 'bottom',
            offset: 0,
            axisLine: { show: false },
            axisTick: { show: false },
            axisLabel: {
              color: '#fff',
              fontSize: 8,
              showMinLabel: true,
              showMaxLabel: true,
              // 首格占位后类目变窄,自动采样会把时间标签抽稀,固定每格都出
              interval: 0,
              formatter: function(v, idx) {
                return hasData && idx === 0 ? '时间' : v;
              }
            },
            splitLine: { show: false }
          }
        ],
        yAxis: [
          {
            // 区域轴:只出红/黄/绿分区名,数值刻度走色块内标注
            type: 'value',
            // 上下各留半格,最低/最高一档色块才完整,整数刻度都落在色块正中
            min: axis.min - 0.5,
            max: axis.max + 0.5,
            interval: axis.outerInterval,
            position: 'left',
            offset: 0,
            axisLine: { show: false },
            axisTick: { show: false },
            // 分区名画在色块上,轴侧不再出字
            axisLabel: { show: false },
            splitLine: { show: false },
            nameTextStyle: { color: '#fff', fontSize: 8 }
          }
        ],
        series: [
          {
            name: seriesName,
            type: 'line',
            data: lineValues,
            smooth: true,
            symbol: 'circle',
            symbolSize: 3,
            lineStyle: {
              color: '#D8051D',
              width: 2
            },
            itemStyle: {
              color: '#D8051D',
              borderColor: '#D8051D',
              borderWidth: 2
            },
            markArea: {
              silent: true,
              itemStyle: { opacity: 1 },
              data: bands.map(function(band) {
                return [{ yAxis: band.from, itemStyle: { color: band.color } }, { yAxis: band.to }];
              })
            }
          },
          {
            // 数值刻度压在分区色块上:放轴外看不出它归哪个分区
            name: 'P值刻度',
            type: 'scatter',
            data: pTicks.map(function(v) { return [0, v]; }),
            symbol: 'circle',
            symbolSize: 1,
            itemStyle: { color: 'transparent' },
            silent: true,
            z: 10,
            tooltip: { show: false },
            label: {
              show: true,
              // 写在网格左外侧:贴网格左缘会与折线起点叠在一起
              position: 'left',
              distance: 5,
              color: '#ffffff',
              fontSize: 9,
              fontWeight: 'bold',
              formatter: function(p) { return p.value[1]; }
            }
          },
          {
            // 分区名压在色块上,代替原来轴侧的文字
            name: '分区',
            type: 'scatter',
            data: zoneMarks,
            symbol: 'circle',
            symbolSize: 1,
            itemStyle: { color: 'transparent' },
            silent: true,
            z: 10,
            tooltip: { show: false },
            label: {
              show: true,
              position: 'right',
              distance: 3,
              color: '#ffffff',
              fontSize: 9,
              fontWeight: 'bold',
              // 曲线起点偶尔会压到分区名,留底衬保证可读
              backgroundColor: 'rgba(0,0,0,0.35)',
              padding: [1, 3],
              borderRadius: 2,
              formatter: function(p) { return p.value[2]; }
            }
          }
        ]
      };
    }
javascript
// 折线图模拟数据(真实接口未接通或需要回退展示时使用)
const DIE_LINE_MOCK_TIMES = ['07:35', '08:54', '12:40', '13:45', '14:45', '16:41', '18:45', '19:45'];
const DIE_LINE_MOCK_VALUES = [16, 17, 18, 19, 13, 15, 19, 18];
const DIE_LINE_MOCK_VALUES_TEMP = [56, 57.5, 54, 50.5, 51.5, 55, 53.5, 57.5];

// 折线图 y 轴口径:糊机/瓦机 × 粘度/糊化温度,四张图各自独立
// zones 的 from/to 是业务边界值(不是绘图坐标),边界值归上一档:14 属「14~15」黄区,故绘图时色块整体左移半格
const DIE_LINE_AXIS = {
  // 糊机胶水粘度
  huViscosity: {
     min: 13,
     max: 21,
     outerInterval: 0.5,
     valueInterval: 1,
     zones: [
       { from: 20, to: 21, color: '#EC808D', label: '红区' },
       { from: 19, to: 20, color: '#FFFF80', label: '黄区' },
       { from: 16, to: 19, color: '#CAF982', label: '绿区' },
       { from: 15, to: 16, color: '#FFFF80', label: '黄区' },
       { from: 13, to: 15, color: '#EC808D', label: '红区' }
     ]
   },
   // 糊机胶水糊化温度
   huGelatinize: {
     min: 54,
     max: 62,
     outerInterval: 0.5,
     valueInterval: 1,
     zones: [
       { from: 61, to: 62, color: '#EC808D', label: '红区' },
       { from: 60, to: 61, color: '#FFFF80', label: '黄区' },
       { from: 57, to: 60, color: '#CAF982', label: '绿区' },
       { from: 56, to: 57, color: '#FFFF80', label: '黄区' },
       { from: 54, to: 56, color: '#EC808D', label: '红区' }
     ]
   },
   // 瓦机胶水粘度
   waViscosity: {
     min: 11,
     max: 19,
     outerInterval: 0.5,
     valueInterval: 1,
     zones: [
       { from: 18, to: 19, color: '#EC808D', label: '红区' },
       { from: 17, to: 18, color: '#FFFF80', label: '黄区' },
       { from: 14, to: 17, color: '#CAF982', label: '绿区' },
       { from: 13, to: 14, color: '#FFFF80', label: '黄区' },
       { from: 11, to: 13, color: '#EC808D', label: '红区' }
     ]
   },
   // 瓦机胶水糊化温度
   waGelatinize: {
     min: 50,
     max: 58,
     outerInterval: 0.5,
     valueInterval: 1,
     zones: [
       { from: 57, to: 58, color: '#EC808D', label: '红区' },
       { from: 56, to: 57, color: '#FFFF80', label: '黄区' },
       { from: 53, to: 56, color: '#CAF982', label: '绿区' },
       { from: 52, to: 53, color: '#FFFF80', label: '黄区' },
       { from: 50, to: 52, color: '#EC808D', label: '红区' }
     ]
   }
 };