一张工单、六个窗口,和贴在 goroutine 背上的标签
你大概抓过 pprof 文件,但未必留意过它是怎么被「打印」出来的:pprof.Lookup("heap").WriteTo(w, 0) 这一行背后,究竟是谁在查表、谁在去重、谁把业务标签塞进样本?
这篇文章从 go1.24.0 的 pprof.go 第 1~575 行、label.go 与 runtime.go 出发,顺着源码讲清一个看起来很绕的问题:为什么一个只有五个字段的结构,能同时伺候六种内置剖析和你自己开的窗口;以及业务里那句 pprof.Labels("route", "/api/users"),是怎么一路跑到火焰图里的。
读法上先说好三件事:代码块右侧的 // ← 是逐行注释,行号都是 go1.24.0 的实际行号;每一节先给一张数据流画面,再上源码,最后回答「为什么非得这么写」;文中 §2.4 这类写法只是本文自己的小节号 (第 2 节第 4 小节),「难点 A~H」是八个最容易卡住的问题的代号,每一个都做成带问题标题的小节、挂在讲它的那一节末尾------按名字找就行,不需要对照任何别的资料。
本文会讲什么
文章按源码从上往下走,但可以记成四条线索:
- 柜台 :一张
Profile工单、六个内置窗口,以及 CPU 为什么偏偏不在窗口里(§1~§3) - 两条路:内置转包、自定义自己记账,最后汇进同一个打印漏斗(§4~§5)
- 标签 :从
pprof.Do到g.labels,再钻进每一条 sample(§6~§8) - 收束:八条不变量、八个易错点、一张五分钟复述卡(§9~§11)
卡住时翻「黑话速查表」(§0.4)或「行号对照表」(§0.5);想快速复习,直接翻「一页纸速查」(§9)和「五分钟复述卡」(§11)。
0 导读:先把画面立起来
0.1 先说结论:一句话、三句话、先给你半句答案
一句话 整个用户可见层,其实只是「抄账员」的柜台:对外只有
Profile这一种工单,工单上写着「名字 + 去哪数条数 + 去哪写文件」;六个内置窗口把活儿全转包给 runtime,自定义窗口自己拿一张 map 记账;而 labels 是夹在账本里的纸条,顺着 context 一路贴到 goroutine 头上,最后被写进每一个样本。
拆成三句话:
- 柜台只有一张工单 :
Profile结构就五个字段,count和write两个函数指针是分水岭------有值就是「内置窗口,转包给 runtime」,为 nil 就是「自定义窗口,自己用 map 记」。所有那些看着绕的分支,根源都在这一条。 - 打印只有一套框架 :不管数据来自 goroutine、threadcreate 还是你自己的 map,最后都塞进
countProfile这个三方法接口,交给printCountProfile按「栈 + 标签」指纹去重、排序,再分debug>0文本和debug=0protobuf 两条出口。 - 标签不跟着采样走,跟着人走 :labels 不靠「每次采样去读 ctx」,而是
pprof.Do把合并好的标签一次性写到当前 goroutine 的g.labels上;采样时顺手把这个指针当 tag 抄走。所以子 goroutine 会自动继承,业务代码也不用改。
读到这里,你可能会冒出下面几个疑问。别急着弄懂------先把每问的半句答案摆在这儿,知道后面要解开什么就够了;每一问在后文都有同名的小标题,会把它拆开讲透。
| 你可能会问 | 先给你半句答案 |
|---|---|
| 六个内置 Profile 的「三元组」是什么?CPU 为什么不在其中? | 三元组就是「叫什么 + 去哪数条数 + 去哪写文件」;CPU 是持续输出的数据流,不属于「抓一次快照就完事」的窗口 |
| heap 和 allocs 明明是两个名字,为什么说「同一份数据」? | 两者共用同一个 countHeap,读的是同一批分配记录,只是默认让你看的那一列不同(现在还占着多少 / 一共分配过多少) |
为什么一个 Profile 结构能同时伺候内置和自定义两条完全不同的路? |
分水岭是 count / write 两个函数指针:有值就转包给 runtime,为空就自己拿一张 map 记账 |
忘写 Remove 为什么就等于一张「泄漏清单」?Add 里那个 32 是什么? |
登记过却不注销的资源会永远留在表里,打印时自然成了一份泄漏清单;32 是一次最多记录 32 层调用栈 |
printCountProfile 靠什么把异构数据统一起来、又靠什么保证每次输出都一样? |
统一靠「Len / Stack / Label 三招」这个接口,稳定靠按「栈 + 标签」指纹去重,再按次数降序、平手按字典序排序 |
pprof.Do 那行 defer 为什么必须放在 WithLabels 前面? |
defer 在写下的那一刻就把参数定死了;放在合并标签之前,它记住的才是「原来的标签」,函数返回时才还原得回去 |
标签从 Labels("route", "/api/users") 到 pprof 文件里的 sample,中间经过哪些函数? |
WithLabels 合并 → SetGoroutineLabels 写进 g.labels → 采样时把这个指针当 tag 抄走 → 打印时由 pbLabel 写进样本 |
| 包文档说「只有 CPU 和 goroutine 剖析消费 labels」,缺的那一环是什么? | heap / block / mutex 的数据流里,缺的是「把 g.labels 当 tag 抄进记录」这一步,链条在 runtime 侧就断了 |
关于「难点 A~H」 :它们不是另附的习题,就是后文八个小节的标题,例如「难点 D|32 帧、skip+1 与『泄漏清单』」。上面每一问都能按标题直接找到;
§2.4也只是本文的小节号,翻到那一节即可。
0.2 站在流水线的哪一段:柜台与抄账员
先用四个角色给整条 CPU 剖析流水线对号入座,看看本文的舞台在哪儿:
text
   ① 闹钟(内核定时器,每 10ms 一响)
           │
           ▼
   ② 被拍肩的工人(sigprof 抓下调用栈)
           │
           ▼
   ③ 环形账本 profBuf(无锁,先摆货再翻牌)
           │
           ▼  readProfile() 把账借走
   ┌───────────────────────────────────────────────┐
   │  ④ 抄账员 · runtime/pprof(本文的舞台)        │
   │                                               │
   │    柜台层:                                    │
   │    Profile 三元组 / Lookup / WriteTo           │
   │    printCountProfile 指纹去重与两条出口         │
   │    labels:Do → g.labels → 写进 sample          │
   └───────────────────────────────────────────────┘
           │
           ▼
   cpu.pprof / heap.pprof → go tool pprof -tag / 火焰图
标签就像夹在账本里的一张纸条;§6、§7 讲的就是它从用户手里一路贴到 goroutine 头上的完整链路。把范围钉死:本文只讲柜台这一层------工单、打印、标签;抓栈和流式写出这些底层动作,只在需要时提一句。
为什么这段读起来不直观,四条,都是源码的客观结构造成的:
| 不直观在哪 | 具体表现 |
|---|---|
| 一个结构伺候两条路 | Profile 的 count / write 是否为 nil,决定了 §3 NewProfile、§4 Add、§5 WriteTo 三处各走各的分支 |
| 按文件顺序讲,不按数据流讲 | 先讲结构(§2)、再讲注册表(§3)、再讲输出框架(§5),而人脑得先知道「一份剖析最终要变成文件」才立得起来 |
| 「用户可见层」底下全是转包 | 六个内置项的 count / write 几乎都只是一行转发到 runtime,比如 countGoroutine 直接 return runtime.NumGoroutine() |
| 标签跨三个文件还借了后门 | pprof.go 的 printCountProfile、label.go 的 labelMap、runtime.go 的 //go:linkname,中间还夹着 unsafe.Pointer 和写屏障 |
一句话记住 :这里不关心「怎么抓样本」,只关心「抓完之后,怎么摆柜台、怎么打印、怎么给样本贴业务标签」。难的不是算法,是委托关系一层套一层。
0.3 全局地图:从 g.labels 到 pprof 文件的两条大路
这三个文件里的代码,其实只在干两件大事,把它们当成两条大路看就不乱了:
大路一:一份剖析怎么被打印出来(§1 ~ §5)
text
   用户:pprof.Lookup("goroutine").WriteTo(w, 1)
           │
           ▼
   ┌──────────────────────────────────────────┐
   │  Profile(工单)                          │
   │   name  / count() / write(w, debug)       │
   └──────────────────────────────────────────┘
           │
           ├── 内置窗口:write(...) 直接转包 runtime ──► 各自的写侧实现
           │
           └── 自定义窗口:锁内快照 m → 排序 → 通用框架
                       │
                       ▼
              printCountProfile
               ① 按「栈 + labels」指纹去重计数
               ② debug>0 → tabwriter 文本
③ debug=0 → profileBuilder → gzip proto大路二:一张标签怎么钻进样本(§6 ~ §8)
text
   pprof.Do(ctx, pprof.Labels("route", "/api/users"), f)
           │
           ▼
   WithLabels → mergeLabelSets(有序归并,重新分配)
           │
           ▼
   SetGoroutineLabels → runtime_setProfLabel → g.labels 指针
           │
           ├── CPU 采样:sigprof 抓栈时把 g.labels 当 tag 抄进账本
           ├── goroutine 采样:pprof_goroutineProfileWithLabels 直接拉出来
           └── go func():新 goroutine 继承 g.labels
           │
           ▼
   printCountProfile → b.pbLabel(tagSample_Label, key, value, 0)
           │
           ▼
   go tool pprof -tag / 火焰图里按标签重聚合
两条大路在 printCountProfile 汇合:大路一提供「栈」,大路二往同一条样本上补「标签」。§5.4 源码里那个延迟的 labels 回调(516~523 行),就是这个汇合点。
容易晕的原因 :标签的两段(label.go、runtime.go)在文件顺序上排在 §6、§7,离使用它的
printCountProfile(§5)隔了一整节。所以本文 §8 会把两条路各跑一遍,再回头串成一张表。
0.4 黑话速查表(读不下去时先翻这里)
用法:遇到不认识的词,先查「通俗解释」那一列,能继续读就不必深究;想追根问底再按第三列跳。
| 黑话 | 通俗解释 | 本文位置 |
|---|---|---|
| Profile | 一份剖析的「工单」,用户唯一看得见的类型 | §2 |
| name / count / write 三元组 | 工单上的三栏:叫什么、去哪数条数、去哪写文件 | §2 |
| 六个内置项 | goroutine / threadcreate / heap / allocs / block / mutex 六个固定窗口 | §2 |
| profiles.m | 全局「窗口登记表」,按名字找工单 | §2 |
| lockProfiles / unlockProfiles | 翻登记表前后加锁解锁,顺手懒初始化 | §2 |
| 懒初始化 | 第一次有人查表,才把六个内置项填进去 | §2 |
| NewProfile | 自己开一个新窗口,重名或空名直接 panic | §3 |
| Lookup | 按名字查表,/debug/pprof/<name> 最终也到这 |
§3 |
| Profiles | 把登记表里所有窗口列出来,按名字排好序 | §3 |
| Name() | 把工单上的名字读回来 | §3 |
| m mapany\[\]uintptr | 自定义窗口自己那张「值 → 调用栈」的表 | §2、§4 |
| count / write 为 nil | 判定「这是自定义窗口」的开关 | §3、§5 |
| Add / Remove | 往自定义表里登记 / 注销一个资源 | §4 |
| 32 帧上限 | Add 一次最多记 32 层调用栈 |
§4 |
| skip+1 | 抓栈时额外跳过 Callers 自己那一帧 |
§4 |
| lostProfileEvent | 空栈时的占位伪函数,不是真函数 | §4 |
| 泄漏清单 | 忘了 Remove 的资源会永久留在 profile 里 |
§4 |
| Count() | 内置项问委托函数,自定义项问 map 长度 | §4 |
| WriteTo | 「把这份剖析写出去」的总入口 | §5 |
| debug=0 / debug>0 / debug=2 | 三种输出档:gzip proto / 人读文本 / panic 同款全栈 | §5 |
| countProfile 接口 | 只要会 Len / Stack / Label 三招就能被打印 |
§5 |
| stackProfile | 把 [][]uintptr 包装成可打印对象的适配层 |
§5 |
| printCountProfile | 通用打印框架:去重、排序、分两条出口 | §5 |
| 栈指纹 / key() | 把「调用栈 + 标签」拼成一个字符串当身份证 | §5 |
| keysByCount | 按出现次数从多到少排,平手按字典序 | §5 |
| tabwriter | 文本输出时把各列对齐的排版工具 | §5 |
| printStackRecord | 把一串 PC 翻成「函数 + 文件 + 行号」 | §5 |
| profileBuilder | 把样本手工编成 protobuf 的构建器 | §5 |
| pbSample | 往 proto 里塞一个样本(值 + 位置 + 标签) | §5 |
| expandInlinedFrames | 把被内联的调用栈重新展开 | §5 |
| call PC / return PC | +1 那一下是把「调用地址」翻成「返回地址」 |
§5 |
| LabelSet / label / labelMap | 用户可见标签集 / 单条标签 / 内部包装 | §6 |
| labelContextKey | 往 context 里塞标签用的零大小私有钥匙 | §6 |
| WithLabels | 合并出一份新标签集,挂到子 context 上 | §6 |
| mergeLabelSets | 两个有序数组双指针归并,新值覆盖旧值 | §6 |
| Labels() 奇数 panic | 参数必须成对,否则直接 panic | §6 |
| sortedNoDupes | 构造时乐观假设「已升序、无重复」,不成立才走慢路径 | §6 |
| Label() / ForLabels() | 读一条 / 遍历全部标签 | §6 |
| SetGoroutineLabels | 把 ctx 里的标签贴到当前 goroutine 头上 | §7 |
| runtime_setProfLabel | linkname 后门:把裸指针写进 g.labels |
§7 |
| g.labels | goroutine 结构体里那个指针字段 | §7 |
| Do | 惯用入口:期间生效,返回后还原 | §7 |
| 不可变语义 | 每次合并都重新分配,多个 g 才能安全共享 | §6、§7 |
| 写屏障 | 保证塞进 g.labels 的指针不会被 GC 看丢 |
§7 |
| 子 goroutine 继承 | go func() 自动带上创建者的标签 |
§7 |
| -tag 聚合 | go tool pprof 按标签维度重新汇总 |
§6、§7 |
0.5 源码行号 ↔ 难点 ↔ 配图对照表
用法:读到某一节卡住,在这张表里找到它,先看「先看的白话」那一格,再回源码。「初读可跳过」打「可以」的,允许先糊弄过去,回头再补。
| 源码位置 | 在讲什么 | 先看的白话 | 配图 | 初读可跳过 |
|---|---|---|---|---|
| §1 · 1~96 行 包文档 | 三种用法、imports、已知 BUG | §1 开头一段 | --- | 可以 |
| §2 · 98~245 行 | 结构、三元组、六项、注册表 | §2.1、难点 A/B/C | 图 8-1 | |
| §3 · 247~296 行 | NewProfile / Lookup / Profiles / Name | §5.1 第 1 步、难点 C | 图 8-1 | |
| §4 · 298~355 行 | Count、Add、Remove、泄漏清单 | 难点 D | --- | |
| §5 · 357~575 行 | 通用打印、两条出口、栈打印 | §5.1、难点 E/F | 图 8-2 | |
| §6 · label.go 全文 | LabelSet / WithLabels / Labels / 归并 | §6.1、难点 G | 图 8-3 | 可以 |
| §7 · runtime.go 全文 | linkname、SetGoroutineLabels、Do | §8 支线、难点 G/H | 图 8-3 | |
| §8 · 串讲 | 两条大路汇合在 516~523 行 | 全节 | 图 8-2、图 8-3 |
1 包文档:五分钟用法全景(1~96 行)
先建画面 :这一节不用背。只要知道
runtime/pprof的包注释本身就是一篇官方教程,列了拿到剖析数据的三种姿势;后面所有代码,都是在给这三种姿势打地基。
1~3 行为许可头。5~76 行是整个包的文档注释------比一般包长得多,因为它是官方教程:
| 行号 | 内容 |
|---|---|
| 5~6 | 包定位:把 runtime 剖析数据写成 pprof 可视化工具期望的格式 |
| 8~16 | 方式一:go test -cpuprofile/-memprofile(标准测试内建) |
| 18~54 | 方式二:独立程序里 StartCPUProfile/StopCPUProfile + Lookup("allocs").WriteTo 的完整样例(flag + defer + runtime.GC() 刷新统计) |
| 56~62 | 方式三:import _ "net/http/pprof" 挂 HTTP 端点 |
| 64~75 | go tool pprof cpu.prof 的用法,以及 top / web 等交互命令的提示 |
go
package pprof                    // ← 76

import (
	"bufio"                     // ← 79:debug 文本输出的缓冲
	"cmp"                       // ← 80:1.21 泛型比较
	"fmt"                       // ← 81
	"internal/abi"              // ← 82:lostProfileEvent 的 FuncPCABIInternal
	"internal/profilerecord"    // ← 83:与 runtime 共享的记录类型
	"io"                        // ← 84
	"runtime"                   // ← 85
	"slices"                    // ← 86
	"sort"                      // ← 87:keysByCount(旧式接口,故未全换 slices)
	"strings"                   // ← 88
	"sync"                      // ← 89
	"text/tabwriter"            // ← 90:文本输出对齐
	"time"                      // ← 91:profileWriter 的 100ms 轮询
	"unsafe"                    // ← 92:labels 指针
)                               // ← 93
                                // ← 95~96:已知 BUG 说明------剖析质量受内核信号支持影响(issue 13841)
顺手埋两个伏笔 :
text/tabwriter与unsafe这两行 import 已经预告了 §5 的文本出口和 §7 的裸指针后门;time则是给写侧那个每 100ms 轮询一次的profileWriter用的。
2 Profile 结构与六个内置项(98~245 行)
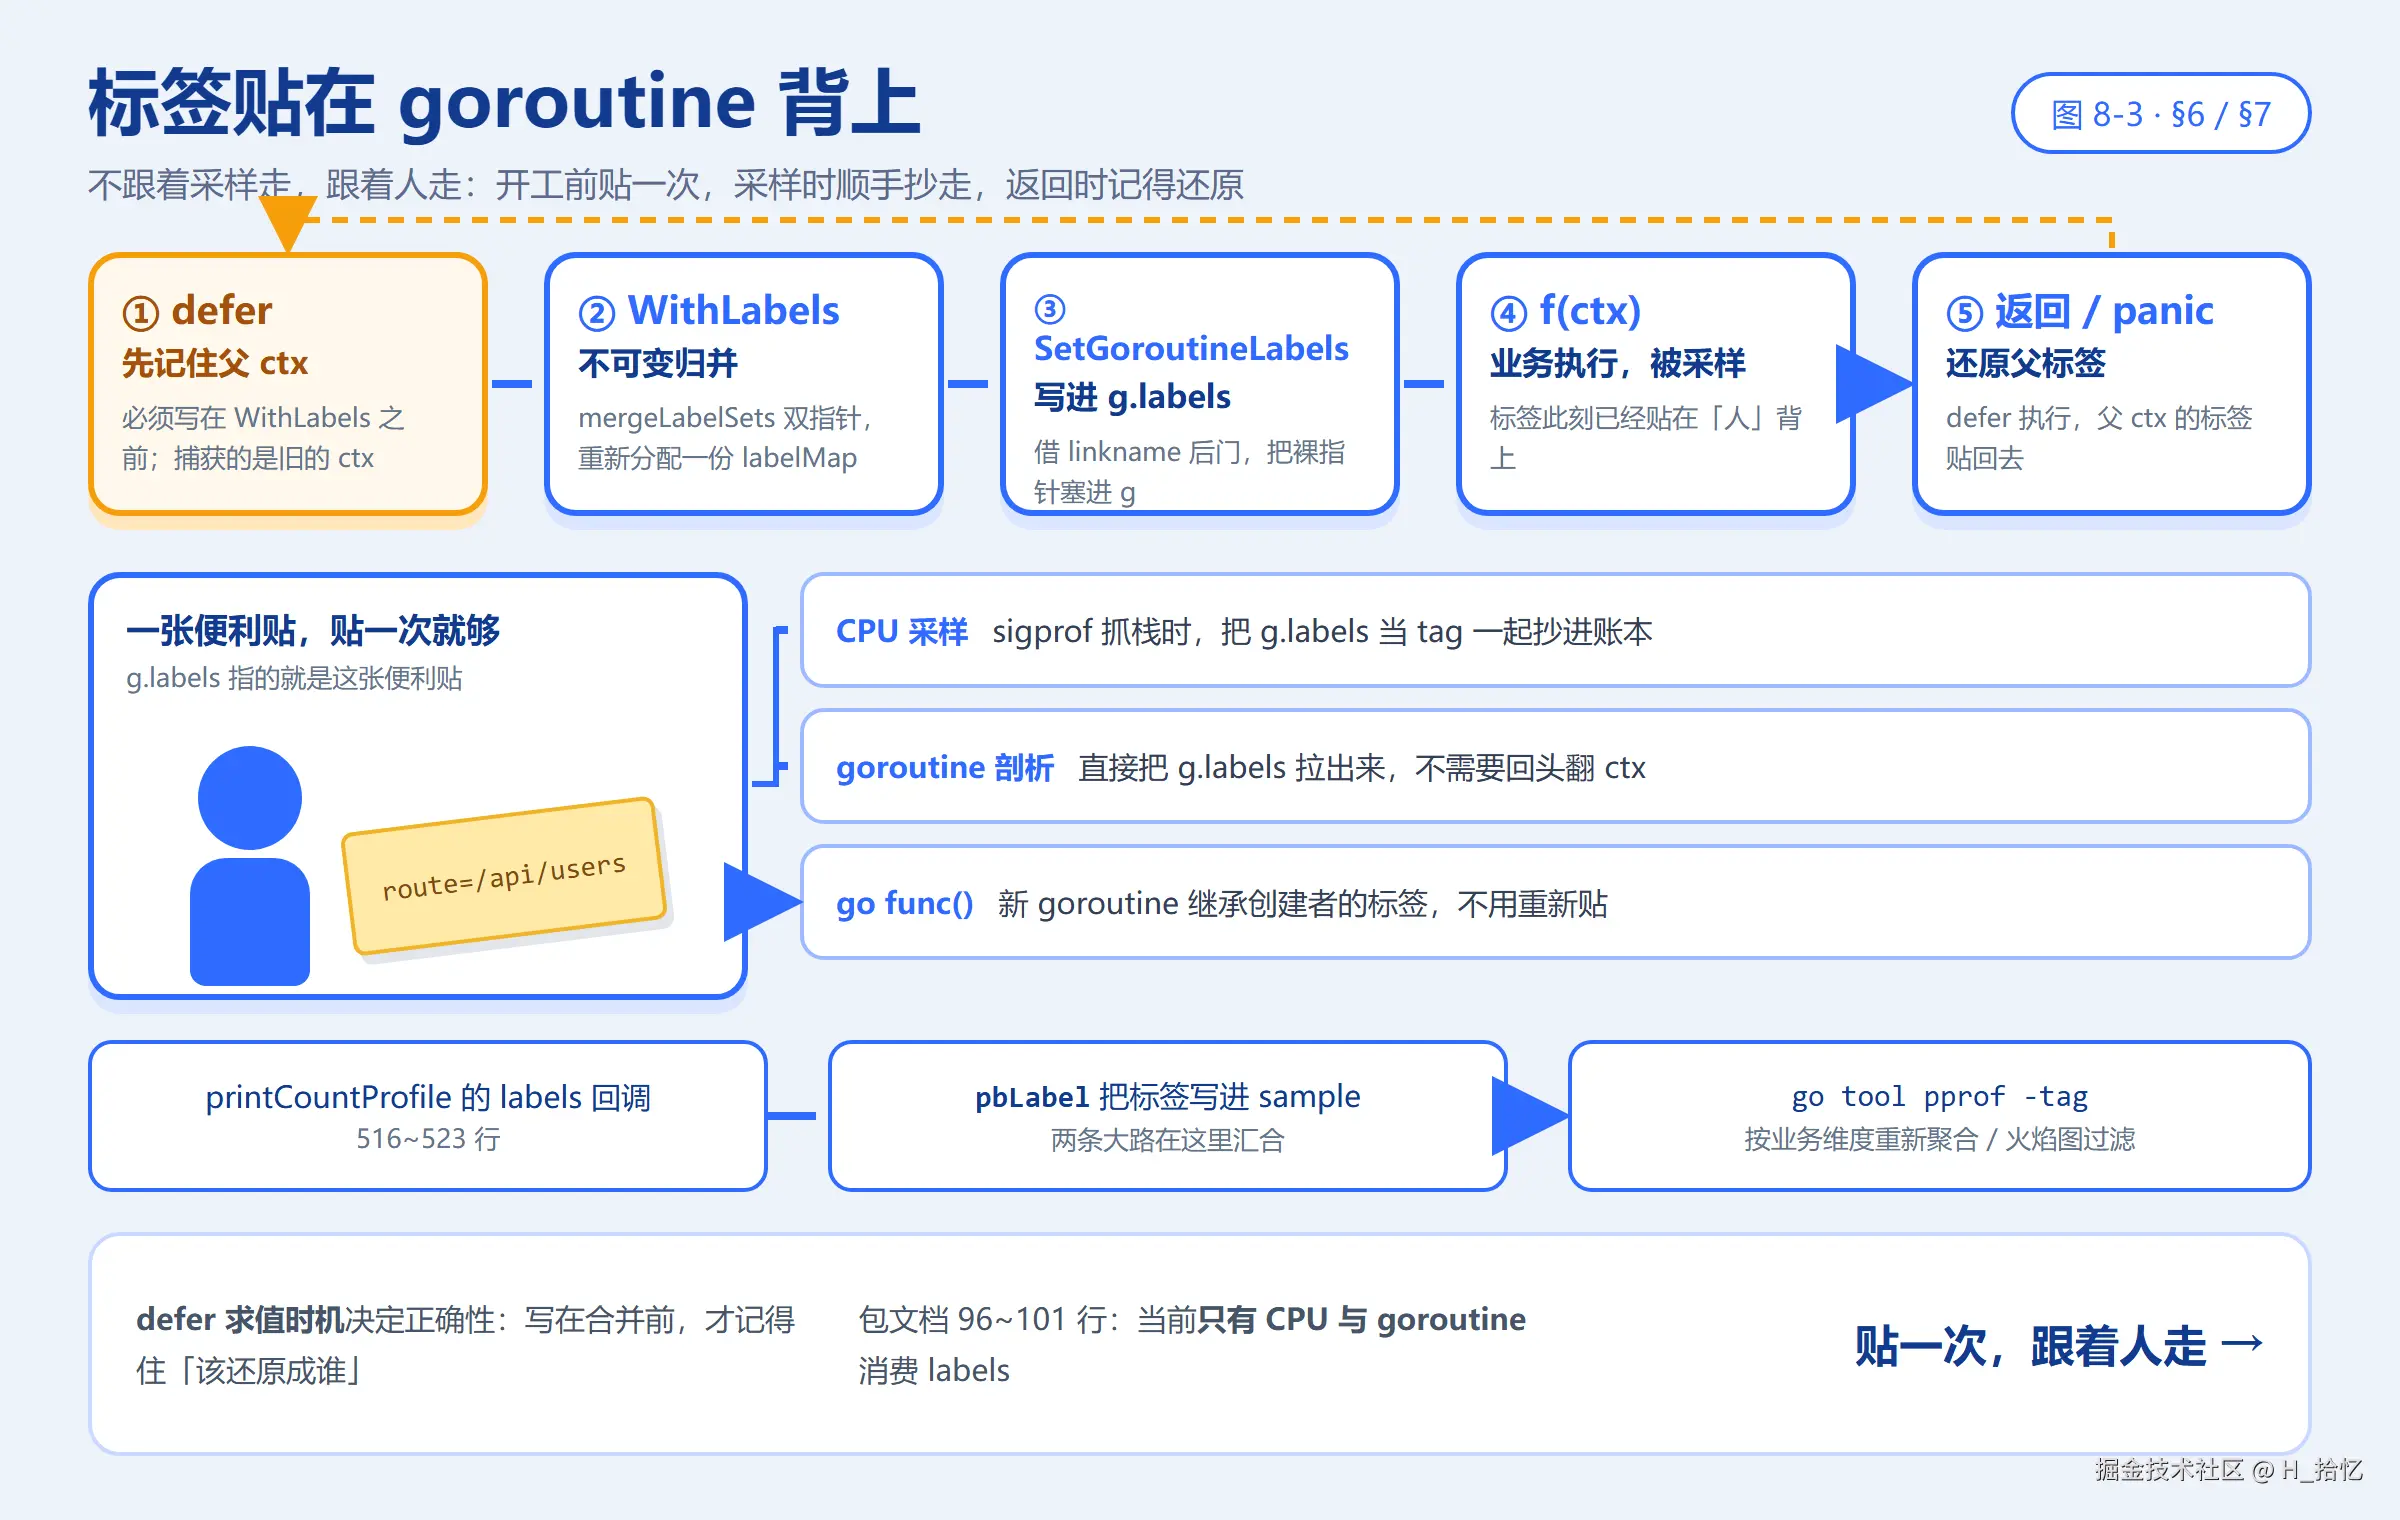
图 8-1 一张工单、六个窗口:Profile 的五个字段里,count / write 空不空就是分流开关;六个内置窗口每项都是 name + count + write,只负责把活儿转包给 runtime;自定义窗口只填 name + m;CPU 因为流式输出,压根不进登记表。
看图时抓三处:左边那张工单是后面所有分支的源头,中间登记表恰好六行、每行只有一对转包电话,右边橙色两块分别代表「自己记一本 map」和「不在这个大厅办」。对应 §2.1、§2.4 与难点 A / B / C。
2.1 先建画面:一张工单、一本登记表
道具一:一张工单 Profile。源码 179~184 行给了完整结构,五个字段一个不多:
| 字段 | 类型 | 通俗解释 | 谁在用 |
|---|---|---|---|
name |
string |
唯一名字,也是零值防御的判据 | 所有分支 |
mu |
sync.Mutex |
保护下面那张 m |
自定义窗口 |
m |
map[any][]uintptr |
自定义窗口自己的「值 → 栈」表 | 自定义窗口 |
count |
func() int |
内置窗口的「去哪数条数」 | 内置窗口 |
write |
func(io.Writer, int) error |
内置窗口的「去哪写文件」 | 内置窗口 |
最关键的一点 :count / write 有值还是为 nil,就是内置与自定义的分水岭。NewProfile 造出来的工单只填 name 和 m(263~264 行),两个函数指针留空------于是它天然走自定义路径;六个内置项正好相反,m 空着,两个指针填好。
道具二:一本登记表 profiles
| 字段 | 通俗解释 |
|---|---|
profiles.mu |
翻表前后的锁 |
profiles.m |
map[string]*Profile,首次访问时才由 lockProfiles 填入六项 |
lockProfiles 里那段 if profiles.m == nil(230 行)就是懒初始化:六个内置项 goroutineProfile、threadcreateProfile、heapProfile、allocsProfile、blockProfile、mutexProfile 在 233~238 行一次性登记。
2.2 包文档里必须知道的语义(98~177 行)
98~177 行是 Profile 类型的长文档,信息密度极高,拆成四块:
- 98~104 :定义(调用栈集合 + 事件计数)与用途(自定义资源追踪:文件/连接);方法并发安全。
- 106~120 :六个预定义 profile 名单一字排开(108~113);内置项
Add/Remove会 panic(115~116);CPU profile 不在此列------它流式输出,走专属 API(118~120)。 - 122~141 :heap 与 allocs 的语义文档------统计口径是"最近一次完成的 GC"(122~129,正好呼应 mprof.go 三周期);
-inuse_*vs-alloc_*四种视图,默认 inuse_space(131~135);allocs = heap 换默认视图(137~141)。 - 143~177 :block 与 mutex 的语义文档------block 记阻塞发生的位置 (
sync.Mutex.Lock,143~154);mutex 记临界区结束的位置 (Unlock,156~164)------"持锁 1 秒、5 个 waiter 各等 1 秒 → Unlock 栈记 5 秒"(166~171);runtime 内部锁默认报在runtime._LostContendedRuntimeLock(173~177,正是 runtime 侧 captureStack 的门控路径)。
2.3 源码逐行(179~245 行)
go
type Profile struct {
	name  string                              // ← 179:唯一名
	mu    sync.Mutex                          // ← 180:保护 m(自定义 profile 用)
	m     map[any][]uintptr                   // ← 181:自定义 profile 的 value→栈 表
	count func() int                          // ← 182:内置项:条数查询(委托 runtime)
	write func(io.Writer, int) error          // ← 183:内置项:输出实现(委托 runtime)
}                                            // ← 184
                                             // ← 186
// profiles records all registered profiles.
var profiles struct {                        // ← 187:全局注册表(懒初始化)
	mu sync.Mutex                            // ← 188
	m  map[string]*Profile                   // ← 189
}                                            // ← 190
六个内置 Profile 变量(192~226 行,模式完全一致,逐项列出):
go
var goroutineProfile = &Profile{   // ← 192
	name:  "goroutine",            // ← 193:debug=2 特殊:panic 同款全文本栈
	count: countGoroutine,         // ← 194:→ runtime.NumGoroutine
	write: writeGoroutine,         // ← 195:→ pprof_goroutineProfileWithLabels
}                                  // ← 196
var threadcreateProfile = &Profile{  // ← 198
	name:  "threadcreate",           // ← 199
	count: countThreadCreate,        // ← 200:→ runtime.ThreadCreateProfile(nil)
	write: writeThreadCreate,        // ← 201:→ pprof_threadCreateInternal
}                                    // ← 202
var heapProfile = &Profile{        // ← 204
	name:  "heap",                 // ← 205
	count: countHeap,              // ← 206:→ runtime.MemProfile(nil, true)
	write: writeHeap,              // ← 207:→ writeHeapInternal(..., "")
}                                  // ← 208
var allocsProfile = &Profile{      // ← 210
	name:  "allocs",               // ← 211
	count: countHeap, // identical to heap profile  // ← 212:与 heap 同一份数据!
	write: writeAlloc,             // ← 213:→ writeHeapInternal(..., "alloc_space")
}                                  // ← 214
var blockProfile = &Profile{       // ← 216
	name:  "block",                // ← 217
	count: countBlock,             // ← 218:→ runtime.BlockProfile(nil)
	write: writeBlock,             // ← 219:→ pprof_blockProfileInternal
}                                  // ← 220
var mutexProfile = &Profile{       // ← 222
	name:  "mutex",                // ← 223
	count: countMutex,             // ← 224:→ runtime.MutexProfile(nil)
	write: writeMutex,             // ← 225:→ pprof_mutexProfileInternal
}                                  // ← 226
go
func lockProfiles() {             // ← 228:注册表加锁 + 懒初始化
	profiles.mu.Lock()         // ← 229
	if profiles.m == nil {     // ← 230:首次访问
		// Initial built-in profiles.
		profiles.m = map[string]*Profile{
			"goroutine":    goroutineProfile,      // ← 233:六个内置项就位
			"threadcreate": threadcreateProfile,   // ← 234
			"heap":         heapProfile,           // ← 235
			"allocs":       allocsProfile,         // ← 236
			"block":        blockProfile,          // ← 237
			"mutex":        mutexProfile,          // ← 238
		}                                         // ← 239
	}                                                 // ← 240
}                                                     // ← 241
                                                      // ← 242
func unlockProfiles() {           // ← 243:对称解锁
	profiles.mu.Unlock()       // ← 244
}                                 // ← 245
2.4 六个内置窗口的三元组(速查)
源码 192~226 行六个变量模式完全一致,照抄成表:
| 名字 | count(去哪数条数) | write(去哪写文件) |
|---|---|---|
goroutine |
countGoroutine → runtime.NumGoroutine |
writeGoroutine → pprof_goroutineProfileWithLabels |
threadcreate |
countThreadCreate → runtime.ThreadCreateProfile(nil) |
writeThreadCreate → pprof_threadCreateInternal |
heap |
countHeap → runtime.MemProfile(nil, true) |
writeHeap → writeHeapInternal(..., "") |
allocs |
countHeap(212 行注明「与 heap 同一份数据」) |
writeAlloc → writeHeapInternal(..., "alloc_space") |
block |
countBlock → runtime.BlockProfile(nil) |
writeBlock → pprof_blockProfileInternal |
mutex |
countMutex → runtime.MutexProfile(nil) |
writeMutex → pprof_mutexProfileInternal |
表里没有 CPU。118~120 行写明:CPU profile 是流式输出 ,走
StartCPUProfile/StopCPUProfile专属 API,不进这张登记表。难点 A 专门讲为什么。
2.5 难点 A|六个窗口与「不在场」的 CPU
在纠结什么:注册表里恰好六项,一个不多一个不少;可最常被念叨的 CPU profile 偏偏不在里面。
通俗地说 :把 runtime/pprof 想成一个办事大厅,六个亮着牌子的窗口是「拍一次快照、当场给你一份文件」的即时业务------问一句「现在有多少 goroutine」,答完就完。CPU 剖析不是这种业务:它是开着水龙头一直放 ,StartCPUProfile 开、StopCPUProfile 关,中间源源不断往文件里写,根本不是「查一次」。硬把它塞进 Profile 的 write(w, debug) 模型,等于要求「一次性把一条河倒进杯子里」。所以 118~120 行直说它走专属 API,profBuf 里那份流式数据形态就是原因。
最小例子:
| 业务 | 形态 | 归谁管 |
|---|---|---|
Lookup("heap").WriteTo(w, 0) |
一问一答、当场出文件 | 六窗口 / Profile.write |
StartCPUProfile(f) ... StopCPUProfile() |
持续流、边攒边写 | 专属的 StartCPUProfile / profileWriter / StopCPUProfile 三件套 |
一句话记住:六个窗口都是「快照」,CPU 是「录像」,录像不进快照大厅。
对应源码行:§2.2 的 106~120 行、§2.3 的 233~238 行只登记六项。
2.6 难点 B|heap 与 allocs:两份名字,一份数据
在纠结什么 :allocsProfile 的 count 直接写成 countHeap,还特意注释「identical to heap profile」(212 行),可它明明是个独立窗口。
通俗地说 :同一仓库里堆着同一批货,只是两张报表选了不同的默认列 。heap 默认让人看「现在还占着多少」(inuse_space),allocs 默认让人看「一共分配过多少」(alloc_space)。货是同一批,报表抬头不同,没必要搬两遍。§2.2 的 137~141 行说「allocs = heap 换默认视图」,206/212 行两个 countHeap 是同一份,213 行 writeAlloc 也只是给 writeHeapInternal 多传了一个字符串。
最小例子:
| 窗口 | count | write 里的 defaultSampleType |
默认看哪列 |
|---|---|---|---|
heap |
countHeap |
""(空,走 pprof 默认) |
inuse_space |
allocs |
countHeap |
"alloc_space" |
alloc_space |
一句话记住:名字是两份,数据是同一份,差别只在「默认把哪一列摆前面」。
对应源码行 :§2.3 的 212 行 countHeap, // identical to heap profile;§2.2 的 137~141 行 allocs 语义文档。
2.7 难点 C|一张工单,两条完全相反的路
在纠结什么 :Profile 只有五个字段,却要同时表达「转包给 runtime」和「自己用 map 记」两种截然不同的实现。
通俗地说 :工单上留了两格函数指针 count / write,就是两个「转包电话」。填了号码 = 内置窗口,一有活就拨号转出去;空着 = 自定义窗口,只能自己翻 m 那本账。于是同一个方法在不同工单上表现完全相反:
| 方法 | 内置(write != nil) |
自定义(write == nil) |
|---|---|---|
Count() |
return p.count()(303 行,委托 runtime) |
return len(p.m)(305 行) |
Add(v, skip) |
panic("Add called on built-in Profile ...")(330 行) |
抓栈、写 p.m[value](346 行) |
WriteTo(w, d) |
return p.write(w, d)(377 行) |
锁内快照 → 排序 → printCountProfile(381~391 行) |
最小例子 :NewProfile("myfileapp.openFiles") 造出的工单 count / write 都是 nil(263~264 行),所以它天生只能走右列;heapProfile 两个都填好,天生只能走左列。没有任何一个 if 在运行时「判断类型」,判据就是这两个指针空不空。
一句话记住:不是用两套类型,是用一张工单上的两个空格子分流;空 = 自己干,不空 = 转包。
对应源码行 :§2.3 的 179~184 行结构、§3 的 263~264 行 NewProfile 只填 name 与 m、§4 的 330 行内置项禁止手工添加、§5.2 的 377 行 if p.write != nil。
3 注册表操作:NewProfile / Lookup / Profiles(247~296 行)
先建画面 :登记表只有四种动作------开新窗口、按名字查、列出全部、把名字读回来。四个函数都先
lockProfiles()(顺手完成懒初始化)、defer unlockProfiles(),别的花样没有。
go
// NewProfile creates a new profile with the given name. ...(248~252:文档------重名 panic;
//     命名约定 'import/path.' 前缀;名字不能含空格------兼容旧工具)
func NewProfile(name string) *Profile {
	lockProfiles()                          // ← 254
	defer unlockProfiles()                  // ← 255
	if name == "" {
		panic("pprof: NewProfile with empty name")   // ← 257
	}                                       // ← 258
	if profiles.m[name] != nil {
		panic("pprof: NewProfile name already in use: " + name)  // ← 260
	}                                       // ← 261
	p := &Profile{
		name: name,                     // ← 263
		m:    map[any][]uintptr{},      // ← 264:count/write 为 nil → 走自定义路径
	}                                       // ← 265
	profiles.m[name] = p                    // ← 266
	return p                                // ← 267
}                                           // ← 268
                                            // ← 270
// Lookup returns the profile with the given name, or nil if no such profile exists.
func Lookup(name string) *Profile {         // ← 271:`/debug/pprof/<name>` 路由最终都到这
	lockProfiles()                      // ← 272
	defer unlockProfiles()              // ← 273
	return profiles.m[name]             // ← 274
}                                       // ← 275
                                        // ← 277
// Profiles returns a slice of all the known profiles, sorted by name.
func Profiles() []*Profile {            // ← 278:`/debug/pprof/` 首页列表的数据源
	lockProfiles()                      // ← 279
	defer unlockProfiles()              // ← 280
	                                    // ← 281
	all := make([]*Profile, 0, len(profiles.m))  // ← 282
	for _, p := range profiles.m {      // ← 283
		all = append(all, p)        // ← 284
	}                                   // ← 285
	                                    // ← 286
	slices.SortFunc(all, func(a, b *Profile) int {  // ← 287:按名排序(输出稳定)
		return strings.Compare(a.name, b.name)      // ← 288
	})                                  // ← 289
	return all                          // ← 290
}                                       // ← 291
                                        // ← 293
// Name returns this profile's name, which can be passed to [Lookup] to reobtain the profile.
func (p *Profile) Name() string {      // ← 294
	return p.name                       // ← 295
}                                       // ← 296
这一节埋下的伏笔 :263~264 行只填
name与m,两个函数指针留空------就是难点 C 那个分水岭的物理来源。§5.1 第 1 步会用Lookup("heap")把这张登记表真正翻开一次。
4 自定义剖析:Add / Remove(298~355 行)
先建画面 :把自定义窗口想成「资源借用登记台」------借走一个文件 / 连接就登记一行,还回来就划掉。忘了划掉的那一行,就是一份现成的泄漏清单。
go
// Count returns the number of execution stacks currently in the profile.
func (p *Profile) Count() int {        // ← 299
	p.mu.Lock()                        // ← 300
	defer p.mu.Unlock()                // ← 301
	if p.count != nil {
		return p.count()           // ← 303:内置项委托 count 函数
	}                                  // ← 304
	return len(p.m)                    // ← 305:自定义项=map 条数
}                                      // ← 306
go
// Add adds the current execution stack to the profile, associated with value. ...(308~324:文档------
//     value 须可作 map key 且 Remove 前不被 GC;skip 语义配示例)
func (p *Profile) Add(value any, skip int) {
	if p.name == "" {
		panic("pprof: use of uninitialized Profile")  // ← 327:零值 Profile 防御
	}                                                  // ← 328
	if p.write != nil {
		panic("pprof: Add called on built-in Profile " + p.name)  // ← 330:内置项禁止手工添加
	}                                                  // ← 331
	                                                   // ← 332
	stk := make([]uintptr, 32)                         // ← 333:32 帧上限(与导出 ABI 对齐)
	n := runtime.Callers(skip+1, stk[:])               // ← 334:skip+1 再跳过 Callers 自身
	stk = stk[:n]                                      // ← 335
	if len(stk) == 0 {
		// The value for skip is too large, and there's no stack trace to record.
		stk = []uintptr{abi.FuncPCABIInternal(lostProfileEvent)}  // ← 338:空栈占位------伪函数
	}                                                  // ← 339
	                                                   // ← 340
	p.mu.Lock()                                        // ← 341
	defer p.mu.Unlock()                                // ← 342
	if p.m[value] != nil {
		panic("pprof: Profile.Add of duplicate value")  // ← 344:同一 value 重复 Add → panic(用错 API 的信号)
	}                                                  // ← 345
	p.m[value] = stk                                   // ← 346
}                                                      // ← 347
                                                       // ← 349
// Remove removes the execution stack associated with value from the profile.
// It is a no-op if the value is not in the profile.
func (p *Profile) Remove(value any) {   // ← 351
	p.mu.Lock()                     // ← 352
	defer p.mu.Unlock()              // ← 353
	delete(p.m, value)               // ← 354
}                                    // ← 355
自定义 profile 的经典用法(追踪未关闭资源,246~253 行的示例,示意、不能直接编译):
go
var fileProfile = pprof.NewProfile("myfileapp.openFiles")

f, err := os.Open(path)
if err == nil {
    fileProfile.Add(f, 0)                 // 借走,登记
    defer fileProfile.Remove(f)          // 还回来,划掉;忘了这行就是泄漏清单
}                                         // 忘了 Remove 的 f 会永远出现在 profile 里
4.1 难点 D|32 帧、skip+1 与「泄漏清单」
在纠结什么 :Add(value, skip) 里一串细节------make([]uintptr, 32)、runtime.Callers(skip+1, stk[:])、空栈时塞 lostProfileEvent、重复 value 直接 panic------每一处都像防御过头。
通俗地说:登记台要能「借了还能对得上号」,于是每个细节都有理由:
| 细节 | 为什么 |
|---|---|
value 必须能作 map key |
它是 p.m[value] 的钥匙,还回来时 delete(p.m, value) 得找得到 |
32 帧上限(333 行) |
一次抓栈最多记 32 层,与导出 ABI 对齐,够定位又不浪费 |
skip+1(334 行) |
多跳一层,把 runtime.Callers 自己那一帧也跳过 |
空栈塞 lostProfileEvent(338 行) |
skip 给太大导致没栈可记时,用 abi.FuncPCABIInternal(lostProfileEvent) 这个伪函数占位,报告里不会凭空少一条 |
| 重复 Add 同一个 value 就 panic(344 行) | 这是「你用错 API 了」的信号,不是要容错 |
忘 Remove |
那行永远划不掉,profile 里就永远列着它------这就是 244~253 行说的「泄漏清单」 |
最小例子 :上面那段 os.Open 的示例本身就是最小例子:借走 Add、还回来 Remove,忘了还的那一行会一直出现在 /debug/pprof/ 的自定义 profile 列表里。
一句话记住 :Add 登记、Remove 划掉,忘了划掉的资源就是一份现成的泄漏清单;value 得能当钥匙。
对应源码行 :§4 的 308~324 行 Add 文档(value 须可作 map key、Remove 前不被 GC)、333~338 行的抓栈片段、344 行重复 panic、246~253 行的经典用法。
5 WriteTo 与 countProfile 框架(357~575 行)
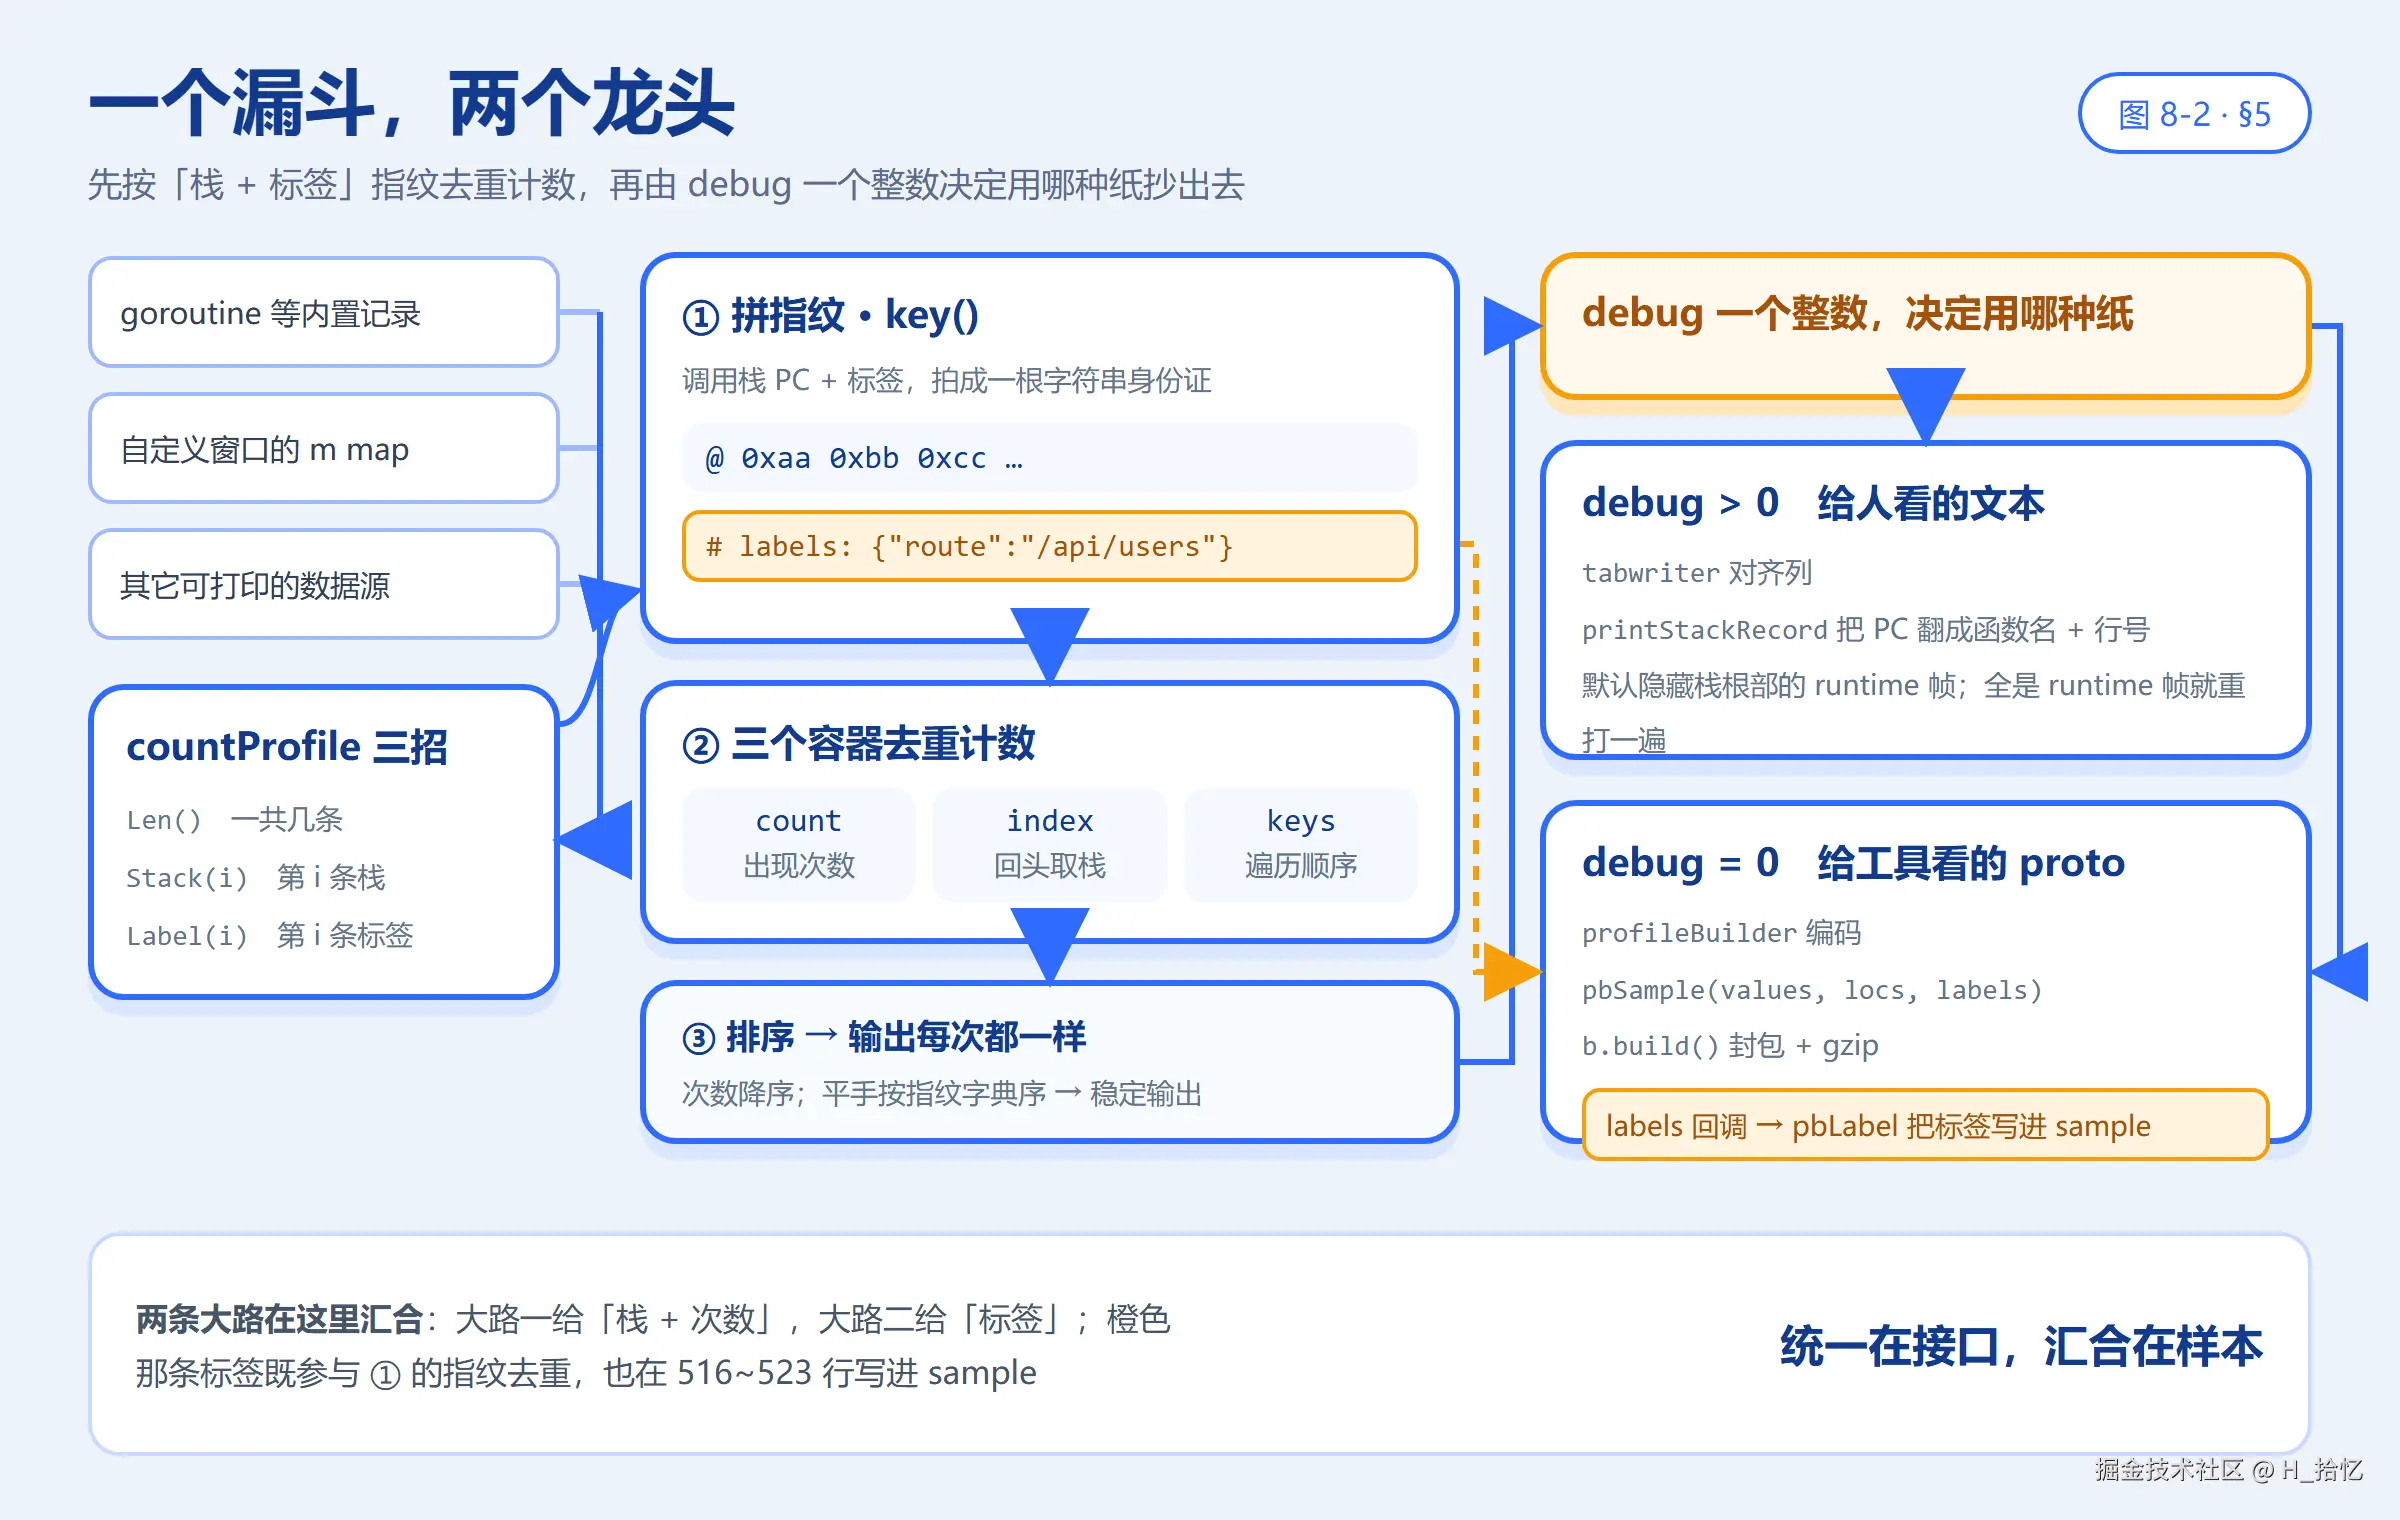
图 8-2 一个漏斗、两个龙头:异构数据先被 countProfile 三招抹平,按「调用栈 PC + 标签」拼成指纹,用 count / index / keys 三个容器去重计数并排序;再由 debug 一个整数决定走 tabwriter 文本,还是走 profileBuilder 编成 gzip proto。
看图时留意那条橙色虚线:标签既参与 ① 的指纹去重,又通过 516~523 行的 labels 回调写进 sample------这正是两条大路的汇合点。蓝色那两处排序则解释了「输出为什么每次都一样」。对应 §5.1、§5.4 与难点 E / F。
5.1 先建画面:跟着 Lookup("heap").WriteTo(w, 0) 走一遍
先不谈任何位运算,只看一次最普通的操作------用户要一份 heap 的 proto 快照。
第 1 步|查表 。Lookup("heap") 进来先 lockProfiles():profiles.mu.Lock(),若 profiles.m == nil 就填好六个内置项(233~238 行),defer unlockProfiles() 解锁,最后 return profiles.m[name](274 行)。拿到的是 heapProfile,也就是 &Profile{name: "heap", count: countHeap, write: writeHeap}(204~208 行)。
第 2 步|进 WriteTo(函数定义见 §5.2,358~392 行)。两道检查:
| 检查 | 结果 |
|---|---|
p.name == ""? |
不是,跳过「use of zero Profile」panic(374 行) |
p.write != nil? |
是,writeHeap 有值 → 直接 return p.write(w, debug)(377 行) |
这一步是全篇最容易被略过的分岔 :内置窗口到此就「转包」出去了,WriteTo 里后面那半段(锁内快照、排序、通用框架)一行都不执行。
第 3 步|转包到 writeHeap 。writeHeap(w, 0) 只做一件事:return writeHeapInternal(w, debug, "")(593 行)。那个空字符串是 defaultSampleType,意思是「按 pprof 默认视图 inuse_space 出」。对照 writeAlloc 传的是 "alloc_space"(599 行)------heap 与 allocs 的全部差别,就在这一个参数(难点 B)。再往下的两段式抓取、MemStats 与文本头,已经不在本文这 1~575 行里;这里只要记住「转包时接了一个空字符串」就够了。
第 4 步|反过来看自定义窗口走的那半段 (p.write == nil 时):
| 顺序 | 动作 | 源码位置 |
|---|---|---|
| 1 | p.mu.Lock(),把 m 里所有栈拷进 all |
381~385 行 |
| 2 | p.mu.Unlock()------锁外 再做慢活,不拖累 Add |
386 行 |
| 3 | slices.SortFunc(all, slices.Compare),抹平 map 遍历的随机性 |
389 行 |
| 4 | printCountProfile(w, debug, p.name, stackProfile(all)) |
391 行 |
第 5 步|通用漏斗 printCountProfile (463~528 行)。先用一个 key 函数把「调用栈 + 标签」拼成字符串身份证:fmt.Fprintf(&buf, "@") 起头,每个 PC 写 " %#x",有标签再补 "\n# labels: " 和 lbls.String()(466~472 行)。然后三个容器一起上:
| 容器 | 作用 |
|---|---|
count map[string]int |
指纹 → 出现几次 |
index map[string]int |
指纹 → 第一次出现时的下标(回头取栈用) |
keys []string |
所有不同指纹 |
sort.Sort(&keysByCount{keys, count})(489 行)按次数降序、平手按字典序------输出为什么每次都一样,答案在这一行。
第 6 步|分龙头:
| 条件 | 走哪 | 关键动作 |
|---|---|---|
debug > 0 |
文本 | tabwriter.NewWriter(w, 1, 8, 1, '\t', 0)、"%s profile: total %d\n"、printStackRecord(tw, ..., false)、tw.Flush() |
debug == 0 |
proto | newProfileBuilder(w)、pbValueType(tagProfile_PeriodType, name, "count")、int64Opt(tagProfile_Period, 1)、values := []int64{0}、appendLocsForStack、pbSample(values, locs, labels)、b.build() |
b.build()那一下才封包加 gzip(526 行),具体编码由 proto 构建器profileBuilder负责;这里只要认住「漏斗底下有个 proto 龙头」即可。
整条主链一句话 :查表 → 有 write 就转包、没有就自己快照 → 需要通用打印时都进 printCountProfile 去重排序 → 按 debug 分两个龙头。
别被绕晕 :在本文的 1~575 行里,
printCountProfile是自定义窗口直接调用 的;六个内置项的write转包到 runtime 之后怎么落地(有的也回到这个漏斗,有的走printCountCycleProfile),已经不在这段源码里。这里只需记住三件事:漏斗存在、接口是三招、两条出口由debug决定。
5.2 源码逐行:WriteTo、适配层与接口(357~408 行)
go
// WriteTo writes a pprof-formatted snapshot of the profile to w. ...(358~371:文档------
//     debug=0 gzip protobuf;debug=1 人类可读文本;goroutine 的 debug=2 = panic 同款栈)
func (p *Profile) WriteTo(w io.Writer, debug int) error {
	if p.name == "" {
		panic("pprof: use of zero Profile")  // ← 374
	}                                          // ← 375
	if p.write != nil {
		return p.write(w, debug)           // ← 377:内置项交给各自的 write 实现
	}                                       // ← 378
	                                          // ← 379
	// Obtain consistent snapshot under lock; then process without lock.
	p.mu.Lock()                             // ← 381:锁内快照
	all := make([][]uintptr, 0, len(p.m))   // ← 382
	for _, stk := range p.m {               // ← 383
		all = append(all, stk)          // ← 384
	}                                       // ← 385
	p.mu.Unlock()                           // ← 386:锁外处理(输出慢,不拖累 Add)
	                                          // ← 387
	// Map order is non-deterministic; make output deterministic.
	slices.SortFunc(all, slices.Compare)    // ← 389:map 遍历随机 → 排序保证输出稳定
	                                          // ← 390
	return printCountProfile(w, debug, p.name, stackProfile(all))  // ← 391:复用通用框架
}                                                                              // ← 392
                                                                               // ← 393
type stackProfile [][]uintptr                    // ← 394:[][]uintptr 适配 countProfile 接口
                                                 // ← 395
func (x stackProfile) Len() int              { return len(x) }              // ← 396
func (x stackProfile) Stack(i int) []uintptr { return x[i] }                // ← 397
func (x stackProfile) Label(i int) *labelMap { return nil }                 // ← 398:自定义项无 labels
                                                 // ← 399~400:接口定义------三个方法即可成为可打印剖析
type countProfile interface {                    // ← 404:goroutine/threadcreate/自定义 共用此框架
	Len() int                                 // ← 405
	Stack(i int) []uintptr                    // ← 406
	Label(i int) *labelMap                    // ← 407
}                                               // ← 408
可打印接口 countProfile(404~408 行)只有三招,两个实现各有来历:
| 方法 | 通俗解释 | 两个实现 |
|---|---|---|
Len() int |
一共几条 | stackProfile 返回 len(x);runtimeProfile 返回 len(p.stk) |
Stack(i int) []uintptr |
第 i 条的调用栈 | 各自取自己那份 |
Label(i int) *labelMap |
第 i 条的标签 | stackProfile 恒返回 nil(自定义项无标签) |
5.3 源码逐行:内联展开(410~427 行)
go
// expandInlinedFrames copies the call stack from pcs into dst, expanding any
// PCs corresponding to inlined calls ...(410~412)------runtime/pprof 侧的延迟内联展开(对应 mprof.go 的 expandFrames)
func expandInlinedFrames(dst, pcs []uintptr) int {
	cf := runtime.CallersFrames(pcs)   // ← 414
	var n int                          // ← 415
	for n < len(dst) {                 // ← 416
		f, more := cf.Next()       // ← 417
		// f.PC is a "call PC", but later consumers will expect
		// "return PCs"
		dst[n] = f.PC + 1          // ← 420:call PC → return PC 语义
		n++                        // ← 421
		if !more {                 // ← 422
			break              // ← 423
		}                         // ← 424
	}                                 // ← 425
	return n                          // ← 426
} // ← 427printCountCycleProfile(429~457 行)是 block / mutex 专用的 proto 输出函数,与调用方 writeBlock / writeMutex 配套,负责把带周期计数的样本编码成 protobuf。往下看之前先记住它属于「专用通道」;接下来要看的 printCountProfile,才是负责文本 / proto 两条出口的通用框架。
5.4 源码逐行:printCountProfile(459~528 行)
先建画面 :这就是两条大路的汇合点。上半段把异构数据拍扁成字符串、去重计数;下半段用
debug选纸。注意 516~523 行那个延迟的labels回调------大路二(标签)就是从这里钻进 sample 的,§8 会完整跑一遍。
go
// printCountProfile prints a countProfile at the specified debug level. ...(459~460)
func printCountProfile(w io.Writer, debug int, name string, p countProfile) error {
	// Build count of each stack.
	var buf strings.Builder                  // ← 463:栈指纹字符串复用的构造器
	key := func(stk []uintptr, lbls *labelMap) string {  // ← 464:把 (栈, labels) 序列化成 key
		buf.Reset()                       // ← 465
		fmt.Fprintf(&buf, "@")             // ← 466
		for _, pc := range stk {           // ← 467
			fmt.Fprintf(&buf, " %#x", pc)  // ← 468
		}                                  // ← 469
		if lbls != nil {                   // ← 470
			buf.WriteString("\n# labels: ")  // ← 471
			buf.WriteString(lbls.String())   // ← 472
		}                                      // ← 473
		return buf.String()                    // ← 474
	}                                          // ← 475
	count := map[string]int{}                  // ← 476:指纹 → 计数
	index := map[string]int{}                  // ← 477:指纹 → 首次出现的 i(取栈用)
	var keys []string                          // ← 478
	n := p.Len()                               // ← 479
	for i := 0; i < n; i++ {                   // ← 480
		k := key(p.Stack(i), p.Label(i))   // ← 481
		if count[k] == 0 {                 // ← 482:新指纹
			index[k] = i               // ← 483
			keys = append(keys, k)     // ← 484
		}                                  // ← 485
		count[k]++                         // ← 486
	}                                      // ← 487
	                                       // ← 488
	sort.Sort(&keysByCount{keys, count})   // ← 489:计数降序
	                                       // ← 490
	if debug > 0 {                         // ← 491:【文本格式】
		// Print debug profile in legacy format
		tw := tabwriter.NewWriter(w, 1, 8, 1, '\t', 0)   // ← 493:对齐列
		fmt.Fprintf(tw, "%s profile: total %d\n", name, p.Len())  // ← 494
		for _, k := range keys {           // ← 495
			fmt.Fprintf(tw, "%d %s\n", count[k], k)  // ← 496
			printStackRecord(tw, p.Stack(index[k]), false)  // ← 497:栈的符号化文本
		}                                  // ← 498
		return tw.Flush()                  // ← 499
	}                                      // ← 500
	                                       // ← 501
	// Output profile in protobuf form.
	b := newProfileBuilder(w)              // ← 503:【proto 格式】(profileBuilder)
	b.pbValueType(tagProfile_PeriodType, name, "count")  // ← 504:period_type = <name>/count
	b.pb.int64Opt(tagProfile_Period, 1)    // ← 505:period=1(每个事件算 1)
	b.pbValueType(tagProfile_SampleType, name, "count")  // ← 506
	                                       // ← 507
	values := []int64{0}                   // ← 508:单值样本
	var locs []uint64                      // ← 509:location id 复用缓冲
	for _, k := range keys {               // ← 510
		values[0] = int64(count[k])    // ← 511
		// For count profiles, all stack addresses are
		// return PCs, which is what appendLocsForStack expects.
		locs = b.appendLocsForStack(locs[:0], p.Stack(index[k]))  // ← 514
		idx := index[k]                // ← 515
		var labels func()              // ← 516:延迟 labels 回调
		if p.Label(idx) != nil {       // ← 517
			labels = func() {          // ← 518
				for _, lbl := range p.Label(idx).list {  // ← 519
					b.pbLabel(tagSample_Label, lbl.key, lbl.value, 0)  // ← 520:★labels 写进 sample!
				}                      // ← 521
			}                          // ← 522
		}                              // ← 523
		b.pbSample(values, locs, labels)  // ← 524
	}                                  // ← 525
	b.build()                          // ← 526:封包 + gzip
	return nil                         // ← 527
}                                     // ← 528
5.5 源码逐行:排序规则与栈打印(531~575 行)
go
// keysByCount sorts keys with higher counts first, breaking ties by key string order.
type keysByCount struct {        // ← 531:sort.Interface 旧式实现
	keys  []string             // ← 532
	count map[string]int       // ← 533
}                               // ← 534
                                // ← 535
func (x *keysByCount) Len() int      { return len(x.keys) }             // ← 536
func (x *keysByCount) Swap(i, j int) { x.keys[i], x.keys[j] = x.keys[j], x.keys[i] }  // ← 537
func (x *keysByCount) Less(i, j int) bool {                             // ← 538
	ki, kj := x.keys[i], x.keys[j]                                   // ← 539
	ci, cj := x.count[ki], x.count[kj]                               // ← 540
	if ci != cj {                                                    // ← 541
		return ci > cj                                           // ← 542:计数大者在前
	}                                                                // ← 543
	return ki < kj                                                   // ← 544:平手按字典序(输出确定)
}                                                                    // ← 545
go
// printStackRecord prints the function + source line information
// for a single stack trace.
func printStackRecord(w io.Writer, stk []uintptr, allFrames bool) {  // ← 549:文本栈打印
	show := allFrames                  // ← 550:false=先隐藏 runtime 帧
	frames := runtime.CallersFrames(stk)  // ← 551
	for {                              // ← 552
		frame, more := frames.Next()   // ← 553
		name := frame.Function         // ← 554
		if name == "" {                // ← 555:符号化失败
			show = true                // ← 556
			fmt.Fprintf(w, "#\t%#x\n", frame.PC)  // ← 557:只能打裸地址
		} else if name != "runtime.goexit" && (show || !(strings.HasPrefix(name, "runtime.") || strings.HasPrefix(name, "internal/runtime/"))) {  // ← 558:跳过 goexit;根部的 runtime 帧隐藏(对分配栈尤其有用)
			// Hide runtime.goexit and any runtime functions at the beginning.
			show = true                // ← 560:见到首个用户帧后不再隐藏
			fmt.Fprintf(w, "#\t%#x\t%s+%#x\t%s:%d\n", frame.PC, name, frame.PC-frame.Entry, frame.File, frame.Line)  // ← 562
		}                              // ← 563
		if !more {                     // ← 564
			break                      // ← 565
		}                              // ← 566
	}                                  // ← 567
	if !show {                         // ← 568:全是 runtime 帧(罕见)------重打一遍不隐藏
		// We didn't print anything; do it again,
		// and this time include runtime functions.
		printStackRecord(w, stk, true) // ← 571
		return                         // ← 572
	}                                  // ← 573
	fmt.Fprintf(w, "\n")               // ← 574
}                                      // ← 575
5.6 难点 E|指纹去重:为什么异构数据能被一个漏斗吞下
在纠结什么 :goroutine 给的是 StackRecord、自定义给的是 [][]uintptr、threadcreate 又是另一种记录,printCountProfile 凭什么一视同仁。
通俗地说 :因为它根本不碰原始类型,只认 countProfile 那三招(404~408 行):Len() 问几条、Stack(i) 取第 i 条栈、Label(i) 取第 i 条标签。不管你内部是切片还是 map,只要会这三招就能进漏斗。进漏斗之后,所有栈都被 key() 拍扁成一根字符串:@ 0xaa 0xbb ... 后面可选地跟一行 # labels: {...}。剩下的活儿全是在跟字符串和整数打交道,跟原始数据来源彻底解耦。
最小例子 :两条完全相同的栈(且标签相同)→ key 一样 → count[k] 从 1 变 2、index[k] 停在第一次的下标 0;输出时只打一行,前面写 2。count / index / keys 三个容器(476~478 行)就是这么配合的:count 管次数、index 管「回头找哪条栈」、keys 管遍历顺序。
一句话记住:接口把「取数据」标准化,指纹把「比数据」标准化;漏斗里只剩「字符串 → 次数」。
对应源码行 :§5.2 的 404~408 行接口定义;§5.4 的 464~475 行 key 闭包、476~487 行三个容器。
5.7 难点 F|两条出口与「输出为什么稳定」
在纠结什么 :printCountProfile 后半段一刀切成 debug > 0 和「否则」;还有个不起眼的 keysByCount,以及 WriteTo 里那次 slices.SortFunc(all, slices.Compare)。
通俗地说 :同一个漏斗底下接了两个龙头------debug>0 接「给人看的文本」(tabwriter 对齐、printStackRecord 把 PC 翻成函数名),debug=0 接「给工具看的 proto」(profileBuilder 编成 gzip)。选哪个由 debug 一个整数决定。
而「输出稳定」是两道保险叠出来的:
| 保险 | 位置 | 治什么 |
|---|---|---|
slices.SortFunc(all, slices.Compare) |
WriteTo 389 行 |
map 遍历顺序随机,先把原始栈排定 |
keysByCount 的 Less |
538~545 行 | 次数降序;平手时 ki < kj 按指纹字典序 |
最小例子 :三个指纹 a / b / c,次数分别是 2 / 5 / 5。Less 先比次数,b 与 c 平手再比字符串,于是稳定输出 b, c, a------跑一百遍都一样。§5.5 里 keysByCount 上方那句注释「breaking ties by key string order」说的就是它。
顺带一个细节:printStackRecord(549~575 行)默认隐藏栈根部的 runtime 帧 (558 行那串 strings.HasPrefix),因为分配栈底部那几层对用户没信息量;可要是整条栈全是 runtime 帧(!show,568 行),它会递归调自己、改成 allFrames=true 重打一遍,绝不交白卷。
一句话记住 :debug 决定用哪种纸;两处排序决定「纸上每一行永远在同一个位置」。
对应源码行 :§5.4 的 491~500 行文本分支、503~527 行 proto 分支;§5.5 的 531~545 行 keysByCount、549~575 行 printStackRecord;§5.2 的 389 行 slices.SortFunc。
5.8 汇合点预告
printCountProfile 的 516~523 行有个 labels 延迟回调,它是大路二(标签)的终点。现在先记住位置,§6、§7 把标签从用户手里一路送到这里,§8 再把两条路合成一张表。
6 labels:label.go 全文
先建画面 :pprof labels 解决的是「同一个二进制里跑多种请求,样本要能按业务维度分组」(
go tool pprof -tag/ 火焰图按标签过滤)。传播载体是 context------但不是每次采样去读 ctx,而是开工前把标签贴到 goroutine 背上。
text
pprof.Do(ctx, labels, f)                    ← 用户入口
  └─ SetGoroutineLabels(ctx)                ← 把 labelMap 指针塞进 g.labels(runtime 字段!)
       └─ 采样时:CPU 剖析把 g.labels 当 tag 附进样本;goroutine 剖析直接读它
6.1 源码逐行(label.go,行号是该文件内的)
go
package pprof                        // ← 5(1~3 行许可头)
                                     // ← 7~12:imports(context/fmt/slices/strings)
type label struct {                  // ← 14:单条标签
	key   string                 // ← 15
	value string                 // ← 16
}                                    // ← 17
                                     // ← 19
// LabelSet is a set of labels.
type LabelSet struct {               // ← 20:用户可见的标签集
	list []label                  // ← 21:★保持按键有序(merge 的前提)
}                                    // ← 22
                                     // ← 24
// labelContextKey is the type of contextKeys used for profiler labels.
type labelContextKey struct{}        // ← 25:零大小键类型(防碰撞)
                                     // ← 26
func labelValue(ctx context.Context) labelMap {   // ← 27:从 ctx 取 labelMap(无则空)
	labels, _ := ctx.Value(labelContextKey{}).(*labelMap)  // ← 28
	if labels == nil {                        // ← 29
		return labelMap{}                     // ← 30
	}                                         // ← 31
	return *labels                            // ← 32:返回副本(小结构,栈上)
}                                                 // ← 33
                                                  // ← 35~37:注释------labelMap 是初步实现,将来换可增量共享的持久结构
type labelMap struct {                // ← 38:其实就是 LabelSet 的包装
	LabelSet                        // ← 39
}                                    // ← 40
                                     // ← 42
// String satisfies Stringer ...(43~44)
func (l *labelMap) String() string {  // ← 45:输出 {"k":"v", ...}(排序,稳定)
	if l == nil {                 // ← 46:nil 安全
		return ""             // ← 47
	}                             // ← 48
	keyVals := make([]string, 0, len(l.list))  // ← 49
	                                   // ← 50
	for _, lbl := range l.list {      // ← 51
		keyVals = append(keyVals, fmt.Sprintf("%q:%q", lbl.key, lbl.value))  // ← 52
	}                                 // ← 53
	                                   // ← 54
	slices.Sort(keyVals)              // ← 55
	return "{" + strings.Join(keyVals, ", ") + "}"  // ← 56
}                                    // ← 57(注:list 已按键有序,这里再排是对 join 结果保险)
                                     // ← 58
// WithLabels returns a new [context.Context] with the given labels added. ...(58~59)
func WithLabels(ctx context.Context, labels LabelSet) context.Context {  // ← 60
	parentLabels := labelValue(ctx)              // ← 61:父标签集
	return context.WithValue(ctx, labelContextKey{}, &labelMap{mergeLabelSets(parentLabels.LabelSet, labels)})  // ← 62:合并结果**重新分配**------不可变语义
}                                              // ← 63
                                               // ← 65
func mergeLabelSets(left, right LabelSet) LabelSet {  // ← 65:有序归并(两输入都按键有序)
	if len(left.list) == 0 {                  // ← 66
		return right                          // ← 67:零值短路
	} else if len(right.list) == 0 {          // ← 68
		return left                           // ← 69
	}                                         // ← 70
	                                           // ← 71
	l, r := 0, 0                              // ← 72:双指针
	result := make([]label, 0, len(right.list))  // ← 73
	for l < len(left.list) && r < len(right.list) {  // ← 74
		switch strings.Compare(left.list[l].key, right.list[r].key) {  // ← 75
		case -1: // left key < right key  // ← 76
			result = append(result, left.list[l])  // ← 77
			l++                              // ← 78
		case 1: // right key < left key   // ← 79
			result = append(result, right.list[r])  // ← 80
			r++                              // ← 81
		case 0: // keys are equal, right value overwrites left value  // ← 82
			result = append(result, right.list[r])  // ← 83:right(新)覆盖 left(旧)
			l++                              // ← 84
			r++                              // ← 85
		}                                       // ← 86
	}                                           // ← 87
	                                            // ← 88
	// Append the remaining elements
	result = append(result, left.list[l:]...)   // ← 90
	result = append(result, right.list[r:]...)  // ← 91
	                                            // ← 92
	return LabelSet{list: result}               // ← 93
}                                                // ← 94
                                                 // ← 96~101:文档------奇数个参数 panic;**当前只有 CPU 与 goroutine 剖析消费 labels**(issue 23458)
func Labels(args ...string) LabelSet {           // ← 102:构造入口 Labels("k1","v1","k2","v2")
	if len(args)%2 != 0 {                    // ← 103
		panic("uneven number of arguments to pprof.Labels")  // ← 104
	}                                        // ← 105
	list := make([]label, 0, len(args)/2)    // ← 106
	sortedNoDupes := true                    // ← 107:乐观假设已有序无重
	for i := 0; i+1 < len(args); i += 2 {    // ← 108
		list = append(list, label{key: args[i], value: args[i+1]})  // ← 109
		sortedNoDupes = sortedNoDupes && (i < 2 || args[i] > args[i-2])  // ← 110:边构造边验证升序
	}                                        // ← 111
	if !sortedNoDupes {                      // ← 112:慢路径
		// slow path: keys are unsorted, contain duplicates, or both
		slices.SortStableFunc(list, func(a, b label) int {  // ← 114:稳定排序
			return strings.Compare(a.key, b.key)             // ← 115
		})                                   // ← 116
		deduped := make([]label, 0, len(list))  // ← 117:去重(后写覆盖先写)
		for i, lbl := range list {           // ← 118
			if i == 0 || lbl.key != list[i-1].key {  // ← 119
				deduped = append(deduped, lbl)   // ← 120
			} else {                           // ← 121
				deduped[len(deduped)-1] = lbl   // ← 122:同 key → 覆盖上一个
			}                                  // ← 123
		}                                      // ← 124
		list = deduped                         // ← 125
	}                                          // ← 126
	return LabelSet{list: list}                // ← 127
}                                              // ← 128
                                               // ← 130
// Label returns the value of the label with the given key on ctx. ...(130~131)
func Label(ctx context.Context, key string) (string, bool) {  // ← 132:读单条
	ctxLabels := labelValue(ctx)             // ← 133
	for _, lbl := range ctxLabels.list {     // ← 134
		if lbl.key == key {              // ← 135
			return lbl.value, true   // ← 136
		}                                // ← 137
	}                                        // ← 138
	return "", false                         // ← 139
}                                            // ← 140
                                             // ← 142
// ForLabels invokes f with each label set on the context. ...(142~143)
func ForLabels(ctx context.Context, f func(key, value string) bool) {  // ← 144:遍历(f 返回 false 提前停)
	ctxLabels := labelValue(ctx)             // ← 145
	for _, lbl := range ctxLabels.list {     // ← 146
		if !f(lbl.key, lbl.value) {      // ← 147
			break                        // ← 148
		}                                // ← 149
	}                                        // ← 150
}                                           // ← 151
6.2 标签三件套速查
| 类型 / 函数 | 通俗解释 | 不变量 |
|---|---|---|
label{key, value} |
一条标签,两个字符串 | --- |
LabelSet{list []label} |
用户可见的标签集 | list 按键有序 |
labelMap{LabelSet} |
内部包装,其实还是那份 list |
挂进 context 的是 *labelMap |
mergeLabelSets |
双指针归并两个有序数组 | 输入必须有序;同 key 时 right 覆盖 left |
Labels(args...) |
构造入口,参数必须成对 | 奇数 panic;慢路径里排序加去重 |
为什么「有序」这么要紧 ?因为
mergeLabelSets(65~94 行)用的是双指针l, r,靠strings.Compare比 key 前进;两个输入只要有一个乱序,归并结果就错。这个不变量由Labels()的慢路径(slices.SortStableFunc+ 去重,114~125 行)和「合并结果本身仍有序」共同保证。
6.3 难点 G|标签为什么不跟着采样走,跟着人走
在纠结什么 :标签明明挂在 context 上,为啥不「每次采样去读一下 ctx」,非要 WithLabels 重新分配、mergeLabelSets 有序归并、再用 unsafe.Pointer 塞进 g.labels。
通俗地说 :因为采样发生在信号处理器里(就是前面说的「被拍肩的工人」),那一刻手上根本没有 ctx ------它只能看见当前 goroutine。所以思路反过来:不是「采样时去找标签」,而是「开工前把标签贴到人背上」。人走到哪,g.labels 跟到哪;派生的子 goroutine 也自动继承(§7 的 40~46 行文档)。
要让「贴一次、多处共享」安全,标签集必须不可变 :WithLabels 每次都 &labelMap{mergeLabelSets(...)} 重新分配(62 行),旧的那份谁也不改;这样多个 g 同时指着同一块内存也不会互相踩,写屏障再保证 GC 看得见这个裸指针(§7 末段)。mergeLabelSets 的双指针归并(72~92 行)则要求输入已按键有序,同 key 时「right 覆盖 left」(83 行),也就是新标签压旧标签。
最小例子:
| 输入 | Labels 怎么处理 |
|---|---|
Labels("b","2","a","1") |
sortedNoDupes 为假 → 慢路径:slices.SortStableFunc 排成 a,b,去重(后写覆盖先写) |
Labels("a","1","a","2") |
慢路径去重后只剩 a=2 |
Labels("a","1","b") |
奇数个参数 → 直接 panic("uneven number of arguments to pprof.Labels")(104 行) |
一个必须如实说的边界 :包文档 96~101 行写明「当前只有 CPU 与 goroutine 剖析消费 labels 」(issue 23458)。对照 heap / block / mutex 的记录结构,它们的数据流里缺的正是「把 g.labels 当 tag 抄进记录」这一环------它们的 countProfile 实现里 Label(i) 要么恒返回 nil,要么根本不经过带标签的那条通道。所以火焰图不是随便按 tag 切都能切出东西。
一句话记住:标签贴在 goroutine 背上、不挂在采样瞬间;不可变结构才敢让多个 g 共享;现在只有 CPU 和 goroutine 会去读它。
对应源码行 :§6 开头传播链示意、62 行 WithLabels 重新分配、65~94 行 mergeLabelSets、102~127 行 Labels、96~101 行的「只有 CPU 与 goroutine」文档;§7 的 36~37 行 SetGoroutineLabels 与末段写屏障说明。
7 labels 落到 goroutine:runtime.go
图 8-3 标签贴一次就够:① 先用 defer 记住父 ctx,② 不可变归并出新标签集,③ 写进 g.labels,④ 业务执行被采样,⑤ 返回或 panic 时还原父标签。CPU 采样、goroutine 剖析与子 goroutine 都从「人背上」读到它,最后经 labels 回调写进 sample,供 go tool pprof -tag 聚合。
看图时留意 ① 那块橙色:defer 写在 WithLabels 之前,才记得住「该还原成谁」(难点 H);底部条也如实标出了「当前只有 CPU 与 goroutine 消费 labels」这个边界。对应 §7.1、§8.2 与难点 G。
先建画面 :这个 52 行的小文件是 labels 的「最后一公里」------从 ctx 进入 g 结构。它借了
//go:linkname后门,把裸指针直接写进 runtime 内部的 goroutine 字段。
7.1 源码逐行(runtime.go)
go
package pprof                        // ← 5(1~3 行许可头;7~11 imports:context/runtime/unsafe)
                                     // ← 13~30:五个 //go:linkname 到 runtime 的桥:
//go:noescape                        // ← 15(修饰 16 行声明)
func runtime_FrameStartLine(f *runtime.Frame) int        // ← 16:proto.go 用
//go:noescape                        // ← 20
func runtime_FrameSymbolName(f *runtime.Frame) string    // ← 21:同上
func runtime_expandFinalInlineFrame(stk []uintptr) []uintptr  // ← 24:同上
func runtime_setProfLabel(labels unsafe.Pointer)   // ← 27:★把指针写进当前 g 的 labels 字段
func runtime_getProfLabel() unsafe.Pointer         // ← 30:读

// SetGoroutineLabels sets the current goroutine's labels to match ctx. ...(32~34:
//     新 goroutine 继承创建者的 labels;低级 API,优先用 Do)
func SetGoroutineLabels(ctx context.Context) {    // ← 35
	ctxLabels, _ := ctx.Value(labelContextKey{}).(*labelMap)  // ← 36:取 ctx 里的 labelMap
	runtime_setProfLabel(unsafe.Pointer(ctxLabels))           // ← 37:裸指针塞给 runtime(g.labels)
}                                                     // ← 38
                                                      // ← 40~46:文档------f 期间生效,返回后还原;子 goroutine 继承
func Do(ctx context.Context, labels LabelSet, f func(context.Context)) {  // ← 47:★惯用入口
	defer SetGoroutineLabels(ctx)                 // ← 48:f 返回/panic 后:恢复父 labels
	ctx = WithLabels(ctx, labels)                 // ← 49:合并新标签
	SetGoroutineLabels(ctx)                       // ← 50:立即生效
	f(ctx)                                        // ← 51:业务代码在此期间被采样 → 带标签
}                                                   // ← 52
7.2 完整传播链(把三段串起来)
text
pprof.Do(ctx, pprof.Labels("route","/api/users"), f)
   │ WithLabels: 归并出新 labelMap(不可变)
   │ SetGoroutineLabels: runtime_setProfLabel → g.labels = &labelMap
   ▼
f() 执行期间:
   • CPU 剖析:sigprof 抓栈时连 g.labels 一起当 tag 写入 profBuf(cpuprof.go 的 tagPtr!)
   • goroutine 剖析:goroutineProfileWithLabels 直接把 g.labels 拉出来
   • go func():newproc 继承 g.labels → 子任务自动带标
   ▼
go tool pprof -http :8080 cpu.prof → VIEW → Flame Graph → SAMPLE → 标签维度重聚合
g.labels 是 *labelMap(unsafe.Pointer 在 runtime 侧),GC 可见性 由 proflabel.go 的写屏障保证------这是为什么 62 行 WithLabels 每次都重新分配(不可变结构可被多个 g 安全共享)。
7.3 配套:40~46 行文档说了什么
Do 保证「f 期间生效、返回后还原、子 goroutine 继承」;SetGoroutineLabels 被标为低级 API,惯用入口就是 Do。这两句是使用约束,不是实现细节------它决定了下一节那个 defer 的位置不能动。
7.4 难点 H|Do 的那行 defer 为什么必须排在前面
在纠结什么 :Do 只有五行,defer SetGoroutineLabels(ctx) 偏偏写在 ctx = WithLabels(ctx, labels) 之前。换个顺序看着也「能跑」,为什么不行。
通俗地说 :Go 的 defer 在写到那一行时就把参数求好值了。47~52 行的实际顺序是:
| 行 | 代码 | 此刻 ctx 是谁 |
|---|---|---|
| 48 | defer SetGoroutineLabels(ctx) |
父 ctx(还没合并新标签) |
| 49 | ctx = WithLabels(ctx, labels) |
换成带新标签的子 ctx |
| 50 | SetGoroutineLabels(ctx) |
立刻把新标签贴到 g.labels |
| 51 | f(ctx) |
业务代码被采样,带标签 |
于是 f 一返回(或 panic),defer 执行的是「把父 ctx 的标签贴回去」------干净还原。若把 defer 挪到 49 行之后,它捕获的就是「带新标签的 ctx」,还原动作等于把新标签又贴一遍,调用方的标签被污染了。这不是风格问题,是 defer 求值时机决定的正确性。
最小例子 (Do 函数体的四行顺序,示意、不能直接编译):
go
defer SetGoroutineLabels(ctx) // 捕获父 ctx,返回时用它还原
ctx = WithLabels(ctx, labels) // 之后 ctx 才变成带新标签
SetGoroutineLabels(ctx) // 立刻把新标签贴到 g.labels
f(ctx) // 业务代码在此期间带标签被采样
一句话记住 :defer 按「写下的那一刻」记参数;放在合并前,才记得住「该还原成谁」。
对应源码行 :§7.1 的 47~52 行 Do 全文,尤其 48 与 49 行的先后;§7.3 的 40~46 行文档。
8 串起来:两条大路完整走一遍
前面七节是按源码文件顺序拆的零件。这一节只做一件事:把 §0.3 的两条大路各跑一遍,让它们在 printCountProfile 的 516~523 行真正碰头。
8.1 大路一:一份剖析怎么被打印
| 步 | 到了哪里 | 关键判断 / 动作 | 源码 |
|---|---|---|---|
| 1 | Lookup(name) |
加锁 + 懒初始化,按名字取出工单 | 271~274 行 |
| 2 | WriteTo(w, debug) |
p.name == "" 零值防御 |
374 行 |
| 3 | 分岔 | p.write != nil → 直接转包(内置窗口到此为止);否则继续 |
377 行 |
| 4 | 自定义分支 | 锁内快照 m → 锁外排序 → stackProfile(all) |
381~391 行 |
| 5 | 通用漏斗 | key() 把「栈 + 标签」拍成字符串,三容器去重计数,keysByCount 排序 |
463~489 行 |
| 6 | 两条出口 | debug>0 文本;debug=0 proto + gzip |
491~527 行 |
一句话:内置靠 write 转包,自定义靠 m 自记;不管谁进漏斗,都先按指纹去重,再按 debug 选纸。
8.2 大路二:一张标签怎么钻进样本
printCountProfile 的 labels 延迟回调(516~523 行)是终点。把起点到终点一次跑通:
| 步 | 函数 / 字段 | 发生了什么 |
|---|---|---|
| 1 | pprof.Labels("route", "/api/users") |
成对参数造出 LabelSet,list 升序 |
| 2 | pprof.Do(ctx, labels, f) |
先 defer SetGoroutineLabels(ctx),再 ctx = WithLabels(ctx, labels),再 SetGoroutineLabels(ctx),最后 f(ctx)(48~51 行) |
| 3 | WithLabels |
labelValue(ctx) 取父集,mergeLabelSets 归并,context.WithValue(ctx, labelContextKey{}, &labelMap{...}) 重新分配(61~62 行) |
| 4 | SetGoroutineLabels |
ctx.Value(labelContextKey{}).(*labelMap) 取出指针,runtime_setProfLabel(unsafe.Pointer(ctxLabels)) 塞进 g.labels(36~37 行) |
| 5 | 采样时刻 | CPU 剖析把 g.labels 当 tag 附进样本;goroutine 剖析由 pprof_goroutineProfileWithLabels 直接拉出;go func() 继承 |
| 6 | 回到漏斗 | 写侧实现里的 runtimeProfile.Label(i) 把指针转回 (*labelMap);printCountProfile 遍历 p.Label(idx).list,逐条 b.pbLabel(tagSample_Label, lbl.key, lbl.value, 0)(519~520 行) |
| 7 | 文件 | pbSample(values, locs, labels) 把标签写进这条 sample,go tool pprof -tag 才能按 route 聚合 |
最容易看漏的一步 :第 2 步的
defer写在WithLabels之前 ,所以defer捕获的是旧的 ctx ;f一返回(哪怕 panic),SetGoroutineLabels(ctx)就把父标签贴回去。若把defer挪到WithLabels之后,恢复的就是「带新标签的 ctx」,等于没还原。完整推演见难点 H。
8.3 三个汇合点
| 汇合点 | 哪两件事在这里碰头 | 位置 |
|---|---|---|
| 工单分岔 | 「转包 runtime」与「自己记账」共用一张 Profile |
377 行 if p.write != nil |
| 打印漏斗 | 异构数据源共用 countProfile 三招 |
404~408 行接口、463~528 行漏斗 |
| 样本成型 | 「栈 + 次数」与「标签」写进同一条 sample | 516~524 行 labels 回调 + pbSample |
把这三行记住,整个用户可见层的结构就立住了:分流在工单、统一在接口、汇合在样本。
9 一页纸速查:8 条不变量
这里把散在各节的「必须成立」翻成「通俗解释 / 谁保证 / 坏了会怎样」。
| # | 通俗解释 | 谁保证 | 坏了会怎样 |
|---|---|---|---|
| 1 | 内置与自定义的分水岭是 count / write 空不空 |
NewProfile 只填 name / m;六个内置项填两个指针 |
分流判断失效,Add 打到一个转包工单上,直接 panic |
| 2 | 六个窗口是固定集合,CPU 不在其中 | lockProfiles 首次只登记六项 |
误以为 Lookup("cpu") 能拿到东西,实际返回 nil |
| 3 | heap 与 allocs 是同一份数据、不同默认列 | 两者共用 countHeap,只差 defaultSampleType |
以为要抓两遍,平白多一次开销 |
| 4 | 打印框架只认 Len / Stack / Label 三招 |
countProfile 接口 + 两个实现 |
新数据类型进不了漏斗,得另写一套打印 |
| 5 | 输出每次都一样 | WriteTo 先排序、keysByCount 平手按字典序 |
报告 diff 全是噪声,没法比对 |
| 6 | 标签集 list 按键有序 |
Labels 慢路径排序去重;归并结果仍有序 |
mergeLabelSets 双指针归并出错,标签张冠李戴 |
| 7 | 标签集不可变、可被多个 g 共享 | WithLabels 每次重新分配 + 写屏障 |
一个 goroutine 改标签,别的 g 跟着变,GC 还可能看丢指针 |
| 8 | f 返回后标签必须还原成父集 |
Do 把 defer 放在 WithLabels 之前 |
调用方标签被污染,后续采样全带错维度 |
这八条是这一层的验收标准。每一个看似绕的结构,最后都能归到其中一条上。读不下去时回来问一句「这句是在守哪条?」,通常就通了。
10 最容易读错的 8 件事
1|「CPU 也是六个内置 Profile 之一,只是名字特殊」 不是。118~120 行明确 CPU 因流式输出走专属 API,Lookup("cpu") 查不到东西(难点 A)。
2|「heap 和 allocs 是两份独立数据,所以 allocs 的 count 该是另一个函数」 恰恰相反:allocsProfile 的 count 就是 countHeap,212 行还专门注释「identical to heap profile」。差别只在 write 传给 writeHeapInternal 的默认视图字符串(难点 B)。
3|「WriteTo 里那段锁内快照、排序、通用框架,每个窗口都会走」 只有自定义窗口走。内置窗口在 if p.write != nil { return p.write(w, debug) }(377 行)就转包出去了(难点 C)。
4|「Add 的 value 随便传什么都行,重复 Add 顶多覆盖一下」 不行。value 要能作 map key,且 344 行对重复 value 直接 panic("Profile.Add of duplicate value")------这是「你用错 API」的信号,不是覆盖(难点 D)。
5|「忘 Remove 只是内存里多留一条,不影响输出」 它恰恰会一直出现在 /debug/pprof/ 那个自定义 profile 的列表里------这正是「泄漏清单」,是特性不是副作用(难点 D)。
6|「printCountProfile 会针对 goroutine / threadcreate / 自定义各写一套输出」 不会。全靠 countProfile 三招把异构数据抹平,再按指纹去重;debug 只分文本 / proto 两条出口(难点 E、难点 F)。
7|「标签是每次采样时去 context 里现读的」 不是。采样在信号处理器里,没有 ctx 可用;标签是 pprof.Do 提前写进 g.labels 的,采样时顺手抄走(难点 G、§6.3)。
8|「所有剖析都支持 labels,火焰图随便按 tag 切」 官方文档(96~101 行,issue 23458)写明当前只有 CPU 与 goroutine 消费 labels ;heap / block / mutex 的数据流里缺「把 g.labels 当 tag 抄进记录」这一环(§6.3)。
11 五分钟复述卡
能把下面 8 句连着讲给别人听(哪怕讲得磕巴),这套机制就算立住了。
- 整条流水线的最后一环是 ④ 抄账员
runtime/pprof:把 ③ 账本里的样本变成go tool pprof能读的文件;本文讲的正是其中的「柜台层」------工单、打印与标签。 - 对外只有
Profile一张工单,五个字段里count/write两个函数指针是分水岭:有值转包 runtime,为 nil 自己用m记。 - 六个内置窗口是固定集合(goroutine / threadcreate / heap / allocs / block / mutex),CPU 因为流式输出不在其中;heap 与 allocs 是同一份数据、只差默认视图。
- 自定义窗口的
Add/Remove就是资源借用登记台,忘Remove的那行永远划不掉------这份「泄漏清单」正是它的经典用途。 - 不管数据从哪来,最后都塞进
countProfile的三招(Len / Stack / Label),由printCountProfile按「栈 + 标签」指纹去重、排序。 debug一个整数分两条出口:debug>0出文本、debug=0出 gzip proto;两处排序保证输出每次都一样。- 标签不跟着采样走、跟着人走 :
pprof.Do把不可变的labelMap一次性写进g.labels,采样时顺手抄走,子 goroutine 自动继承。 Do的defer必须排在WithLabels之前,才记得住「该还原成父标签」;而且当前只有 CPU 和 goroutine 会去读标签。
讲不出第 2 句 → 回难点 C;第 3 句 → §2.4、难点 A/B;第 5 句 → 难点 E/F;第 7、8 句 → §8.2、难点 G/H。
写到这儿,再把开头那个问题答一遍:pprof.Lookup("heap").WriteTo(w, 0) 查到的,是一张只写了名字和两个函数指针的工单;它要么把活儿转包出去,要么自己翻一本 map;不管走哪条路,最后都得进同一个漏斗,按「栈 + 标签」去重、排序,再决定用文本还是 protobuf 写出去。而业务里那张 route=/api/users 的标签,早在采样之前就已经贴在 goroutine 背上了。
分流在工单、统一在接口、汇合在样本------把这三句话记住,那些看似绕的结构,就都能解释成「好像也只能这么写」。