一、 开启gc 日志
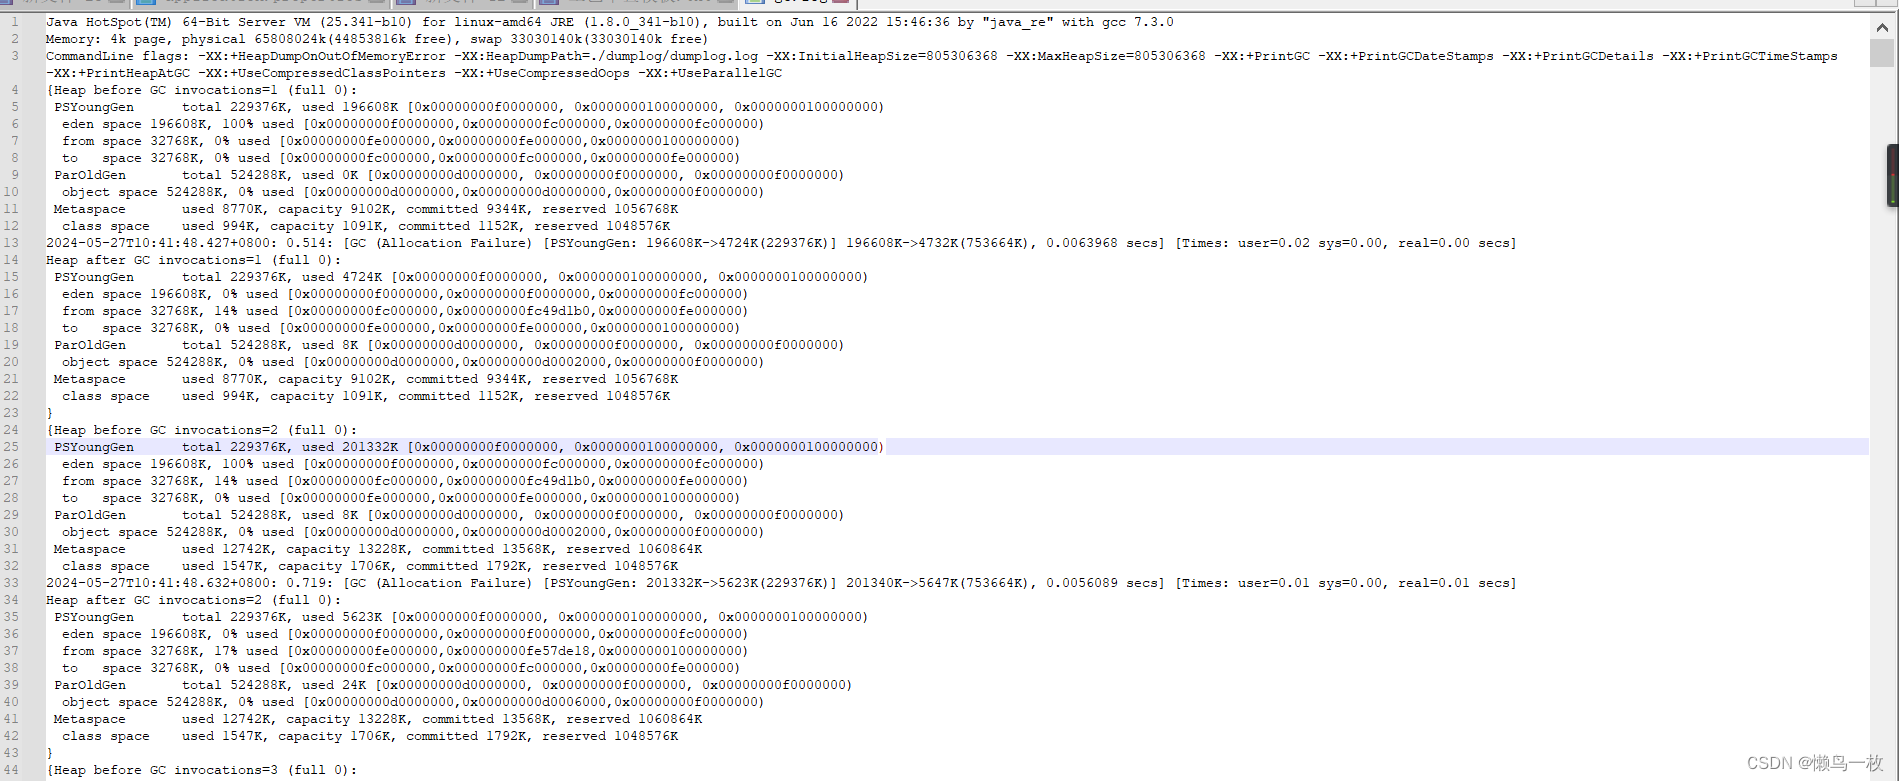
在项目中开启GC 日志打印后会查看gc 日志如下
bash
nohup java -Xms768m -Xmx768m -XX:+HeapDumpOnOutOfMemoryError -XX:HeapDumpPath=./dumplog/dumplog.log -Xloggc:./dumplog/gc.log -XX:+PrintGCDetails -XX:+PrintGCDateStamps -XX:+PrintHeapAtGC -jar xxxx.jar > logsxxx.log 2>&1 &gc日志如下
bash
ava HotSpot(TM) 64-Bit Server VM (25.341-b10) for linux-amd64 JRE (1.8.0_341-b10), built on Jun 16 2022 15:46:36 by "java_re" with gcc 7.3.0
Memory: 4k page, physical 65808024k(44853816k free), swap 33030140k(33030140k free)
CommandLine flags: -XX:+HeapDumpOnOutOfMemoryError -XX:HeapDumpPath=./dumplog/dumplog.log -XX:InitialHeapSize=805306368 -XX:MaxHeapSize=805306368 -XX:+PrintGC -XX:+PrintGCDateStamps -XX:+PrintGCDetails -XX:+PrintGCTimeStamps -XX:+PrintHeapAtGC -XX:+UseCompressedClassPointers -XX:+UseCompressedOops -XX:+UseParallelGC
{Heap before GC invocations=1 (full 0):
 PSYoungGen      total 229376K, used 196608K [0x00000000f0000000, 0x0000000100000000, 0x0000000100000000)
  eden space 196608K, 100% used [0x00000000f0000000,0x00000000fc000000,0x00000000fc000000)
  from space 32768K, 0% used [0x00000000fe000000,0x00000000fe000000,0x0000000100000000)
  to   space 32768K, 0% used [0x00000000fc000000,0x00000000fc000000,0x00000000fe000000)
 ParOldGen       total 524288K, used 0K [0x00000000d0000000, 0x00000000f0000000, 0x00000000f0000000)
  object space 524288K, 0% used [0x00000000d0000000,0x00000000d0000000,0x00000000f0000000)
 Metaspace       used 8770K, capacity 9102K, committed 9344K, reserved 1056768K
  class space    used 994K, capacity 1091K, committed 1152K, reserved 1048576K
2024-05-27T10:41:48.427+0800: 0.514: [GC (Allocation Failure) [PSYoungGen: 196608K->4724K(229376K)] 196608K->4732K(753664K), 0.0063968 secs] [Times: user=0.02 sys=0.00, real=0.00 secs]
Heap after GC invocations=1 (full 0):
 PSYoungGen      total 229376K, used 4724K [0x00000000f0000000, 0x0000000100000000, 0x0000000100000000)
  eden space 196608K, 0% used [0x00000000f0000000,0x00000000f0000000,0x00000000fc000000)
  from space 32768K, 14% used [0x00000000fc000000,0x00000000fc49d1b0,0x00000000fe000000)
  to   space 32768K, 0% used [0x00000000fe000000,0x00000000fe000000,0x0000000100000000)
 ParOldGen       total 524288K, used 8K [0x00000000d0000000, 0x00000000f0000000, 0x00000000f0000000)
  object space 524288K, 0% used [0x00000000d0000000,0x00000000d0002000,0x00000000f0000000)
 Metaspace       used 8770K, capacity 9102K, committed 9344K, reserved 1056768K
  class space    used 994K, capacity 1091K, committed 1152K, reserved 1048576K
}
{Heap before GC invocations=2 (full 0):
 PSYoungGen      total 229376K, used 201332K [0x00000000f0000000, 0x0000000100000000, 0x0000000100000000)
  eden space 196608K, 100% used [0x00000000f0000000,0x00000000fc000000,0x00000000fc000000)
  from space 32768K, 14% used [0x00000000fc000000,0x00000000fc49d1b0,0x00000000fe000000)
  to   space 32768K, 0% used [0x00000000fe000000,0x00000000fe000000,0x0000000100000000)
 ParOldGen       total 524288K, used 8K [0x00000000d0000000, 0x00000000f0000000, 0x00000000f0000000)
  object space 524288K, 0% used [0x00000000d0000000,0x00000000d0002000,0x00000000f0000000)
 Metaspace       used 12742K, capacity 13228K, committed 13568K, reserved 1060864K
  class space    used 1547K, capacity 1706K, committed 1792K, reserved 1048576K
2024-05-27T10:41:48.632+0800: 0.719: [GC (Allocation Failure) [PSYoungGen: 201332K->5623K(229376K)] 201340K->5647K(753664K), 0.0056089 secs] [Times: user=0.01 sys=0.00, real=0.01 secs]
Heap after GC invocations=2 (full 0):
 PSYoungGen      total 229376K, used 5623K [0x00000000f0000000, 0x0000000100000000, 0x0000000100000000)
  eden space 196608K, 0% used [0x00000000f0000000,0x00000000f0000000,0x00000000fc000000)
  from space 32768K, 17% used [0x00000000fe000000,0x00000000fe57de18,0x0000000100000000)
  to   space 32768K, 0% used [0x00000000fc000000,0x00000000fc000000,0x00000000fe000000)
 ParOldGen       total 524288K, used 24K [0x00000000d0000000, 0x00000000f0000000, 0x00000000f0000000)
  object space 524288K, 0% used [0x00000000d0000000,0x00000000d0006000,0x00000000f0000000)
 Metaspace       used 12742K, capacity 13228K, committed 13568K, reserved 1060864K
  class space    used 1547K, capacity 1706K, committed 1792K, reserved 1048576K
}
在项目中如果需要查看使用的垃圾收集器出了使用GC 日志中去分析还可以使用如下命令
bash
java -XX:+PrintCommandLineFlags -version 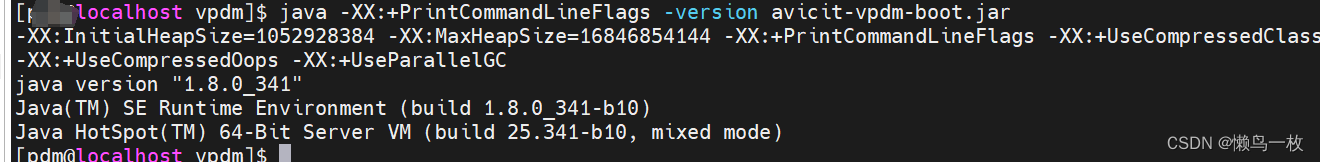
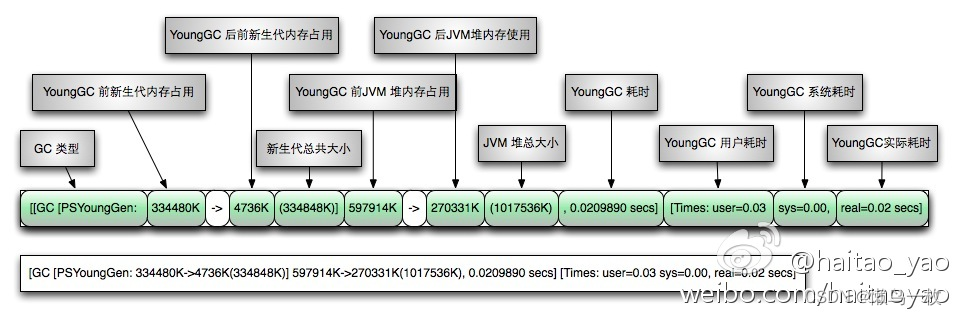
二 GC 日志 Parallel Scavenge+Parallel Old 类型日志分析
jdk1.8以后-XX:+UseParallelGC是默认开启的,所以垃圾回收器的组合就是ps+po,ps+po 类型的垃圾回收器是jdk8 默认的垃圾回收器组合,JDK9 默认是G1垃圾回收器
bash
2024-05-27T10:41:49.016+0800: 1.103: [GC (Metadata GC Threshold) [PSYoungGen: 201464K->8164K(229376K)] 201560K->8268K(753664K), 0.0099723 secs] [Times: user=0.03 sys=0.01, real=0.01 secs]
Heap after GC invocations=4 (full 0):
 PSYoungGen      total 229376K, used 8164K [0x00000000f0000000, 0x0000000100000000, 0x0000000100000000)
  eden space 196608K, 0% used [0x00000000f0000000,0x00000000f0000000,0x00000000fc000000)
  from space 32768K, 24% used [0x00000000fe000000,0x00000000fe7f93d0,0x0000000100000000)
  to   space 32768K, 0% used [0x00000000fc000000,0x00000000fc000000,0x00000000fe000000)
 ParOldGen       total 524288K, used 104K [0x00000000d0000000, 0x00000000f0000000, 0x00000000f0000000)
  object space 524288K, 0% used [0x00000000d0000000,0x00000000d001a010,0x00000000f0000000)
 Metaspace       used 20580K, capacity 21180K, committed 21248K, reserved 1067008K
  class space    used 2594K, capacity 2752K, committed 2816K, reserved 1048576K
}
{Heap before GC invocations=5 (full 1):
 PSYoungGen      total 229376K, used 8164K [0x00000000f0000000, 0x0000000100000000, 0x0000000100000000)
  eden space 196608K, 0% used [0x00000000f0000000,0x00000000f0000000,0x00000000fc000000)
  from space 32768K, 24% used [0x00000000fe000000,0x00000000fe7f93d0,0x0000000100000000)
  to   space 32768K, 0% used [0x00000000fc000000,0x00000000fc000000,0x00000000fe000000)
 ParOldGen       total 524288K, used 104K [0x00000000d0000000, 0x00000000f0000000, 0x00000000f0000000)
  object space 524288K, 0% used [0x00000000d0000000,0x00000000d001a010,0x00000000f0000000)
 Metaspace       used 20580K, capacity 21180K, committed 21248K, reserved 1067008K
  class space    used 2594K, capacity 2752K, committed 2816K, reserved 1048576K
2024-05-27T10:41:49.026+0800: 1.113: [Full GC (Metadata GC Threshold) [PSYoungGen: 8164K->0K(229376K)] [ParOldGen: 104K->8031K(524288K)] 8268K->8031K(753664K), [Metaspace: 20580K->20578K(1067008K)], 0.0254521 secs] [Times: user=0.09 sys=0.00, real=0.02 secs]
PSYoungGen 表示的是由Parallel Scavenge垃圾收集器管理的新生代,ParOldGen表示由Parallel Old管理的老年代。
第一行:
PSYoungGen total 229376K, used 196608K [0x00000000f0000000, 0x0000000100000000, 0x0000000100000000)
Parallel Scavenge垃圾收集器管理的新生代 ,新生代 工229M 使用 196 M
借用其他图说明
Full GC日志
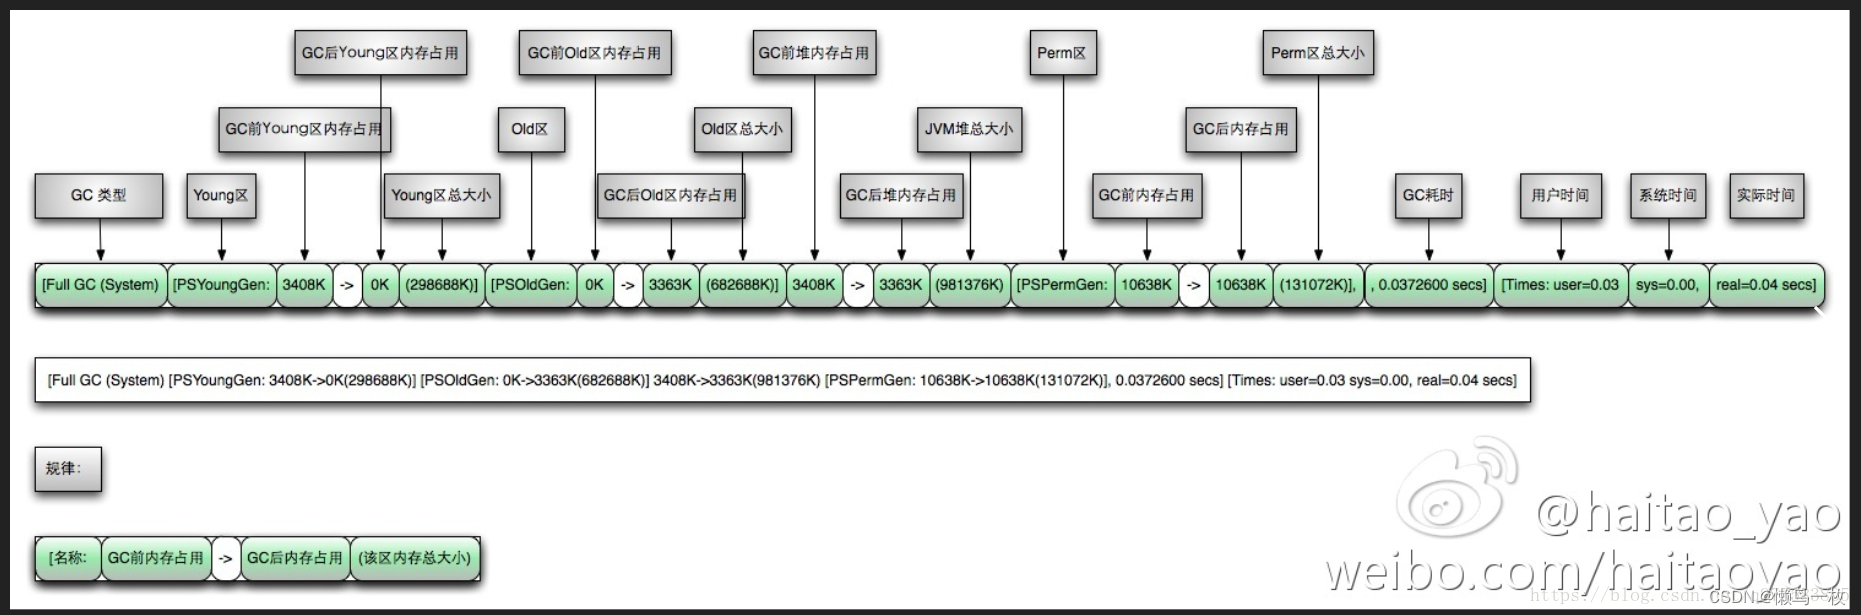
Full GC (Metadata GC Threshold) \[PSYoungGen: 8164K-\>0K(229376K)\] \[ParOldGen: 104K-\>8031K(524288K)\] 8268K-\>8031K(753664K), \[Metaspace: 20580K-\>20578K(1067008K)\], 0.0254521 secs\] \[Times: user=0.09 sys=0.00, real=0.02 secs
[Full GC (Metadata GC Threshold) 表示触发了完整垃圾回收的特定原因是元数据区域的垃圾回收阈值被触发。