拿到数据首先查看数据信息和描述
python
import pandas as pd
import seaborn as sns
import matplotlib.pyplot as plt

# 加载数据(保留原路径,但在实际应用中建议使用相对路径或环境变量)
data = pd.read_csv(r"C:\Users\11794\Desktop\收入分类\training.csv", encoding='utf-8', encoding_errors='replace')

# 查看数据信息和描述
data.info()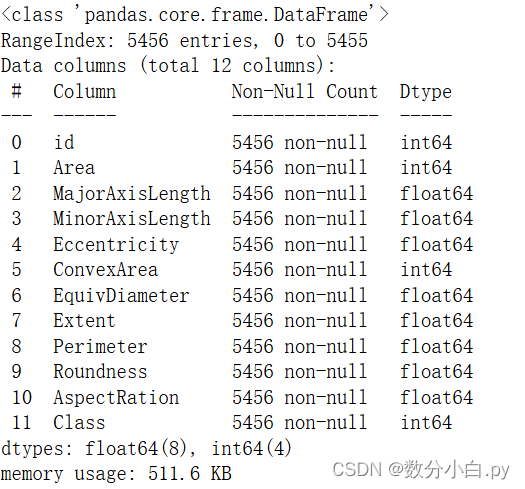
选择数值列进行相关性分析计算相关性矩阵绘制热力图
python
import pandas as pd
import seaborn as sns
import matplotlib.pyplot as plt

# 加载数据(保留原路径,但在实际应用中建议使用相对路径或环境变量)
data = pd.read_csv(r"C:\Users\11794\Desktop\收入分类\training.csv", encoding='utf-8', encoding_errors='replace')

# 绘制热力图
# 选择数值列进行相关性分析
numerical_columns = data.select_dtypes(include=['int64', 'float64']).columns
# 计算相关性矩阵
correlation_matrix = data[numerical_columns].corr()
# 绘制热力图
plt.figure(figsize=(12, 10))
sns.heatmap(correlation_matrix, annot=True, cmap='coolwarm', linewidths=0.5)
plt.title('Correlation Heatmap')
plt.savefig('correlation_heatmap.png', bbox_inches='tight')  # 保存热力图到当前目录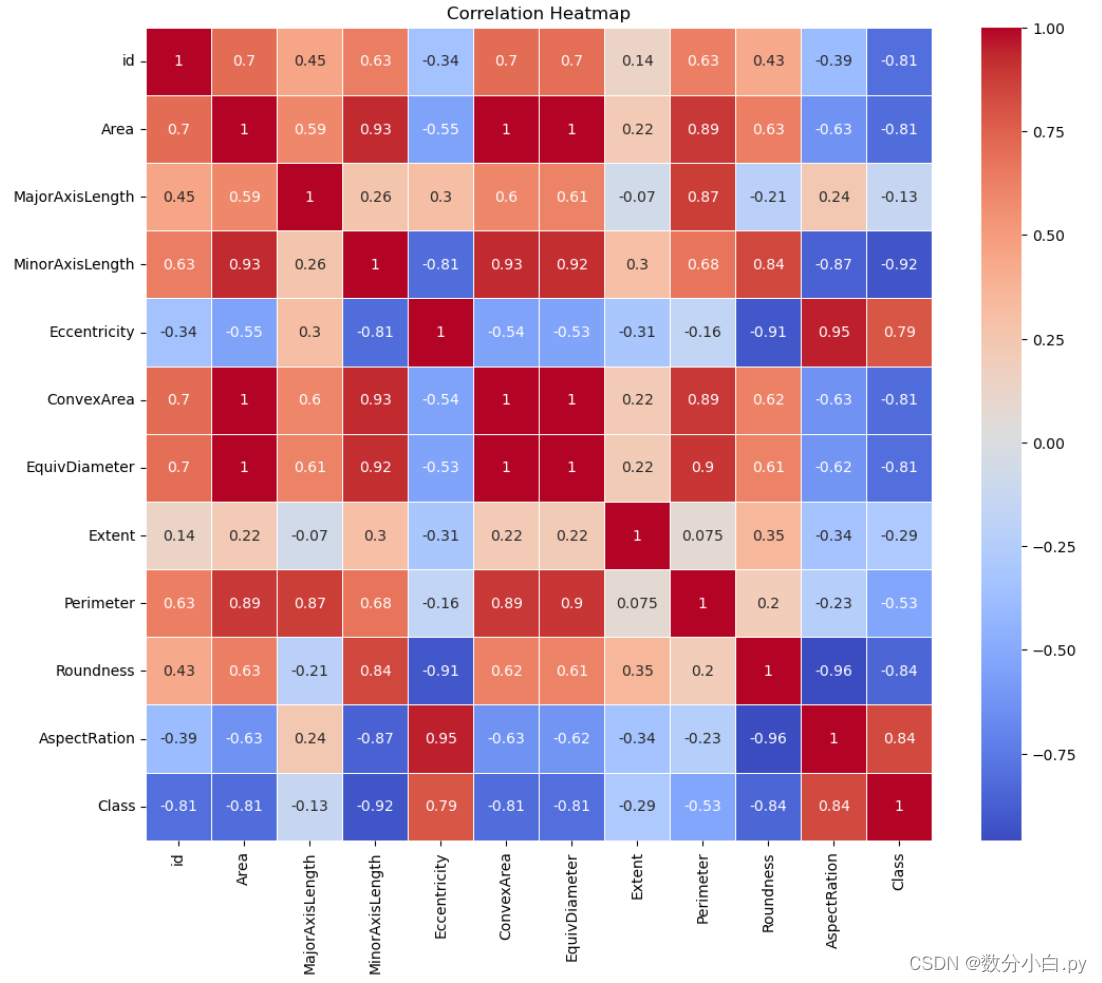
随后就是数据分割 ,创建并训练模型,这里我选择用决策树分类器
python
import pandas as pd
from sklearn.model_selection import train_test_split
from sklearn.tree import DecisionTreeClassifier  # 导入决策树分类器
from sklearn.metrics import classification_report
import matplotlib.pyplot as plt
from sklearn.metrics import roc_curve, auc
import numpy as np

# 加载数据(假设数据保存在CSV文件中)
data = pd.read_csv(r"C:\Users\11794\Desktop\收入分类\training.csv", encoding='utf-8', encoding_errors='replace')
test_data = pd.read_csv(r"C:\Users\11794\Desktop\收入分类\testing.csv", encoding='utf-8', encoding_errors='replace')

# 选择特征和目标变量
X = data.drop(['id', 'Class'], axis=1)
y = data['Class']  # 目标变量是'Class'列

# 数据分割
X_train, X_test, y_train, y_test = train_test_split(X, y, test_size=0.01, random_state=42)

# 创建并训练模型
# 使用决策树分类器
model = DecisionTreeClassifier(max_depth=30, random_state=42)  # 修改此行
model.fit(X_train, y_train)


# 预测测试集并评估模型
y_pred = model.predict(X_test)
print(classification_report(y_test, y_pred))  # 打印分类报告

# 选择test_data中的特征列
test_X = test_data.drop(['id'], axis=1)
# 使用训练好的模型进行预测
test_y_pred = model.predict(test_X)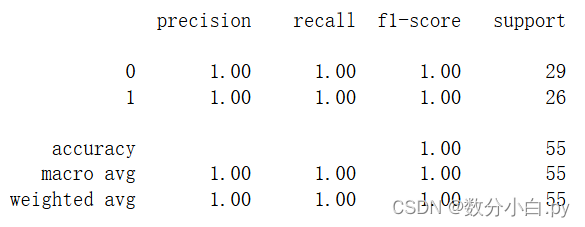
准确率直接1.0 我没在验证集验证,比赛的文件也分享在csdn里了。